
Recommended
More Related Content
Similar to Hydrodynamic noise bulletin
Similar to Hydrodynamic noise bulletin (20)
Recently uploaded
Recently uploaded (20)
Hydrodynamic noise bulletin
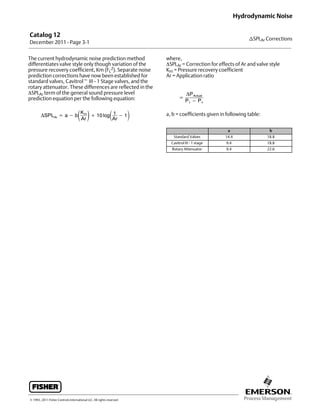
- 1. Catalog 12 December 2011 - Page 3-1 nSPLAr Corrections Hydrodynamic Noise E 1993, 2011 Fisher Controls International LLC. All rights reserved The current hydrodynamic noise prediction method differentiates valve style only though variation of the pressure recovery coefficient, Km (FL 2). Separate noise prediction corrections have now been established for standard valves, Cavitrolt III - 1 Stage valves, and the rotary attenuator. These differences are reflected in the SPLAr term of the general sound pressure level prediction equation per the following equation: ΔSPLAr = a − bKm Ar + 10 log1 Ar − 1 where, SPLAr = Correction for effects of Ar and valve style Km = Pressure recovery coefficient Ar = Application ratio = ΔPActual P1 − Pv a, b = coefficients given in following table: a b Standard Valves 14.4 18.8 Cavitrol III - 1 stage 9.4 18.8 Rotary Attenuator 9.4 22.6
- 2. Line Source Equal Noise levels are on an imaginary cylinder with the pipe centerline as the axis (figure 1). As an observer moves away from the pipeline, the sound pressure level (SPL) decreases inversely to the changes in surface area of the imaginary cylinder. Use the following equation to find the sound pressure level when other than 1 meter from the pipeline surface. SPL = F + 10Log 1 + r R + r where, r = radius of pipe based on outside diameter (meters) R = distance from pipe surface (meters) F = noise level calculated at 1 meter Example What is the noise level 50 feet from a 12 inch pipeline (from table 1, radius is 6.38 inch or 0.16 m) when the Noise Prediction Technique calculates 95 dBA at 1 meter. SPL = (95) + 10Log 1 + 0.16 15.24 + 0.16 SPL = 95 − 11.2 SPL = 83.8 dBA Note This procedure determines the noise level radiated only by the pipeline. Other noise sources could combine with the pipeline noise source to have a greater overall sound pressure level. Point Source Vent applications are typical examples of point source noise (figure 2). As an observer moves away from a point source, the sound level (SPL) decreases inversely to the changes in surface area of the imaginary sphere. Use the following equation to find the sound pressure level when other than 3 meters from the point source and below a horizontal plane through the point source. SPL = F + 20Log 3 R Figure 1. Typical Line Source CROSS SECTION OF PIPELINE A3053 Figure 2. Typical Point Source A3054 VENT TO ATMOSPHERE where, R = distance from source (meters) F = noise level calculated at 3 meters Example What is the noise level 50 feet (15 meters) from the point source when the Noise Prediction Technique calculates 100 dBA at 3 meters. SPL = 100 + 20Log 3 15 SPL = 100 − 14 SPL = 86 dBA Note This procedure determines the noise level radiated only by the point source. Other noise sources could combine with the point source noise to have a greater overall sound pressure level. Table 1. Radii of Nominal Pipe Sizes RADIUS OF PIPE NOMINAL PIPE SIZES, NPS 1/2 3/4 1 1-1/2 2 2-1/2 3 4 6 8 10 12 16 20 24 30 36 Inch 0.42 0.53 0.66 0.95 1.19 1.44 1.75 2.25 3.31 4.31 5.38 6.38 8.00 9.00 12.00 15.00 18.00 Meter 0.0107 0.0133 0.0168 0.0241 0.0302 0.0366 0.0445 0.0572 0.0841 0.11 0.14 0.16 0.20 0.23 0.30 0.38 0.46 Catalog 12 December 2011 - Page 3-2 Sound Characteristics Line and Point Sources E 1983, 2011 Fisher Controls International LLC. All rights reserved www.Fisher.com Responsibility for selection, use, and maintenance of any product remains solely with the purchaser and end user. The contents of this publication are for informational purposes only and are not to be construed as warranties or guarantees, express or implied, regarding the products or services described therein. Fisher and Cavitrol are marks owned by one of the companies in the Emerson Process Management business divi- sion of Emerson Electric Co. Emerson Process Management, Emerson, and the Emerson logo are trademarks and service marks of Emerson Elec- tric Co. All other marks are the property of their respective owners.
- 3. Octave Band Sound Pressure Levels Aerodynamic noise has an overall sound pressure level (measured one meter downstream of the valve and one meter away from the pipe-wall) which does not indicate the sound pressure level in each frequency band. Use the information in table 1 to determine octave band sound pressure levels and to construct a spectrum for a particular trim type and piping combination. Example An NPS 6 valve with Whisper Trim™ III cage has an overall SPL of 85 dBA. The octave band SPLs are as follows: SPL at 63 Hz = 85 + (-50) = 35 dBA 125 Hz = 85 + (-50) = 35 dBA 250 Hz = 85 + (-45) = 40 dBA 500 Hz = 85 + (-33) = 52 dBA 1000 Hz = 85 + (-21) = 64 dBA 2000 Hz = 85 + (-9) = 76 dBA 4000 Hz = 85 + (-6) = 79 dBA 8000 Hz = 85 + (-3) = 82 dBA Table 1. Octave Band Sound Pressure Level Corrections PIPE SIZE NPS PIPE SCHEDULE FOR WHISPER TRIM III (OUTLET VELOCITY ± 0.3 MACH) FOR ALL OTHERS Octave Bands, Hz 63 125 250 500 1000 2000 4000 8000 63 125 250 500 1000 2000 4000 8000 1 1-1/2 2 3 4 5S to XXS 5S to XXS 5S to XXS 5S to XXS 5S to XXS - - - - - - - - - - - - - - - - - - - - - - - - - - - - - - - - - - - - - - - - - - - - - - - - - - - - - - - - - -45 - - - - - - - - - - - - -33 - - - - - - - - - - - - -21 - - - - - - - - - - - - -9 - - - - - - - - - - - - -6 -50 -50 -50 -50 -50 -50 -50 -50 -50 -50 -50 -50 -50 -50 -50 -39 -39 -39 -39 -39 -27 -27 -27 -27 -27 -15 -15 -15 -15 -15 -6 -6 -3 -3 -3 -3 -3 -6 -6 -6 6 8 10 12 14 5S to XXS 5S to 160 5S to 160 5S to 160 5S to 160 -50 -50 -50 -50 -50 -50 -50 -50 -45 -45 -45 -45 -45 -33 -33 -33 -33 -33 -21 -21 -21 -21 -21 -9 -9 -9 -9 -9 -6 -6 -6 -6 -6 -3 -3 -3 -3 -3 -9 -9 -50 -50 -50 -50 -50 -50 -50 -50 -39 -39 -39 -29 -39 -27 -27 -27 -27 -27 -15 -15 -15 -15 -15 -3 -3 -3 -3 -3 -6 -6 -6 -6 -6 -9 -9 -9 -9 -9 -21 -21 16 18 20 5S to 160 5S to 160 5S to 160 -50 -50 -50 -45 -45 -45 -33 -33 -33 -21 -21 -21 -9 -9 -9 -6 -6 -6 -3 -3 -3 -9 -9 -9 -50 -50 -50 -39 -39 -39 -27 -27 -27 -15 -15 -15 -3 -3 -3 -6 -6 -6 -9 -9 -9 -21 -21 -21 24 5S to 160 120 to 160 -45 -50 -33 -45 -21 -33 -9 -21 -6 -9 -3 -6 -9 -3 -15 -9 -39 -50 -27 -39 -15 -27 -3 -15 -6 -3 -9 -6 -21 -9 -33 -21 30 36 42 5S to 30 10 to 40 10 to 30 -45 -45 -45 -33 -33 -33 -21 -21 -21 -9 -9 -9 -6 -6 -6 -3 -3 -3 -9 -9 -9 -15 -15 -15 -39 -39 -39 -27 -27 -27 -15 -15 -15 -3 -3 -3 -6 -6 -6 -9 -9 -9 -21 -21 -21 -33 -33 -33 Catalog 12 December 2011 - Page 3-3 Sound Characteristics Octave Band Sound Pressure Levels E 1993, 2011 Fisher Controls International LLC. All rights reserved
- 4. Figure 1. Noise Source Combination Curve A1749 Combining Noise Sources Two noise levels, calculated separately, can be combined as one overall noise source. The sources can be point, line or a combination of both. Use the following technique. 1. Calculate the noise level of each source at the point where the combined noise level is desired. Use either the line source or point source techniques found on page 3-2. 2. Find the difference in the sound pressure level of the two sources at the new location. 3. Enter the abscissa of figure 1 with the difference found in step 2. Move vertically to intersect the curve. Read SPL at this point. 4. The overall noise level of the two sources is the loud est noise source plus the SPL found in step 3. Catalog 12 December 2011 - Page 3-4 Sound Characteristics Combining Noise Sources E 1983, 2011 Fisher Controls International LLC. All rights reserved www.Fisher.com Responsibility for selection, use, and maintenance of any product remains solely with the purchaser and end user. The contents of this publication are for informational purposes only and are not to be construed as warranties or guarantees, express or implied, regarding the products or services described therein. Fisher and Whisper Trim are marks owned by one of the companies in the Emerson Process Management business division of Emerson Electric Co. Emerson Process Management, Emerson, and the Emerson logo are trademarks and service marks of Emerson Electric Co. All other marks are the property of their respective owners.
- 5. Introduction The major cause of hydrodynamic noise (noise resulting from liquid flow) is cavitation. Cavitation is the process of the formation and subsequent collapse of vapor bubbles in a flowing liquid stream. The noise and damage produced by cavitation may be traced to the collapse of these vapor bubbles. When the vapor bubbles do not collapse, flashing occurs, potentially causing trim damage but little hydrodynamic noise. Source Treatment Cavitation and its associated noise and damage can often be avoided at the design phase of a project if proper consideration is given to service conditions. However, where service conditions are fixed, a valve may have to operate at pressure conditions normally resulting in cavitation. In such instances, noise control by source treatment can be employed by utilizing one of several methods: multiple valves in series, a special control valve, or a standard control valve body with special internal parts. Cavitrol™ III one-stage trim utilizes specially-shaped, diametrically-opposed holes through the cage wall that reduce the fluid's tendency to cavitate and reduce fluid turbulence. When the application pressure drop is within stated values, the trim helps eliminate the cavitation noise and damage. Cavitrol III two- and three-stage and Cavitrol IV trims eliminate cavitation noise and damage by taking the total pressure drop in a series of intermediate stages. In operation, fluid enters the first section of the cage through many orifices. In passing through orifices, each fluid stream undergoes a portion of the total pressure drop. The fluid then passes through a series of additional orifices and undergoes additional pressure drops at each stage. The number of stages required to prevent cavitation damage depends upon the total amount of pressure reduction that must be taken across the cage. A control valve using two- or three-stage Cavitrol III or Cavitrol IV trim will exhibit a sound pressure level of 90 dBA or less. Cavitrol V trim, for use with Vee-Ball™ valves, minimizes cavitation noise and damage by controlling the formation and collapse of vapor bubbles. The trim consists of a carefully designed bundle of tubes installed within the valve, downstream of the V-notch ball. The tubes prevent the flow stream from reaching its potential Table 1. Available Cavitrol Trim Trim Valve Body Pressure Rating Valve Body Design Cavitrol III One-Stage CL125 to CL600 ET CL150 to CL900 EWT ELT CL900 through CL2500 DBAQ Note 1 CC Cavitrol III Two-Stage CL600 ET EWT CL900 EWT (NPS 8 x 6 & 12 x 8) ELT DBAQ EHT CL1500 DBAQ EHT CL2500 DBAQ EHT Cavitrol III Three-Stage CL900 through CL2500 DBAQ EHT Cavitrol IV CL2500 CAV 4 Cavitrol V CL150 and CL300 CL150 through CL600 U V100 Note 1: 10,000 psig API (American Petroleum Institute). minimum area, thus maintaining maximum pressure head and reducing the possibility of vapor bubble formation. Also, the tubes physically limit the size and number of vapor bubbles that can form. In many installations, Cavitrol V trim creates resistance to the flow stream, which produces a back pressure. This back pressure can keep the pressure head from falling below the vapor pressure of the process liquid. Cavitrol V trim can reduce control valve noise by as much as 15 dBA. Table 1 lists available Cavitrol trims. Path Treatment Path treatment of cavitation noise is not generally recommended since cavitation is usually accompanied by severe physical damage to the valve parts or piping components. Such cavitation should not go unchecked because of the potential hazard of eventual valve and piping failure. However, Cavitrol III one-stage trim in a properly-sized valve can be used to control cavitation damage, thus allowing use of the path treatment approach to reduce noise. Catalog 12 December 2011 - Page 3-5 Hydrodynamic Noise Introduction, Source, and Path Treatments E 1983, 2011 Fisher Controls International LLC. All rights reserved
- 6. Figure 1. Typical Path Treatments A3056 To help control cavitation damage, Cavitrol III one-stage trim utilizes a number of pairs of small, diametrically-opposed flow holes through the wall of the cage. Each specially shaped hole admits a jet of cavitating liquid which impacts at the center of the cage with the jet admitted from the opposing hole. Thus a continuous cushion is formed which prevents cavitating liquid from contacting the metal surfaces, ensuring the vapor bubble collapse takes place in the center of the flow stream. Once the cavitation damage is controlled in this manner, it becomes practical to use the path treatment method (figure 1) to reduce the local noise caused by the cavitating liquid. This may be accomplished through the use of heavy-walled pipe and acoustical or thermal insulation. Pipe wall attenuation varies with size and schedule. See page 3-9. Thermal insulation will give approximately three to five dBA attenuation per inch of insulation thickness. Twelve to fifteen dBA is the maximum attenuation that should be expected even with several inches of insulation. Please consult manufacturer's specifications for attenuating capability and application of specific insulation (including higher pipeline temperatures and lower allowable stresses). Acoustical insulation will give an approximate eight to ten dBA attenuation per inch of blanket type insulation; twenty-four to twenty-seven dBA is the maximum attenuation that should be expected even with several inches of insulation. Please consult manufacturer's specifications for attenuating capability and application of specific insulation. Catalog 12 December 2011 - Page 3-6 Sound Characteristics Combining Noise Sources E 1983, 2011 Fisher Controls International LLC. All rights reserved www.Fisher.com Responsibility for selection, use, and maintenance of any product remains solely with the purchaser and end user. The contents of this publication are for informational purposes only and are not to be construed as warranties or guarantees, express or implied, regarding the products or services described therein. Fisher, Cavitrol, and Vee--Ball are marks owned by one of the companies in the Emerson Process Management business division of Emerson Electric Co. Emerson Process Management, Emerson, and the Emerson logo are trademarks and service marks of Emerson Electric Co. All other marks are the property of their respective owners.
- 7. Introduction Use the following procedure to determine the A-weighted sound pressure level (SPL) noise generated by liquid flow through control valves. The information needed is: S Valve style and type of trim S Size and schedule of adjacent piping S Inlet pressure (P1, psia) and pressure drop (ΔP,psi) S Vapor pressure of the liquid (Pv, psia) S Calculated required Cv S Recovery coefficient (Km) S Specific gravity if different from water Hydrodynamic noise in a control valve is dependent on the nature of the pressure recovery downstream of the valve orifice. If the recovery is such that cavitation is present, the resultant noise is higher than if the fluid did not cavitate. The transition from non-cavitating to cavitating is included in the prediction technique. Therefore, the user does not have to determine the onset of cavitation. This level of cavitation is not the same as the levels of cavitation determined by Km and Kc. To calculate the predicted hydrodynamic noise, solve both the non-cavitating and cavitating equations and use the greater of the two as the noise prediction. This procedure can be used for all designs except Cavitrol™ III two- and three-stage trims and Cavitrol IV trim. With Cavitrol III two- and three-stage trims and with Cavitrol IV trims, the sound pressure level will never exceed 90 dBA. For these trims, an additional upper limit of 90 dBA is placed on this procedure because these trims prevent cavitation. Prediction Technique Non-Cavitating SPL = SPLP + SPLCv + SPLk + SPLkm + SPLg Where SPL = Overall noise level (dBA) in decibels at a predetermined point (1 meter downstream of the valve outlet and 1 meter from the pipe surface) SPLP = Base SPL in dB, determined as a function of pressure drop (P) SPLCv = Correction in dB for required liquid sizing coefficient (Cv) SPLK = Correction in dB achieved through the use of heavy-walled pipe and acoustical or thermal insulation SPLKm = Correction in dB for given recovery coefficient (Km) SPLG = Correction in dB for fluids with a specific gravity value which differs from the water (for water, SPLG = 0) Cavitating SPL = SPLΔp + ΔSPLCv + ΔSPLK + ΔSPLAR Where SPL = Overall noise level in decibels (dBA) at a predetermined point (1 meter downstream of the valve outlet and 1 meter from the pipe surface) SPLΔP = Base SPL in dB determined as a function of pressure drop (ΔP) ΔSPLCv = Correction in dB for required liquid sizing coefficient (Cv) ΔSPLk = Correction in dB achieved through the use of heavy-walled pipe and acoustical of thermal insulation ΔSPLAR = Correction in dB for applications ratio [AR = ΔP/(P1-Pv)] and the recovery coefficient (Km) Prediction Example Given: Valve style—Fisher ED Type of trim—standard Adjacent piping—NPS 4 schedule 40 pipe Recovery coefficient (Km)—.7 Inlet pressure (P1)—250 psia Pressure drop (P)—175 psi Vapor pressure(Pv)—11.5 psia (water at 200_F) Calculated required Cg—70 Non-Cavitating SPLΔP = 81 (value from page 3-8) SPLCv = 18 (value from page 3-9) SPLK = -32.9 (value from page 3-9) SPLKm = .7 (value from page 3-10) SPLG = 0 (value from page 3-11) SPL = 66.8 dBA Cavitating SPLΔP = 107 (value from page 3-8) SPLCv = 18 (value from page 3-9) SPLK = -32.9 (value from page 3-9) SPLAR = -8 (value from page 3-10) SPL = 84.1 dBA Catalog 12 December 2011 - Page 3-7 Hydrodynamic Noise Noise Prediction Technique E 1989, 2011 Fisher Controls International LLC. All rights reserved
- 8. Catalog 12 December 2011 - Page 3-8 Hydrodynamic Noise SPL nP vs nP E 1983, 2011 Fisher Controls International LLC. All rights reserved www.Fisher.com Responsibility for selection, use, and maintenance of any product remains solely with the purchaser and end user. The contents of this publication are for informational purposes only and are not to be construed as warranties or guarantees, express or implied, regarding the products or services described therein. Fisher and Cavitrol are marks owned by one of the companies in the Emerson Process Management business divi- sion of Emerson Electric Co. Emerson Process Management, Emerson, and the Emerson logo are trademarks and service marks of Emerson Elec- tric Co. All other marks are the property of their respective owners.
- 9. SPLK Nominal Pipe Size, NPS Pipe Schedule 10 20 30 40 60 80 100 120 140 160 STD XS XXS 1 - - - - - - - - - -48.8 - - - -52.1 - - - - - - - - - -56.1 -48.8 -52.1 -61.1 1-1/2 - - - - - - - - - -42.8 - - - -46.1 - - - - - - - - - -49.9 -42.8 -46.1 -54.3 2 - - - - - - - - - -38.7 - - - -42.8 - - - - - - - - - -47.7 -39.3 -42.6 -50.6 3 - - - - - - - - - -35.9 - - - -39.2 - - - - - - - - - -43.1 -35.9 -39.2 -46.7 4 - - - - - - - - - -32.9 - - - -36.3 - - - -38.9 - - - -40.9 -32.9 -36.3 -43.5 6 - - - - - - - - - -29.5 - - - -33.5 - - - -36.1 - - - -38.5 -29.5 -33.5 -40.4 8 - - - -25.7 -26.6 -27.9 -30.1 -32.0 -33.6 -35.4 -36.6 -37.7 -27.9 -32.0 -37.3 10 - - - -23.5 -25.4 -26.9 -29.8 -31.4 -33.1 -34.7 -36.3 -37.4 -26.9 -29.8 - - - 12 - - - -22 -24.5 -26.3 -29.3 -31.1 -33.0 -34.6 -35.7 -37.2 -25.6 -28.2 - - - 14 -21.2 -23.1 -24.8 -26.2 -28.9 -31.1 -33.1 -34.4 -35.9 -37 -24.8 -27.4 - - - 16 -20.0 -22 -23.6 -26.2 -28.6 -30.9 -32.8 -34.4 -35.9 -36.9 -23.6 -26.2 - - - 18 -19 -21 -24 -26.2 -28.8 -30.9 -32.8 -34.4 -35.6 -36.9 -22.6 -25.2 - - - 20 -18.2 -21.8 -24.3 -25.8 -28.7 -30.8 -32.8 -34.3 -35.8 -36.9 -21.8 -24.3 - - - 24 -16.7 -20.3 -23.9 -25.8 -28.7 -30.8 -32.9 -34.5 -35.7 -37.0 -20.3 -22.8 - - - 30 -16.9 -21.1 -23.1 - - - - - - - - - - - - - - - - - - - - - -18.6 -21.1 - - - 36 - - - - - - - - - - - - - - - - - - - - - - - - - - - - - - -17.2 -19.7 - - - 42 - - - - - - - - - - - - - - - - - - - - - - - - - - - - - - -16.1 -18.6 - - - 44 - - - - - - - - - - - - - - - - - - - - - - - - - - - - - - -15.7 -18.3 - - - 48 - - - - - - - - - - - - - - - - - - - - - - - - - - - - - - -15.1 -17.6 - - - 52 - - - - - - - - - - - - - - - - - - - - - - - - - - - - - - -14.6 -17.1 - - - 56 - - - - - - - - - - - - - - - - - - - - - - - - - - - - - - -14.1 -16.6 - - - 60 - - - - - - - - - - - - - - - - - - - - - - - - - - - - - - -13.6 -16.1 - - - Catalog 12 December 2011 - Page 3-9 Hydrodynamic Noise nSPCCv vs Cv and nSPLK E 1983, 2011 Fisher Controls International LLC. All rights reserved
- 10. Catalog 12 December 2011 - Page 3-10 Hydrodynamic Noise nSPLAR vs AR and nSPLKm vs Km E 1983, 2011 Fisher Controls International LLC. All rights reserved www.Fisher.com Responsibility for selection, use, and maintenance of any product remains solely with the purchaser and end user. The contents of this publication are for informational purposes only and are not to be construed as warranties or guarantees, express or implied, regarding the products or services described therein. Fisher is a mark owned by one of the companies in the Emerson Process Management business division of Emerson Electric Co. Emerson Process Management, Emerson, and the Emerson logo are trademarks and service marks of Emerson Electric Co. All other marks are the property of their respective owners.
- 11. Catalog 12 December 2011 - Page 3-11 Hydrodynamic Noise nSPLG vs G E 1983, 2011 Fisher Controls International LLC. All rights reserved
- 12. This page is intentionally left blank Catalog 12 December 2011 - Page 3-12 Hydrodynamic Noise E 2011 Fisher Controls International LLC. All rights reserved www.Fisher.com Responsibility for selection, use, and maintenance of any product remains solely with the purchaser and end user. The contents of this publication are for informational purposes only and are not to be construed as warranties or guarantees, express or implied, regarding the products or services described therein. Fisher is a mark owned by one of the companies in the Emerson Process Management business division of Emerson Electric Co. Emerson Process Management, Emerson, and the Emerson logo are trademarks and service marks of Emerson Electric Co. All other marks are the property of their respective owners.