1. A Novel approach of Differential Evolution Multi-Objective Optimization
with Stochastic Learning Automata Algorithm to predict Protein Interactions
P.Lakshmi 1
Dr.D.Ramyachitra 2*
1
Ph.D. Research Scholar, Department of Computer Science, Bharathiar University, Coimbatore, Tamilnadu.
visalaks@gmail
2
Assistant Professor, Department of Computer Science, Bharathiar University, Coimbatore, Tamilnadu.
jaichitra1@yahoo.co.in
Abstract - Nowadays, the research of protein interaction prediction increases to propose various methods and technologies in
bioinformatics. By using the BLOSUM62 block substitution Matrix method, the mutation rate of the amino acid and its features
are extracted. For global alignment, Protein interaction is predicted via an Incremental Depth Extension (INDEX) algorithm in
PPIN. However, this approach obtained a minimum score of symmetric substructure and maximum edge correctness. Hence a
novel algorithm DEMOO and SLA methods are proposed to resolve the problem of protein interaction prediction. Three functions
are considered for protein interaction predictions between them, such as calculating nearby related common neighbor’s interaction
between the proteins. Functions have the similarity between proteins. Finding the ratio of the proteins access solvent area related
to the protein complex. The results of the experiments represent the technique is providing better accuracy based on edge
correctness and symmetric substructure score in the protein interaction network.
Keywords: Protein-Protein Interaction Network, Differential Evolution Multi-Objective Optimization with Stochastic Learning
Automata, INDEX algorithm, Blosum62.
1. Introduction
Chowdhury, A., et al., (2016) suggested the various computational methods are invented to predict protein-protein
interaction depends on its characteristics such as, pair of protein pairs and its complex formation, increased problem-
solving methods with less complexity, similar functions, and domains, etc., Interacted protein information gathered
from PPIN in the STRING database, helps to identify one part of lung cancer. Progress of dysfunctional genes in two
levels could contribute to the random walk and restart algorithm used to predict the protein interaction. (Yuan, F., &
Lu, W., 2017) From the protein hubs, protein-protein interaction was identified to describe the novel drug targets by
using the CD-HIT tool with the clustering method to group the Orthologous proteins. (Uddin, R, and Jamil, F., 2018)
Zhang, C., et al., (2018) Presented a novel method which comprises the Meta Gene Ontology to describe the
information of protein interaction belongs to the attributes of the proteins from the annotation of the homology-based
structure prediction and network mapping of the protein interaction network. Protein interaction prediction uses to
find the protein function, for that SMISS is described to predict protein function and the information of homologs is
fetched from PSI-BLAST, PPIN, Gene interaction networks. Cao. Et al., (2016) Chemicals of the protein features can
be extracted by using the DNN model and DL-CPI method proposed to predict the protein interaction with the datasets
either balanced or imbalanced. Tian, K., et al., (2016) Various techniques in computational biology applied to predict
the host-pathogen PPIs, that is related to MRSA and Humans, based on the characteristics of homologs and its
interacted protein partners, it helps to implement the potential drug targets by using the data collected from DIP with
BLAST operation. Uddin, R., et al., (2017) Wei, Z. S., et al., (2016) suggested predicting the sites of the interacted
2. protein by using the classification methods with an ensemble of SVM and SSWRF with the representation of the
lower-dimensional features such as evolutionary conversation, hydrophobic property, and hydrophilic property are the
features found from target residue and its relations. To overcome the existing methods, a new algorithm is proposed
by using DEMOO and SLA. The remaining chapters are structured as follows: Section II represents the methodology
of proposed algorithms for protein-protein interaction networks. Chapter third represents the performance of the
results for proposed methods. The fourth chapter summarizes the conclusion of the research and further enhancements.
2. Methodology
Overall system architecture for the proposed system is discussed for that, the proposed algorithm
flowchart and advantages are presented.
System Architecture
Fig -1 A Framework of DEMOO-SLA method for Protein-Protein Interaction Prediction
2.1 Feature Extraction
The mutation rate of the amino acid features are extracted by BLOSUM62 matrix follow the N x 20 block
substitution matrix, transferred into an HP matrix (High dimensional protein) by the less complex transformation
which is described as,
3. In the above equation, P= p1, p2, p3…pN describes the Number of the amino acid sequences and B(i,j) defines the
BLOSUM62 20 X 20 matrix. In the given equation, all sequences of the protein are taken as the size of the protein
feature coefficients. Hence, each pair of the proteins has a total number of feature coefficients.
A Two-dimensional linear discriminant analysis method is adopted. To reduce the number of feature dimensions,
energy and noise reduction concentrated. Let 800 pairs of protein pairs of features with high dimension HPI where I
= 1, 2…N. I denote a pair of proteins. The two DLDA approach is designed with two mappings are: 𝐿 ∈ 𝐼𝑅𝑟×𝑝
𝑎𝑛𝑑𝑅 ∈
𝐼𝑅𝑐×𝑞
, to direct the real high dimension 𝐻𝑃𝐼 ∈ 𝐼𝑅𝑟×𝑐
space into the lower-dimensional space 𝐵𝑃𝐼 ∈ 𝐼𝑅𝑝×𝑞
. The
mapping is defined as:
To find the solution of the optimal linear mapping problem with L and R, within class Fw and inter-class Fb matrix
used. To get the optimum value of L and R, minimum value Fwand maximum value Fb is achieved by using the
formula given below,
Where, ith class mean 𝑚𝐼 =
1
𝑛𝐼
∑ 𝑥
𝑥∈𝛱𝐼
and global value of the mean 𝑚 =
1
𝑛
∑ ∑ 𝑥
𝑥∈𝛱𝐼
𝑘
𝐼=1
Equations (3) and (4) values are assigned to the iterative algorithm. After the number of iterations, protein pair
features with high dimension HP can be reduced to the low dimension pair of protein features with the values r,c.
2.2 Label Propagation Algorithm
In the graph approach, the Physiochemical properties of the protein sequences were considered to predict the
protein interaction by using the method Network Fusion Similarity and the LPA method. Amino acid features and
their mutation rate are extracted by the matrix method named BLOSUM62, which locates the sequence of the proteins
into a block substitution matrix. Hydrophobicity and amino acids mutation rate acts as the protein sequence features.
4. 2.3 Incremental depth extension (INDEX) approach
This algorithm executes the global alignment with multiple stages in PPIN. Initial alignment depends on the
matching strategy of the scores. For score calculation; biological and topological scores of the proteins are computed.
By using these measures proteins are aligned and it selects the proteins with a high score. New alignments are
expanded with them till the last alignment is to be reached. A new method DEMO-SLA is proposed for protein
interaction prediction in PPIN. The protein interaction network is represented with a solution vector by combining the
weights [0,1] of interacted pair of proteins and the establishment of the protein connections is described based on the
threshold. In the proposed approach, Edge correctness is decreased and the Symmetric substructure score value is
increased with high performance.
2.4 Formation of a PPI Network
The number of Proteins P in PPIN has high P x (P-1) /2 interactions. To monitor the observation, it has represented
by a vector 𝑉
⃗ with dimensions 1 x D where,
The 𝑚𝑡ℎ position of 𝑉
⃗ , defined as Vm ∈ (0,1)where m = 1,2,…. D-1 and wi,j are denoted as weight computed
between the interacted proteins Pi and Pj.
Where i=1,2,…. p-1 and j= i+1,i+2,….p.
2.5 Neighborhood Topology with Protein interaction prediction
Pair of protein interactions is possible when it relates to the size of its neighbor. In the interacted protein pairs pi
and Pj, the common size of the neighborhood to be determined by the identification of protein p1 in the PPIN.
The weight of interaction 𝑤𝑖,𝑗between proteins 𝑝𝑖𝑎𝑛𝑑𝑝𝑗is fetched in the related common proteins in the PPIN.
From the pair of proteins pi and pj with the relevant weights, interacted proteins are identified depends on the particular
threshold Th.
In PPIN, Wi,l ( or Wl,i) > Th and Wjl (or Wl,j) > Th. The accurate pair of proteins pi and pj predicted with the weight
of the protein interactions between them and they have measured by the similarity. If ni,j is the number of all protein
pairs p, then Wil (or Wli) > Th and Wjl (orWlj) > Th. By measuring the interaction weight wi,j, its common ratio of
5. the neighborhood interaction ratio d |ni,j|/N, the accuracy is decided in interacted protein pairs pi and pj in PPIN. The
requirement is accomplished by maximizing the equation given below,
From the above equation, 𝜀 represents a small minimized positive constant. By assigning the equation given below,
protein interaction weights may accurately predict in a network.
2.6 Functional Characteristics of Protein Interaction Prediction
Proteins possess interacted molecular functions and are sited in homo cellular sections. It relates to similar
functions and biological processes. Functionally two similar interacted proteins pi and pj are maximized in the PPIN
with the equation given below,
2.7 Predicting PPIs using ASA
Accessible solvent Area reduction of protein interaction pi and pj and its strength is computed depends on the
binding is given below,
With the above equation, 𝐴𝑆𝐴(𝑝𝑖)𝑎𝑛𝑑𝐴𝑆𝐴(𝑝𝑖_𝑗), the formation of the protein complex is denoted between the pi
and pj of the protein. The maximization of the similarity between the pair of protein interaction prediction is computed
after ASA binding by the equation shown below,
6. It estimates the pair of protein interaction predictions. To ensure the maximum value of J3, protein interaction
predictions of pi and pj with weights wi,j has a high reduction in ASA with its binding individuals of the complex are
evaluated.
2.8 Differential Evolution algorithm for Multi-Objective Optimization
(a) Initialization: Let Pt initialized with the first population of NP with Dimensional D vector of DEMOO as
given below,
In search area, generation t = 0 initialized for i = [1, NP] randomly. The crossover rate CR starts with 0,1.
The kth
Position value is computed by the vector 𝑉
⃗𝑖(0). Where k = 1,K and I = 1,NP with function [Jk (𝑉
⃗𝑖(0))].
(b) Mutation: Creation of the donor vector 𝑉
⃗𝑖 (𝑡) with the related target vector 𝑉
⃗𝑖 (𝑡).
Where I = 1, NP which depends on the DE/rand/1mutation system. A
By assigning the values to the above equation, Random solution 𝑉
⃗𝑟1(𝑡), 𝑉
⃗𝑟2(𝑡)𝑎𝑛𝑑𝑉
⃗𝑟3(𝑡)from Pt. It describes the
scaling factor within [0, 2], where 𝑖 ≠ 𝑟1 ≠ 𝑟2 ≠ 𝑟3.
(c) Crossover CR: A test vector 𝑈
⃗
⃗ 𝑖(t) is produced with the concern of the binomial crossover for both couple
proteins of a vector𝐷
⃗⃗ 𝑖(𝑡)[Donar] with the required vector 𝑉
⃗𝑖(𝑡) [target] represented by the equation shown
below,
For𝑗 = [1, 𝐷] where 𝑗𝑟𝑎𝑛𝑑 ∈ [1, 𝐷] is to select the indexes randomly.
2.9 Stochastic Learning Automata (SLA)
It is supportive learning that depends on the classes. It acts as a learning agent control at level-wise responses from
the atmosphere. Let 𝑆 = {𝑠1, 𝑠2, … , 𝑠𝑚} , an agent with a list of m states atmosphere given. Let, 𝐴 =
{𝑎1, 𝑎2, … , 𝑎𝑛}Selection of agent from the n actions at each state belongs to S i.e., 𝑠𝑖 ∈ 𝑆.
7. Pseudo code for DEMOO-SLA
3. Results And Discussion
Performance measures of the proposed method are compared with the existing methods in terms of Edge
Correctness and Symmetric substructure score.
3.1 Performance measures
The comparison is made in terms of the performance metrics referred to as the Edge Correctness and Symmetric
substructure score that is defined in the following subsections.
8. 3.1.1 Edge Correctness (EC)
Particular criteria of the first network alignment of the edges with its percentage indicate to align with one edge to the
next network (second network). In second network nodes are related between one another i.e., g(u)&g(v) belongs to
u and v. Edge Correctness calculated by using the formula shown below,
3.1.2 Symmetric substructure score (𝑺𝟑
)
The symmetric substructure score is one more measure of the topological alignment evaluation. Penalty considers
from the EC as unaligned edges in G1 but in (𝑆3), it contains the unaligned edges in G1 and G2. It induced subgraph
relates to V1 nodes of G2 as penalties. (𝑆3) is computed by using the formula is shown below,
In the above equation, |𝑓(𝐸1)| denotes the aligned edges & 𝐺2[𝑓(𝑉1)] indicates the induced sub-graph
corresponding to𝑉1nodes in 𝐺2 network.
3.2 Performance comparison of existing and proposed methods for DIP and SCOP datasets
Here the proposed approach has been compared with the existing approach. The results are shown that the method
is better than the existing approaches for DIP and SCOP datasets. The tables and graphs have represented the
comparison of performance measures for the PPI dataset.
Table-1 Performance comparison of existing and proposed methods for DIP dataset
Dataset Algorithms Edge correctness (EC) Symmetric substructure
score (3S)
DIP
LPA 89 76
INDEX 82 83
DEMO-SLA 72 91
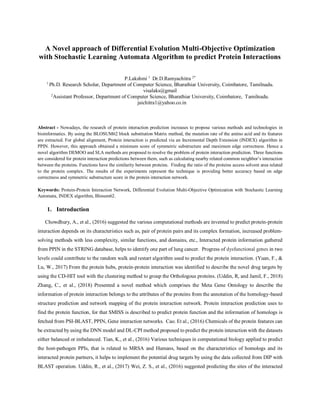
9. Fig-2 Performance comparison with Edge correctness and Symmetric Substructures using DIP Dataset
The above figure shows that the comparison results of the proposed approach with the existing method in terms of
edge correctness and symmetric substructure score (3S).EC and 3S are represented on X-axis. From the bar chart, the
proposed approach provides a high symmetric substructure score and low edge correctness.
Table-2 Performance comparison of existing and proposed methods for SCOP dataset
Dataset Algorithms Edge correctness (EC) Symmetric substructure score (3S)
SCOP
LPA 90 68
INDEX 81 79
DEMO- SLA 70 89
10. Figure -3 Performance comparison of existing and proposed methods for SCOP dataset
Comparative results of the proposed approach with the existing method in terms of edge correctness and symmetric
substructure score (3S). EC and 3S are represented on X-axis. From the bar chart, the symmetric substructure score is
increased and edge correctness is decreased for the proposed approach when compared with the existing methods. The
comparison is made in terms of the accuracy, sensitivity, specificity, and F1-score performance measures that are
defined in the following subsections.
3.2.1 Sensitivity
Sensitivity or recall represents the percentage of positive values that are correctly identified and computed using
the formula given below,
3.2.2 Specificity
It is defined by the ratio of true negatives that are described as a negative performance of the results and it is shown
in the following equation given below,
11. 3.2.3 F1-score
The F-measure has described the average of the information retrieval of the recall and precision measures shown
below,
In the above equation, precision denotes as𝑃𝑟𝑒𝑐𝑖𝑠𝑖𝑜𝑛 =
𝑇𝑟𝑢𝑒𝑃𝑜𝑠𝑖𝑡𝑖𝑣𝑒
𝑇𝑟𝑢𝑒𝑃𝑜𝑠𝑖𝑡𝑖𝑣𝑒+𝐹𝑎𝑙𝑠𝑒𝑃𝑜𝑠𝑖𝑡𝑖𝑣𝑒
.
3.2.4 Accuracy
The overall accuracy rate of the classification is calculated by using the formula as follows,
Fig – 4 Comparison of performance measures with existing and proposed methods
12. The results are shown that the proposed algorithm is better than the existing methods for PPI datasets. The tables
and graphs have represented the comparison of performance measures for the PPI dataset. Here the results and
discussion of the existing and proposed algorithms are discussed. Also, the PPI dataset is used in the experimental
study. The comparisons of existing and proposed approaches are given. In the experimental results, it has been found
that the proposed methods perform better than the existing approach.
4. Conclusion
This paper presents a novel algorithm to predict Protein interaction with the Multi-Objective Optimization (MOO)
problem. Local filtering and global optimization search evaluated by using the algorithms Multi-objective
optimization and the Stochastic Learning Automata. From the experiment of the methods, the results have shown that
the proposed approach is providing better accuracy results in terms of edge correctness and symmetric substructure
score. In the future, this research work to be extended as this method for PPIs prediction for the unbalanced, small
sample dataset. Besides, the invention of the new methods can deal with the problem of imbalanced data and classes.
Meanwhile, seeking discriminative features is helpful to predict the sites of the Proteins in Protein-Protein Interaction
Networks.
References
[1] Chowdhury, A., Rakshit, P., &Konar, A. (2016). Protein-protein interaction network prediction using stochastic learning
automata-induced differential evolution. Applied Soft Computing, 49, 699-724.
[2] Feng, Z. J., Xu, S. C., Liu, N., Zhang, G. W., Hu, Q. Z., & Gong, Y. M. (2018). Soybean TCP transcription factors:
Evolution, classification, protein interaction and stress, and hormone responsiveness. Plant Physiology and Biochemistry.
[3] Du, T., Liao, L., Wu, C. H., & Sun, B. (2016). Prediction of residue-residue contact matrix for protein-protein interaction
with Fisher score features and deep learning. Methods, 110, 97-105.
[4] Tian, K., Shao, M., Wang, Y., Guan, J., & Zhou, S. (2016). Boosting compound-protein interaction prediction by deep
learning. Methods, 110, 64-72.
[5] Wei, Z. S., Han, K., Yang, J. Y., Shen, H. B., & Yu, D. J. (2016). Protein-protein interaction site prediction by ensembling
SVM and sample-weighted random forests.Neurocomputing, 193, 201-212.
[6] Cao, R., & Cheng, J. (2016). Integrated protein function prediction by mining function associations, sequences, and
protein-protein and gene-gene interaction networks. Methods, 93, 84-91.
[7] Uddin, R., &Jamil, F. (2018). Prioritization of potential drug targets against P. aeruginosa by core proteomic analysis
using computational subtractive genomics and protein-Protein interaction network. Computational Biology and
Chemistry.
[8] Lai, J. K., Ambia, J., Wang, Y., & Barth, P. (2017). Enhancing Structure Prediction and Design of Soluble and Membrane
Proteins with Explicit Solvent-Protein Interactions. Structure, 25(11), 1758-1770.
[9] Zhang, C., Zheng, W., Freddolino, P. L., & Zhang, Y. (2018). MetaGO: Predicting Gene Ontology of non-homologous
proteins through low-resolution protein structure prediction and protein-protein network mapping. Journal of molecular
biology.
[10] Uddin, R., Tariq, S. S., Azam, S. S., Wadood, A., &Moin, S. T. (2017). Identification of Histone Deacetylase (HDAC)
as a drug target against MRSA via interlock method of protein-protein interaction prediction. European Journal of
Pharmaceutical Sciences, 106, 198-211.
13. [11] Uddin, R., Tariq, S. S., Azam, S. S., Wadood, A., &Moin, S. T. (2017). Identification of Histone Deacetylase (HDAC)
as a drug target against MRSA via interlock method of protein-protein interaction prediction. European Journal of
Pharmaceutical Sciences, 106, 198-211.