
Recommended
More Related Content
What's hot
What's hot (20)
Similar to The standard Automated Perimetry and staging of Glaucoma
Similar to The standard Automated Perimetry and staging of Glaucoma (20)
Recently uploaded
Recently uploaded (20)
The standard Automated Perimetry and staging of Glaucoma
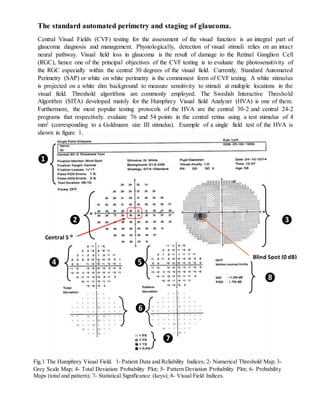
- 1. The standard automated perimetry and staging of glaucoma. Central Visual Fields (CVF) testing for the assessment of the visual function is an integral part of glaucoma diagnosis and management. Physiologically, detection of visual stimuli relies on an intact neural pathway. Visual field loss in glaucoma is the result of damage to the Retinal Ganglion Cell (RGC), hence one of the principal objectives of the CVF testing is to evaluate the photosensitivity of the RGC especially within the central 30 degrees of the visual field. Currently, Standard Automated Perimetry (SAP) or white on white perimetry is the commonest form of CVF testing. A white stimulus is projected on a white dim background to measure sensitivity to stimuli at multiple locations in the visual field. Threshold algorithms are commonly employed. The Swedish Interactive Threshold Algorithm (SITA) developed mainly for the Humphrey Visual field Analyzer (HVA) is one of them. Furthermore, the most popular testing protocols of the HVA are the central 30-2 and central 24-2 programs that respectively evaluate 76 and 54 points in the central retina using a test stimulus of 4 mm2 (corresponding to a Goldmann size III stimulus). Example of a single field test of the HVA is shown in figure 1. ❶ ❷ ❸ ❹ ❺ ❽ ❻ ❼ Fig.1 The Humphrey Visual Field. 1- Patient Data and Reliability Indices; 2- Numerical Threshold Map; 3- Grey Scale Map; 4- Total Deviation Probability Plot; 5- Pattern Deviation Probability Plot; 6- Probability Maps (total and pattern); 7- Statistical Significance (keys); 8- Visual Field Indices. Blind Spot (0 dB) Central 5 ⁰
- 2. Printout of the Humphrey visual field test Results following the first few preliminary tests (learning courses) are preferable for further analysis. The identifiable zones that are systematically analyzed in a single field test of the HVA includes the following: 1. Patient data and reliability indices {fig.1 (1)}. The most important information in the patient data is the age of the patient. It should be imputed correctly as most parts of the result are compared against an age-matched database by the software of the HVA. Generally, a test with false positive <15 %, false negative <20 % and a fixation loss of not more than 20% is considered reliable. 2. The numerical threshold map {fig.1 (2)}. This zone provides a raw estimated threshold values at each test point in decibels (dB). In a normal situation, the RGC photosensitivity threshold values within the central 5 degrees is in the range of 35-37dB and decreases by 3-5dB for every 10 degrees outwards. 3. The gray scale map {fig.1 (3)}. This is the image of the threshold in a gray scale and provides geographical representations of the numerical threshold map. Areas with a higher sensitivity have brighter field while those with reduced values have darker fields. A good result will always have the blind spot represented by a dark spot (absolute scotoma) corresponding to a zero dB 15 degrees temporal from the center. NB. If the blind spot on the printout is on the left-hand side of the examiner, the result is for the left eye of the patient and if on the right-hand side of the examiner, that is the result of the right eye of the patient. 4. Numerical total deviation probability plot {fig.1 (4)}. This shows an age-matched deviation (in numerical values) of the photosensitivity in each investigative point. It may not be very reliable in glaucoma evaluation as other causes of depression in photosensitivity have influence on the result of this zone. 5. Numerical pattern deviation probability plots {fig.1 (5)}. This zone highlights focal loss of photosensitivity in numerical values achieved after correction for diffused loss of sensitivity like cataract, uncorrected refractive error or small pupil. 6. Probability map {fig.1 (6)}. Bellow each of the numerical deviation probability plots (total and pattern) is a probability map (statistical display) that provides a statistical significance of the numerical deviations. It demonstrates the percentage of the normal population who measure below the patient's value at a specific retinal point with p values that ranges between <5% to <0.5%. The lower the p value, the greater its clinical significance and the lesser likelihood of the defect having occurred “by chance”. Thus, points with p values <1% or <0.5% significances are more reliable. NB. The pattern deviation probability map is more reliable for glaucoma assessment. 7. key {fig.1 (7)}. This provides an interpretation for the statistical display. 8. Visual field indices {fig.1 (8)}. The following are the important visual indices of the HVA: (A) Mean deviation (MD). This index represents the average differences between age-matched corrected sensitive value and the measured threshold value at all test point expressed in decibels. Its most often expressed with a negative sign. However, subjects who are able to see dimmer stimuli than others of similar age and race will have positive values. (B) Pattern standard deviation (PSD). This index measures the local spatial variability of the visual field. (C) Glaucoma Hemifield Test (GHT). It is an index that compare local defect of the upper half of the field with these in the mirror-like zone of the
- 3. lower hemifield. Its glaucoma lesions determination ability is relatively high. Results of this index are classified as “within normal limits”, “outside normal limits” or “borderline”. The classification of outside normal limits at 96% normal confidence limits is designed to identify glaucoma. Staging Glaucoma basedonthe Humphrey visualfield - The Hodapp classification (NB. highly simplified in the current write up) The Hodapp (Hodapp-Anderson-Parrish or Bascom Palmer) glaucoma classification is based mainly on the values of the MD, the probability map of the pattern deviation plots and the threshold values in the central 5 degrees of the numerical threshold map. Glaucoma suspect / ocular hypertension / No or very minimal glaucomatous loss (stage 0) 1) MD 0.00 or better 2) Does not meet any other criteria for stage 1 Early glaucomatous loss (Stage 1) 1) MD between -0.01 to -5.90 dB 2) Fewer than 18 points depressed below the 5% probability level and fewer than 10 points below the p < 1% level on the pattern deviation probability map 3) No point in the central 5 degrees with sensitivity less than 15 dB 4) GHT “Outside Normal Limits” Moderate glaucomatous loss (Stage 2) 1) MD between -6.01 to -12.00 dB 2) Between 19 to 36 points depressed below the 5% probability level and 12 to18 points below the p <% level on the pattern deviation plots 3) At least one point within the central 5 degrees with sensitivity of <15 dB, but no any point with absolute deficit (0 dB) in the central 5 degrees 4) Only one hemifield containing a point with sensitivity < 15 dB within the central 5 degrees Advance glaucomatous loss (Stage 3) 1) MD worse than - 12 dB 2) More than 37 points depressed below the 5% probability level or more than 20 points below the p < 1% level 3) Presence of any point with an absolute deficit (0 dB) in the central 5 degrees 4) Both hemifields (upper and lower) containing a point(s) with sensitivity < 15 dB in the central 5 degrees References 1. Mills RP, Budenz DL, Lee PP. et al. Categorizing the stage of glaucoma from pre-diagnosis to end-stage disease. Am. J. of Ophthalmol. 2006;141(1):24–30. 2. Terminology and guidelines for glaucoma. Eur. Glaucoma Soc. 4th ed. Savona : Publicomm, 2014.