Don Talend Geospatial Rural Utility Mobile Mapping Article
•
0 likes•107 views

Startup acquires multi-technology mobile mapping systems to build geographic information systems for rural utility maintenance, by Don Talend, brand storytelling, content strategy and demand generation expert. Geospatial technology industry

Recommended
Recommended
More Related Content
What's hot
What's hot (11)
Similar to Don Talend Geospatial Rural Utility Mobile Mapping Article
Similar to Don Talend Geospatial Rural Utility Mobile Mapping Article (20)
More from Don Talend
More from Don Talend (20)
Recently uploaded
Recently uploaded (20)
Don Talend Geospatial Rural Utility Mobile Mapping Article
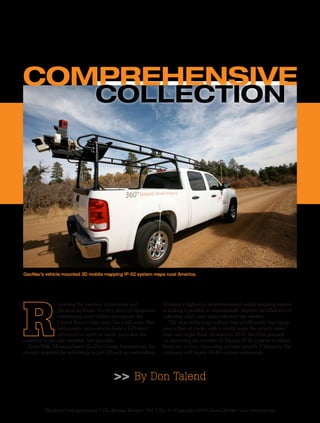
- 1. >> By Don Talend ecording the location, dimensions and physical attributes of every piece of equipment constituting rural utilities throughout the United States might seem like a tall order. But information tools used to build a GIS have advanced so much in recent years that the endeavor is not only possible, but plausible. Great Falls, Montana-based GeoNav Group International, Inc. recently acquired the technology to pull off such an undertaking. Utilizing a high-tech, vehicle-mounted mobile mapping system is making it possible to exponentially improve the efficiency of collecting utility asset data collection (see sidebar). The new technology collects data so efficiently that equip- ping a fleet of trucks with it would make the project easier than one might think. In summer 2010, GeoNav planned on increasing the number of Topcon IP-S2 systems it utilizes from one to four, depending on sales growth. Ultimately, the company will deploy 30-40 systems nationwide. Comprehensive GeoNav’s vehicle mounted 3D mobile mapping IP-S2 system maps rural America. Collection Displayed with permission • The American Surveyor • Vol. 7 No. 6 • Copyright 2010 Cheves Media • www.Amerisurv.com
- 2. Growing with Technology GeoNav was founded in December 2005 by two military veterans: Guner Gardenhire, who had served as a com- munications technician in the U.S. Air Force, and Erik Potter, who had served as an enlisted submarine navigator in the U.S. Navy. The company began by creating custom data sets for Garmin GPS units that specialized in electric utility and military applications. In 2008 the company was tasked with creating and deploying new technology to better map rural America, resulting in a nationwide mapping initiative backed by the National Rural Telecommunications Cooperative (NRTC), which represents the advanced telecommunications and information technology interests of more than 1,400 rural utilities and affiliates in 48 states. The cooperative’s investment in the project was intended to find technology that would make rural utility GIS more affordable and usable for utility engineering and asset mapping. “We had a little bit of an epiphany one day when we were looking at Google Street View and thought, gosh, if we could get data at a higher resolution out to the utilities and linked into their GIS, that would be powerful,” said Potter. A key component of the new data-collection method is high-resolution, ground-level imagery. Casey Saxton, GeoNav’s chief technology officer and nVIEW 360 manager, researched and purchased a high-speed digital camera to capture 360-degree images. With GeoNav’s old data-collection system, field personnel walked up to a utility pole and captured the GPS coordinates with a handheld sub-meter GPS data logger and, typically, one digital photo. Joey Grzyb, project manager, recalled the first utility territory he mapped shortly after joining the company in mid-2008–the Tallahatchie Valley Electric Power Association in Mississippi. A crew of field mappers used handheld GPS units to capture the coordinates of utility poles, covering the 28,000-customer, 4,300-mile utility over the course of a year, utilizing a combina- tion of trucks, all-terrain vehicles and walking to get around. However, post-processing the data into a GIS was time-consuming because the Redundant and integrative technologies provide GeoNav Group International, Inc. with the capability to capture enough data via vehicular collection for rural utilities to build sophisticated geographic information systems used in proactive asset management. The spatial data content that the system collects also can be used by multiple entities including county government, public works departments, and telephone and gas utilities for monitoring assets. Topcon Positioning Systems’ IP-S2 incorporates three redundant positioning technologies with 360-degree digital imaging and laser scanners. The system mounts on the back of a vehicle and consists of a dual-frequency, dual-constellation Global Navigation Satellite System (GNSS) receiver that establishes the geospatial position of the vehicle, an inertial measurement unit (IMU) that tracks vehicle attitude (pose), and external wheel encoders that capture odometry data from the vehicle. Integration of these technologies creates a three-dimensional position for the vehicle and provides accurate tracking in challenging or denied GNSS environ- ments. A high-resolution digital camera provides 360-degree images. The image resolution that these cameras can provide is continually increasing. The system records and time-stamps inputs with an update rate of 15 nanoseconds. Referencing the vehicle location data, the system can capture data from the assets. The IP-S2 also uses 3D laser scanners with an effective range of 30 meters. Every second, the scanners col- Multiple Technologies Collect Georeferenced 3D LiDAR point cloud data viewed in Spatial Factory software. Video images allow GIS analysts at utilities to monitor the condition of assets visually. Displayed with permission • The American Surveyor • Vol. 7 No. 6 • Copyright 2010 Cheves Media • www.Amerisurv.com
- 3. components were not integrated, Grzyb said. Potter added that a data-collection process largely dependent on human judgment was subject to errors that proved costly to fix via return trips to the field. To Potter, a labor-intensive post- processing task beats a labor-intensive data-collection process any day. “If you’re doing a traditional inventory and walking up to each pole and entering all of the information, there are about 50 attributes per power pole,” he said. “It’s pretty easy at the end of a long, lect 45,000 x, y and z points that are used to obtain accurate geospatial positions for assets. Traditionally, LiDAR data have been collected from the air. Because this system collects the data from ground level, it provides critical data that cannot be obtained from aerial surveys. A laptop computer inside the truck uses a Web browser to communicate with the IP-S2 via an Ethernet cable. Data collection does not require an Internet connection. “We can add additional scanners to it and change things out,” noted Casey The Topcon IP-S2 uses mul- tiple, redundant technologies to capture rich geospatial data that utilities can use to develop geospatial informa- tion systems for monitoring assets. Credit: Don Talend Asset Data GeoNav Project Manager Joey Grzyb views planned and completed vehicle routes for a rural telecommunication project. Saxton, GeoNav’s chief technology officer and GIS project manager. “It’s modular, so it allows us to adapt as things change in the industry.” hot day to make a mistake and miss something. Traditional inventories have a lot of mistakes, as much as 15 percent data entry error. When you figure that a power utility may have 70,000 poles at 50 attributes per pole, it adds up to more than three million entries. You really want less than 2 percent, which is generally not achievable by humans.” “Where the unique power of this technology comes into play is, you can have many people look at one point in time,” added Saxton. Collecting vast quantities of data with the new system allows previously unforeseen analyses of utility infrastructure such as a joint-use study. “[A utility has] the ability to visit the entire system many times and it doesn’t have that transport cost–that’s where the expense comes into play,” Saxton said. The advanced technology is a major factor in GeoNav’s strategy, according to Saxton. “We’ve actually developed a business model based on utilizing this type of equipment. If you took LiDAR and the high-speed camera out of the equation, we would not have developed this strategy for doing this type of remote sensing.” Customization Required In spring 2010, GeoNav was “driving” two utility territories in the western United States with the IP-S2 system. Taos, New Mexico-based Kit Carson Electrical Cooperative serves more than 29,000 members in Taos, Colfax and Rio Arriba counties and its overhead lines span more than 2,700 linear miles in northern New Mexico. Closer to GeoNav’s Durango, Colorado office is the Empire Electric Association, Inc., which serves more than 15,000 industrial and residential custom- ers over 1,869 miles of energized line in Displayed with permission • The American Surveyor • Vol. 7 No. 6 • Copyright 2010 Cheves Media • www.Amerisurv.com
- 4. a 3,500-square-mile service territory in southwest Colorado and southeast Utah. By June 2010, GeoNav had driven the entire territory. Grzyb figures 90 percent of the roads he drives for rural utilities are dirt roads. To identify an electric utility territory, he just follows power lines. “The geography of an area plays a huge role in how many miles we cover in a day,” said Grzyb. “Currently he covers about 60 miles a day driving Empire.” In contrast, Potter and Grzyb pointed out that Taos, which became part of the United States in 1846, has narrow streets and was not designed for large volumes of vehicular traffic, so driving it takes a bit longer. “We take the most conservative miles per hour and estimate based on the number of miles,” said Potter. “If you look at a typical rural electric area, it would take 18 months to conduct a traditional facilities’ inventory with six to eight people working every day, five days a week–we’re now accomplishing the same thing in less than four months with two people in the field. If we used two vehicles, it would reduce the time to less than two months. We’re going from having six or more people in the field who could collectively map 400 power poles a day to mapping 800 power poles in an hour if Joey does 40 miles an hour.” GeoNav is taking advantage of the fine detail-capturing capability of the IP-S2. Grzyb added, “Another thing we’re looking at out there on these county roads and U.S. Forest Service roads is the encroachment of vegetation. Many times you wouldn’t see that there are power lines. That’s information that a co-op could definitely benefit from.” This is a situation where a LiDAR point cloud defines a shape that is not easily identifiable with imagery. Processing the Data GeoNav’s work in New Mexico and Colorado likely constitutes the greatest amount and most detail of asset data ever gathered from utility systems in rural America. Before GIS development occurs, two post-processing steps take place. First, LiDAR points are colorized using the images. Next, GPS signals are differentially corrected to provide assets’ geospatial positions to within less than 2½ inches. After post-processing, the data are integrated into other systems within the GIS. Two tasks in integrating data are digitizing (selecting assets in the LiDAR point cloud for inclusion in a GIS) and attributing (recording their attributes). During the attributing process, junior GeoNav GIS technicians recorded the attributes of assets such as power poles and compared them against specifica- tions. The power of LiDAR lies in the measurement capability a point cloud provides. For a utility, this capability is critical. A power line sagging over a highway can overload and cause an expensive outage, or a truck might contact it, resulting in injury or death. A utility’s GIS analysts typically are tasked with a more thorough inven- tory of asset conditions than what occurs during the attributing process. According to Potter, subsequent data collection within a given utility’s terri- tory will occur as growth dictates. Grzyb points out that some regions–particu- larly those that have sustained damage from ice storms, hurricanes, tornadoes or flooding–might require updates at least annually. “The South and the Midwest will probably be areas where they would need constant updating.” Beneficial in Outage Management Potter recognizes that a GIS offers an electric utility distinct value in terms of managing assets and outages, so when it comes to getting a GIS built, time truly is money. The geospatial data aids outage management, since it is incorpo- rated into the electric model that utility personnel can use to pinpoint parts of the territory affected by an outage. “If you figure that a power outage can cost hundreds of dollars a minute in crews, trucks and dispatchers, as well as lost electricity revenues, and considering all Alisa Gardiner, Empire Electric Association GIS/mapping technician views an IP-S2 vehicle trajectory over a local basemap in ArcGIS. “...people haven’t even begun to realize all the uses of the information that can be derived from it...” Displayed with permission • The American Surveyor • Vol. 7 No. 6 • Copyright 2010 Cheves Media • www.Amerisurv.com
- 5. of the safety issues involved, the faster they can respond to those outages, the better off they are,” said Potter. Data accessed by customer service per- sonnel can be shared with the operations staff when a GIS is developed. The goal is building a model that is centrally available to utility personnel. In non-emergency situations, utilizing these data to schedule pre-emptive maintenance on power lines can also save money. For example, a cus- tomer service staff can identify peak loads and determine that a particular transformer will be overloaded under a consistent peak load. The result of not replacing that transformer, Potter said, might be a line meltdown and replacement might cost at least $100 per foot of conductor. He continued, “If you look at this technology, people haven’t even begun to realize all the uses of the information that can be derived from it. For example, utilities have a lot of problems with right of way, knowing where the fence lines are, where the highway boundaries are. [The Colorado Department of Transportation] is pretty strict about that. Someday, a highway may need to be widened. Empire won’t have to come out and figure out which poles to move– they’ll already have the data. Also, are trees underneath the lines? Do they need to be trimmed next year? Do they need to budget for that? Better information facilitates better decision making.” At Empire’s headquarters in Cortez, Colorado, located about 45 miles west of Durango, engineering manager Glen Noble and Alisa Gardiner, GIS/mapping technician, anticipated the future impact of a GIS they are upgrading with GeoNav’s data in ESRI’s ArcGIS. Previously, “We just had basic maps of the system without much detail,” said Noble. “We knew where the lines went and we generally knew where most of the consumers were. The lines were probably reasonable, but we didn’t know anything about the poles or the equipment.” Noble anticipates that the new GIS data will assist Empire in periodically replacing poles and conductor line in some sections of the territory. “Basically, we just replace a section of line as either more consumers are out there, the old poles just aren’t keeping up, or it’s time to get out there and replace a section of line.” The GIS will allow Empire to take a more methodical approach to identifying assets in need of repair or replacement, according to Gardiner. “I will finally have a complete database of where exactly the lines and poles are,” she said. “I’ll be able to know what’s on every pole and, in some cases, I’ll be able to see the condition of poles. We’ll know the spacing of poles and we’ll know if the lines are older.” Acknowledging that processing the GIS data is a significant undertaking, Gardiner planned to flag assets in need of repair or replacement in the GIS. “Because you have the ability to config- ure the database however you want, you can flag whatever you want,” she noted. Multiple utility departments will be able to access the files, Gardiner added. Noble pointed out that providing staking crews with access to a staking package that uses such accurate data offers the potential to yield significant productivity benefits. “If they’re talking to consumers about changing their service or hooking up new service, they can look at the site terrain model while they’re on the phone with the consumer, rather than just trying to remember what the area looks like.” Potter added that the ability to capture the terrain in the GIS might save the staking crew a trip to a site in some cases. Noble surmised that a possibility in future outage management is indicating outages on a territory map. Such a map would indicate to customer service personnel in real time which areas of the territory are being serviced by crews. Don Talend of Write Results Inc., West Dundee, IL, is a print and e-con- tent developer specializing in covering technology and innovation. A close-up view of the IP-S2 3D mobile mapping system shows integrated 360-degree camera, laser scanners, GPS tracking and IMU components. Displayed with permission • The American Surveyor • Vol. 7 No. 6 • Copyright 2010 Cheves Media • www.Amerisurv.com