LIDAR Magizine 2015: The Birth of 3D Mapping Artificial Intelligence
•
2 likes•517 views

Artificial intelligence (AI) has the potential to take the LiDAR mapping market into hypergrowth. Following Moore’s law, with computation capacity doubling every 2 years, it is now possible for point cloud feature extraction to outpace the speed of data generation from laser scanning systems using artificial intelligence.

Recommended
Recommended
More Related Content
What's hot
What's hot (18)
Viewers also liked
Viewers also liked (14)
Similar to LIDAR Magizine 2015: The Birth of 3D Mapping Artificial Intelligence
Similar to LIDAR Magizine 2015: The Birth of 3D Mapping Artificial Intelligence (20)
Recently uploaded
Recently uploaded (20)
LIDAR Magizine 2015: The Birth of 3D Mapping Artificial Intelligence
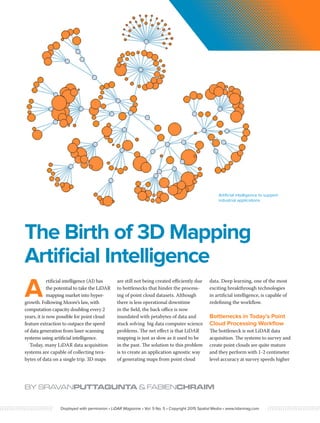
- 1. BY SRAVANPUTTAGUNTA & FABIENCHRAIM A rtificial intelligence (AI) has the potential to take the LiDAR mapping market into hyper- growth. Following Moore’s law, with computation capacity doubling every 2 years, it is now possible for point cloud feature extraction to outpace the speed of data generation from laser scanning systems using artificial intelligence. Today, many LiDAR data acquisition systems are capable of collecting tera- bytes of data on a single trip. 3D maps are still not being created efficiently due to bottlenecks that hinder the process- ing of point cloud datasets. Although there is less operational downtime in the field, the back office is now inundated with petabytes of data and stuck solving big data computer science problems. The net effect is that LiDAR mapping is just as slow as it used to be in the past. The solution to this problem is to create an application agnostic way of generating maps from point cloud data. Deep learning, one of the most exciting breakthrough technologies in artificial intelligence, is capable of redefining the workflow. Bottlenecks in Today’s Point Cloud Processing Workflow The bottleneck is not LiDAR data acquisition. The systems to survey and create point clouds are quite mature and they perform with 1-2 centimeter level accuracy at survey speeds higher The Birth of 3D Mapping Artificial Intelligence Artificial intelligence to support industrial applications Displayed with permission • LiDAR Magazine • Vol. 5 No. 5 • Copyright 2015 Spatial Media • www.lidarmag.com
- 2. than 60-70 mph. The real challenge is to manage the huge point cloud datasets being generated by the data acquisition and labeling those point cloud datasets to generate reports and maps. The feature extraction bottleneck persists in industries including road, rail utilities, solar, construction, mining, and oil and gas. A few hours of surveying on a typical mobile LiDAR platform can lead to many weeks of point cloud feature extraction work. In addition, compliance with existing customer specifications is necessary to ensure seamless integration with their current workflow and operations. Prior to Civil Maps, no general purpose 3D mapping platform existed to automatically process point clouds for multiple customer specifications. Given the goal of building general purpose 3D mapping services, a company face two approaches. The first approach is to create a specialized boutique consulting agency that caters to a few asset types and tries to focus on customers who need that par- ticular report specification. The better alternative is to create a technology that works with any industry vertical or customer report specification. More specifically, the methodology should utilize artificial intelligence that can be trained to specialize in different report specifications very quickly. The benefits of the second approach is that it can leverage computational capacity (Moore’s law), which doubles every two years, and keep pace with the amount of data being generated. In the more traditional consulting approach, it takes roughly 6 months for a team of software engineers to productize a point cloud processing algorithm to look for one asset (ex. centerlines, buildings, lane markings, signals, signs, etc.). Sequentially, it would take hundreds of companies or multiple decades for a single company to handle the demand in the market. This approach is clearly not scalable. In order to meet the market needs, it is essential to use a robust technology that scales well but also adapts to different customer and industry requirements. At Civil Maps, we develop artificial intelligence that can quickly identify thousands of different asset types in our customers’ varied industries. Civil Maps flow diagram Unsupervised learning architecture Displayed with permission • LiDAR Magazine • Vol. 5 No. 5 • Copyright 2015 Spatial Media • www.lidarmag.com
- 3. A Deep Learning Approach to Point Cloud Processing Civil Maps goes beyond traditional AI techniques, and uses deep learning to train models for different use cases. At a high level, the process is simple: apply training methods to learn the specifics of each type of map, and then apply the findings to raw point cloud data. The goal is to assemble asset descriptors into a map (or report), and generate meaningful analytics that act as event triggers for operational, construction or planning decisions. Training The Civil Maps training process is shown above, in block diagram form. At the input is a randomly gener- ated environment with simulated assets injected alongside real assets extracted for various point clouds. Some examples are shown here. Other inputs are comprised of survey point clouds, with layers of assets annotated using traditional point- and-click methods. The middle component of our training process consists of millions of different algorithms, which are made up of graphs of feature primitives applied with different configurations. These feature primitives range from simple geometric analyses, to statistical measurements on points and clusters, to color and intensity assessment, etc. Millions of combinations of feature primitives in various orders and under different parameters are then attempted on the input data. The output of each algorithm is then compared to an expected output (e.g. the location of the assets and their individual properties). The attempted algorithms are evaluated for timing, result accuracy, detection rates and false positive rates. The results of different algorithms are then fed back into a learning policy component to remove entire branches which perform poorly, and reinforce the ones with favorable outcomes. The result of the training step is the selection of one or more algorithms (combinations of feature primitives) which achieve the expected output, with a desired false positive rate, and at an appropriate speed. Map Generation and Visualization Once the training process is completed and the candidate algorithms isolated, survey data is ready for processing and map generation. In the example of energy transmission assets, the utility poles are mapped and their geometry analyzed. Then the power lines are identified and segmented. Clearance measurements are performed by traversing each line with a region of interest around it, to detect and report vegetation encroachment or right-of- way violations. Randomly generated transmission lines in a dense forest setting Randomly generated transmission lines with sparse vegetation Displayed with permission • LiDAR Magazine • Vol. 5 No. 5 • Copyright 2015 Spatial Media • www.lidarmag.com
- 4. Results Using the Civil Maps framework, it is possible to generate and analyze hun- dreds of thousands of high fidelity point clouds. Looking at these representative datasets, we evaluate this methodology to derive the results shown here, for three different industry verticals. Conclusion Taking this methodology and frame- work, Civil Maps plans to revolutionize the LiDAR mapping landscape by leveraging an artificial intelligence platform. We have made some headway into setting the new standard bench- marks in terms of performance and accuracy. We hope to partner and work with more industry winners who want to be part of the next generation of 3D mapping technology. Sravan Puttagunta is the CEO and co-founder of Civil Maps. His background is in machine learning, video and image processing. Fabien Chraim, PhD is the CTO and co-founder of Civil Maps. With his team, he brings large-scale computing to support critical infrastructure missions. Utility Power Line Transmission / Distribution Asset type Detection rate False positive rate Localization accuracy Transmission pole 99.999% / pole 10^-9 / sq km 10 cm (base or top) Distribution pole 99.997% / pole 10^-7 sq km 2–10cm (survey dependent) Electrical lines 99.97% / 1m of line 10^-5 / sq km 3cm Asset type Detection rate False positive rate Localization accuracy Road/lane centerline 99.95% / 1km of road 10^-5 / sq km 3–10cm (survey dependent) Curb line 99.95% / 1km of road 10^-5 sq km 3–10cm (survey dependent) Sign / Signal posts 99.997% / post 10^-7 / sq km 2–10cm (survey dependent) Roadways Rail Asset type Detection rate False positive rate Localization accuracy Rail / Rail centerline 99.95% / 1km of rail 10^-6 / sq km 3 cm Overhead wire 99.95% / 1km of rail 10^-6 / sq km 3cm (survey dependent) Sign / Signal posts 99.997% / post 10^-7 / sq km 2–10cm (survey dependent) Civil Maps Visualizer showing a raw point cloud along with annotated energy assets Displayed with permission • LiDAR Magazine • Vol. 5 No. 5 • Copyright 2015 Spatial Media • www.lidarmag.com