
Recommended
Recommended
More Related Content
Viewers also liked
Viewers also liked (20)
Similar to Qcl 14-v3_Cause-Effect Diagram Late arrival of students_SIMSREE_Divya Adity Selvaraj Nadar
Similar to Qcl 14-v3_Cause-Effect Diagram Late arrival of students_SIMSREE_Divya Adity Selvaraj Nadar (8)
Recently uploaded
Recently uploaded (20)
Qcl 14-v3_Cause-Effect Diagram Late arrival of students_SIMSREE_Divya Adity Selvaraj Nadar
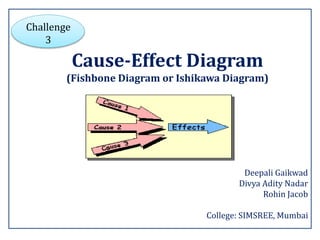
- 1. Cause-Effect Diagram (Fishbone Diagram or Ishikawa Diagram) Challenge 3 Deepali Gaikwad Divya Adity Nadar Rohin Jacob College: SIMSREE, Mumbai
- 2. What is Cause-Effect Diagram A graphic tool that helps to Named after Mr. Kaoru Ishikawa – Japanese Quality pioneer in The Kawasaki Shipyards first used in 1960 and is one of seven basic tools of Japanese quality Also known as the Ishikawa Diagram , it represents relationship between a given outcome and all the factors that influence the outcome Technique was published in the book "Introduction to Quality Control “ by Mr. Kaoru Ishikawa in 1990 Also called as Fishbone diagram because of the resemblance of the diagram with a fishbone Diagram structure : Problem statement in the head of Fish Major causes at the end of major bones Identify problems Sort problems Display possible causes of a problem
- 3. Medical Emergency for self Getting Up Late Accident while driving Caught without papers of car/bike Met a friend, started chatting Got into fight with co-commuter, missed alight point Unable to board overcrowded buses/trains Medical emergency of relative/friend Waiting for friends who are late Slept late previous day Parents/room partner did not wake you up Feeling tired Feeling lazy Not motivated to go to college Trains/BusesTrains running late Cancellation due to technical faults Strike of drivers Took wrong bus/train Traffic Jam ‘Bandh’ declared by political parties Lift not working Unaware of college schedule Administrative processes Autos/Taxis unwilling to ferry to desired location Heavy rains disrupting essential services Fog blurring visibility Alarm Clock not working Electric Iron not working Water Heater not working Car/Bike broke down Petrol ran out of Car/bike No Electricity Clothes not washed & pressed Food unprepared Toiletries exhausted Felt hungry, went outside campus for food (during break) Lost Wallet/ mobile Phone Household chores Appointment delayed Extra/Co-curricular activities Late arrival of students Buying Stationary SYSTEM PEOPLE EXTERNAL MATERIAL MACHINE ENVIRONMENT Cause effect diagram: “Late arrival of Students”
- 4. Cause Solution 1. Getting up late due to: Sleeping late the previous day Parents/siblings/room-partner not waking you up Feeling tired Feeling lazy Not motivated to go to college Ensure to get up on time by following a proper schedule and going to bed early Root causes and their solutions
- 5. Cause Solution 2. Delay caused by trains/buses due to: Trains running late Cancellation of trains due to technical faults Strike of drivers Taking wrong bus/train ‘Bandh’ declared by anti-social elements Keep a buffer time of 20-25 minutes while travelling to college
- 6. Cause Solution 3. Malfunction of machines and lack of materials such as: Alarm clock, Water Heater or Electric Iron not working Car/Bike broke down Clothes not washed & pressed Toiletries exhausted Check if all the items required for the next day are in place
- 7. Cause Solution 4. Wasting time on trivialities like: Chatting with a friend who happened to meet on the way Waiting for friends who are late Going outside campus for food while hungry (during break) Getting into fight with co-commuter and missing alight point Keep a tab on the time and do not let trifles cause delay
- 8. Cause Solution 5. Clashing of lecture schedules with: Extra/Co-curricular activities Household chores Administrative processes Medical appointments for oneself or others Pre-plan the activities and attend them according to the appropriate priorities
- 9. Lessons learned by team Identification of right causes and the bottlenecks for a problem Differences between causes, effects and symptoms Visualization of relationships between causes and problems Creation of Cause-Effect diagram and when and where to use it Improved ability to relate with the cause-effect diagram through the example of “Late arrival of students” Understanding of why certain events occur and their future prediction Easier comprehension of events and thus enabling us to brainstorm and collect possible causes in groups
- 10. THANK YOU