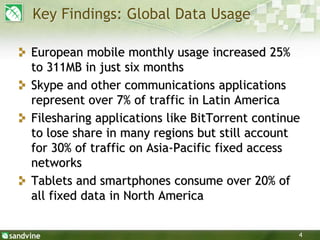
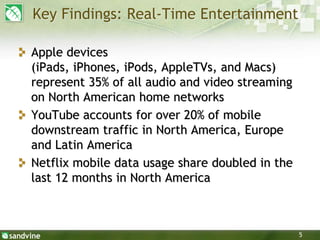
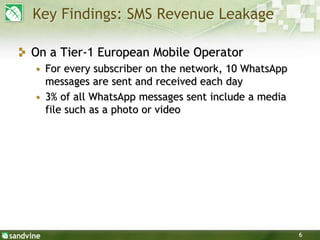
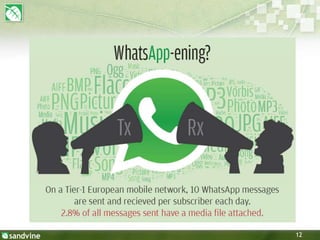
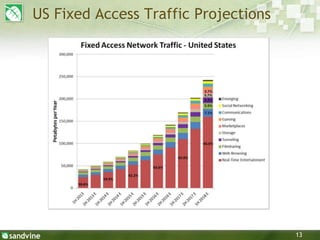
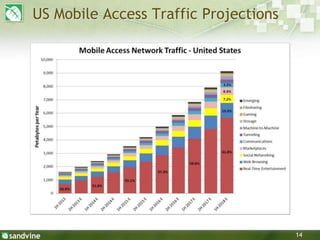
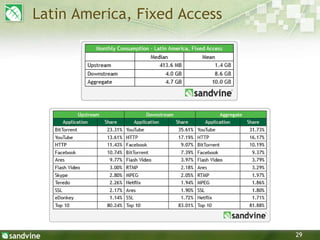
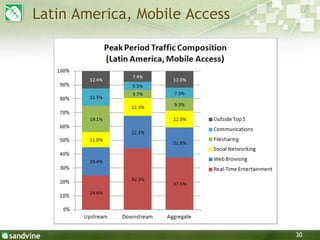
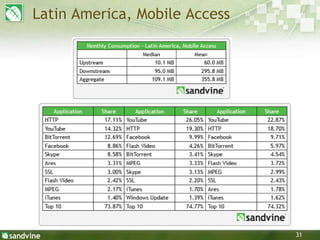
1H 2013 Global Internet
Phenomena Report
2
Global Internet Phenomena Program
An ongoing program to identify and
measure Internet trends
• Regional examination
• Global aggregation
3
Methodology
All data comes from Sandvine customers who
consent to participate in the report
A script collects high level (lowest common
denominator), subscriber anonymous data
• No service plan details (speed/quota)
• Two weeks of network usage to build average day
metrics
• Subscriber consumption based on previous
day, week, month from collection date
Data is validated, then amalgamated together
Same methodology in place since 2009
4
Key Findings: Global Data Usage
European mobile monthly usage increased 25%
to 311MB in just six months
Skype and other communications applications
represent over 7% of traffic in Latin America
Filesharing applications like BitTorrent continue
to lose share in many regions but still account
for 30% of traffic on Asia-Pacific fixed access
networks
Tablets and smartphones consume over 20% of
all fixed data in North America
5
Key Findings: Real-Time Entertainment
Apple devices
(iPads, iPhones, iPods, AppleTVs, and Macs)
represent 35% of all audio and video streaming
on North American home networks
YouTube accounts for over 20% of mobile
downstream traffic in North America, Europe
and Latin America
Netflix mobile data usage share doubled in the
last 12 months in North America
6
Key Findings: SMS Revenue Leakage
On a Tier-1 European Mobile Operator
• For every subscriber on the network, 10 WhatsApp
messages are sent and received each day
• 3% of all WhatsApp messages sent include a media
file such as a photo or video
7
8
9
10
11
Home Roaming - NA, Fixed Access
12
13
US Fixed Access Traffic Projections
14
US Mobile Access Traffic Projections
15
Regional Findings
On the following slides, relevant charts and
tables are available for:
• North America
• Latin America
• Europe
• Asia-Pacific
16
North America, Fixed Access
17
North America, Fixed Access
18
North America, Mobile Access
19
North America, Mobile Access
20
Europe, Fixed Access
21
Europe, Fixed Access
22
Europe, Mobile Access
23
Europe, Mobile Access
24
Asia-Pacific, Fixed Access
25
Asia-Pacific, Fixed Access
26
Asia-Pacific, Mobile Access
27
Asia-Pacific, Mobile Access
28
Latin America, Fixed Access
29
Latin America, Fixed Access
30
Latin America, Mobile Access
31
Latin America, Mobile Access

Sandvine 2013 global internet phenomena report

Editor's Notes

  • #8 Latin America is a region that has great variation in the types of mobile network, and because of this fact usage varies greatly from country to country. Most networks in the region are 2G/3G networks, however with therollout of LTE in some countries, mobile networks have begun to offer an experience that is equivalent and in some cases even better than that of fixed access networks in the region.For this report, we observed a mean monthly usage of 355.8 MB, a modest increase over the 344.1 MB we observed a year ago. It should be made clear however that there is wide variation in usage from country to country and network to network. For example, in one Latin America country we observed mean monthly usage on a 3G network to be 343MB, while on an LTE network in the same country it was 2.7GB. This wide disparity means that operators, particularly those in emerging markets with low fixed access penetration, should prepare themselves for drastic changes in the usage of their subscribers as subscribers are sure to take full advantage of the speed and quality of experience benefits provided by LTE.
  • #9 For full explanation of this infographic, see Page 20 of the 1H 2013 Global Internet Phenomena ReportAt Sandvine, we’ve long argued that implementing UBB would likely have minimal (if any) impact on network congestion and subscriber quality of experience (QoE) during peak, as subscribers are unlikely to stop using their favorite applications during the peak evening hours. CSPs that are actually seeking to manage network congestion need to put effective traffic management mechanisms in place in order to proactively ensure high subscriber QoE for real-time sensitive applications during peak hours.What stands out most clearly is the fact that Real-Time Entertainment’s traffic share is almost identical on both UBB and non-UBB networks, demonstrating that high bandwidth streaming audio and video traffic is of such high value to all subscribers that they are unwilling to stop or alter the way the consume it even though they have a cap placed on their monthly usage.What is also interesting is how much lower a share Filesharing traffic has on networks with UBB compared to those who do not have it. This demonstrates that subscribers may be mindfully limiting their use of Filesharing applications, which often generate traffic in both the upstream and downstream direction. Additionally, aside from being a good peer (which is likely of little importance to occasional Filesharing users), there is little direct benefit to uploading content, so that might well be the first activity that is stopped. It may even be possible that Real-Time Entertainment has a slightly higher share on networks with UBB due in part to the fact subscribers are getting more of their content via Real-Time Entertainments sources which are typically more efficient (if you consider the value proposition to be “equal entertainment for less aggregate usage”) than Filesharing, since there is relatively little upstream traffic associated with streaming.
  • #10 Interestingly, while we observed YouTube making some inroads on fixed access networks, we have begun to observe Netflix gaining more and more momentum on mobile networks. While watching a full length movie, or a 22 minute sitcom, on a 4-inch smartphone screen may not be the ideal viewing experience for everyone, for many subscribers it is becoming a viable experience. Netflix’s downstream traffic share in North America almost doubled from 2.2% to 4.0% in just 12 months time, and we believe that that this number will increase going forward and that longer form video as a whole will become more commonplace on mobile networks in North America.
  • #11 In our 1H 2012 report, we revealed that Real-Time Entertainment applications on mobile devices (smartphone and tablets) accounted for 9% of all fixed network traffic in North America and in our last report we predicted that by 2015, the phenomena will be even more profound, with mobile devices accounting for 20% of all traffic on North American fixed access networks.It turns out 2015 came a little early, and based on data collected smartphones and tablets now account for 20% of total traffic. This rapid growth is due in large part to the rapid adoption rates of larger screen devices such as tablets and the growing number of Real-Time Entertainment sources offering higher resolution video.Home Roaming is an enormous contributor to Real-Time Entertainment traffic consumption and as mentioned a cause for its growth, with over 25% of all streaming audio and video bytes being delivered to mobile devices being used in the home.
  • #12 So what single home roaming device consumes the most Real-Time Entertainment traffic at over 10%? It’s the iPad. In fact, Apple devices as a whole play a large role in the consumption of Real-Time Entertainment. If you add up all Apple manufactured devices (which includes iPads, iPhones, iPods, AppleTVs, and Mac computers), they consume over 35% of all streaming audio and video on North America fixed access networks.
  • #13 Data from Sandvine’s WhatsApp analyzer.Based on data from a tier-1 European network, approximately ten WhatsApp messages are sent and received per subscriber each day. Of these messages, 2.8% of all messages sent have a media file such as a photo or video attached.For mobile operators, this type of insight allows them to better understand the impact these messaging applications are having on their bottom line, and better craft service plans that meet the changing demands of subscribers.
  • #14 What traffic will fixed networks in the United States be carrying in the future? It’s always both fun and informative to take a look, and we’ve done so again in Figure 10. These projections have been revised using 1H2013 data and are based on a bottom-up analysis of measured household traffic profiles, observed traffic trends, and a number of informed assumptions:-Home roaming will play a prominent role in fixed access network profiles, (currently it accounts for 20% of traffic)-Legal streaming sites and services from Netflix, Amazon, HBO, and the major sporting leagues will remain active and well-stocked with compelling content-Filesharing, while slowly declining in share, is here to stay, even if only within a dedicated community and as a legal distribution mechanism for content such as software upodatesWhat emerged is a future in which: -Real-Time Entertainment applications dominate fixed access networks, accounting for two-thirds of total data usage in 2018, driven largely by ubiquitous integration between devices (e.g. smart TVs, set-tops, game consoles) and streaming services -Web Browsing will continue be the second-largest source of traffic, partly driven by the number of mobile devices at use in the home -Tunneling traffic will become a major player in the traffic mix as more critical and privacy senstive applications go online (security cameras, banking) and as subscribers seek ways to protect their identity online and access content restricted to them because of their geographic location
  • #15 What traffic will mobile networks in the United States be carrying in the future? It’s always both fun and informative to take a look, and we’ve done so again in Figure 5. These projections have been revised for this report and are based on a bottom-up analysis of measured traffic profiles, observed traffic trends, device usage characteristics, device market share, and a number of informed assumptions:-The vast majority of tablet traffic will not be carried on mobile networks-Smartphone market share will continue to grow, but feature phones will continue to make up a significant part of the North American subscriber base-Machine-to-Machine traffic will slowly, but eventually, emerge (but much slower than many are predicting)-Home roaming, the concept of subscribers voluntarily offloading mobile traffic onto Wi-Fi networks is a very real phenomenaAfter finishing all of the number-crunching, a number of interesting projections appear:-Video and audio streaming applications will account for over 60% of mobile usage by 2018-Web Browsing, including traffic generated by mobile applications will continue to make up a significant portion of the network-Social Networking will account for more traffic than we had previously predicted, thanks to adoption of tiered service plans which allow users to purchase low cost data plans that give them access to the social applicationsthey value most.