SlideShare a Scribd company logo
1 of 9
Download to read offline
Testing and evaluation of a software system to recognize                 
the behavior of the teams under counter pressing in                 
soccer using the player tracking data 
 
Introduction 
The following reports discuss the process of development of a software system which identifies                           
the counter pressing behavior of the team. The development of the system was motivated by a                               
need for more ambitious used of player movement data that is now widely available in the sport.                                 
These data have been largely used to produce distance, speed and acceleration measures (Di                           
Salvo et al., 2009; Gregson et al., 2011) as well as abstract mathematical forms that may not be                                   
understandable to coaches and players (Fonseca at al., 2013). The report describes how system                           
requirements were analyzed before the system was specified. The system structure was                       
designed before an evolutionary development approach was used to implement components,                     
testing definitions of tactical events in an exploratory and refining system requirements if                         
necessary. The system was evaluated by comparing the counter pressing events that were                         
automatically identified with those recognized by detailed human video analysis. This report                       
commences by describing the pressing in soccer before discussing the system requirements                       
and the feasibility of developing the system. The second section is the system specification                           
which provides an objective definition of counter pressing in soccer as well as identifying the                             
main inputs and outputs of the system. The third section describes the design of the system                               
and then the final section explains how the system was tested and evaluated showing the                             
evaluation results. 
 
Counter Pressing in Soccer 
Counter pressing is the strategy of winning the ball back as soon as it is lost in the opposite                                     
half. This is an effective tactic because the player who has just won the ball is vulnerable, as he                                     
may be still getting the ball under control. Also, He does not get enough time to fully scan the                                     
distribution of his teammates and opponents. It is based highly on the speed and organization                             
of the opposite team players who are looking to pressure the man with the ball. The idea is to                                     
regain possession quickly as high up the pitch as possible, thus countering the counter-attack.   
  
Technically it is described as when the player A gets the ball in his own half from the opposite                                     
team and then the opposite team tries to close in the with high intensity to stop the                                 
counter-attack. In order to pass the ball quickly in the forwarding direction, Player A then passes                               
the ball. These shot can be long-range shot or short-range shot depending upon the tactical                             
strategy of the team and organization of players 


Fig 1. Showing the counter pressing behavior of both teams. a) Ball in the left half of Team A b) Possession                                         
change happen in the half of team A. c) Team B starts pressing the player with the ball. d) showing the                                         
option to pass the ball 
 
Requirements Analysis 
Viewpoint analysis allows system requirements to be considered from multiple perspectives                     
(Finklestein and Fuks, 1989). The main viewpoints the challenge identification system were: 
 
Soccer tactics 
Coaching and feedback 
Software and hardware constraints 
Software engineering 
 
Typically, viewpoints are represented by stakeholders or viewpoint authorities which can lead to                         
conflicting requirements and the need to resolve such conflicts. This involves viewpoints being                         
structured into a hierarchy so that there is a mechanism for conflicts from lower level                             
viewpoints to be resolved by arbitration. During the current exercise, there was no specific                           
customer group and so all of the viewpoints were represented by the software developer which                             
minimised the number of conflicting requirements that were generated. The viewpoint of                       
coaching and feedback considered how the system might be used by performance analysts,                         
coaches and players to learn about challenging tactics they are implementing, how effectively                         
they defend when opponents use challenge tactics and to consider the challenge tactics of                           
future opponents.  
The requirements derived from this viewpoint included identifying players involved in counter                       
pressing events, an ability to display graphical portrayals of pressing and a means of identifying                             
video sequences of presses.   
The main software constraint was that the system had to be developed in Matlab 7.0.1 (The                               
MathWorks Inc., Natick, MA) using the standard libraries available at Cardiff Metropolitan                       
University.   
This also led to a hardware constraint which was that the system had to be implemented in the                                   
performance analysis laboratory of the university. A further software constraint was the data                         
files provided for the match used to test the system.   
The player trajectories were provided by Prozone Sports (Leeds, UK) while supplementary files                         
containing chronologically listed event and possession records were provided by the module                       
co-ordinator of the Software Engineering module.   
The match video was also provided meaning further data files could be created if necessary, but                               
it was desirable that the system could run with the data files provided. From a software                               
engineering perspective, the system needed a good response time, especially during the                       
evolutionary development process that would be adopted. If the system processed data slowly,                         
it could delay time to market as the time between successive versions being implemented and                             
tested would be longer than necessary.  
Reusability was a further requirement that came from the software engineering viewpoint.                       
Tactical analysis systems could be implemented for a variety of different tactical events. Future                           
work of this type could be much more efficient if useful system components of common benefit                               
to multiple analyses were separated from pressing specific components allowing them to be                         
used elsewhere. 
 
System Specification 
Prozone has provided X and Y coordinates of all the players for each tenth of a second. The                                   
center of the circle is taken as (0,0). The positive X goes from left to right and the positive Y                                       
goes from top to bottom. There are total 54000 rows for whole 90 minutes.  
The other file is an event file has seven columns which store a record for each instantaneous                                 
event performed during the match.  
 
The 7 column of event files are 
1. Half (1 or 2) 
2. Mins (on video) 
3. Seconds (on video) 
4. Team (1 = Hull, 2 = Cardiff) 
5. Player (1 to 26, 1 to 12 are the Hull players, 13 to 26 are the Cardiff players, 0 = N/A) 
6. Event (1 = Pass, 2 = Receive, 3 = Touch, 4 = Shot, 5 = Corner, 6 = Throw In, 0 = N/A) 
7. Outcome (1 = Retained, 2 = Lost, 0 = N/A). 
 
Another event that is used in the system is the dribble event. Though it is not included in the                                     
eventfile list, it is calculated as if a player receives the ball and then the next event for the same                                       
player is pass or shot, then we can consider that the player was dribbling the ball.  
 
The main output file has the distance for three instances : 
1. Half  
2. Team with the ball 
3. t0 = time when the player receives the ball 
4. t1 = t1 - 1 sec 
5. t2 = time when the ball is passed by the same player 
6. t3 = Pass received by the player  
7. Index of the last pass received by the player 
8. Player passing the last pass 
9. The player receiving the last pass 
10. Length of the pass 
11. Type of the pass 
 
The counter pressing is analysed over a period of time. There are 3 times involve                             
here.  
First is t1 when the possession is changed in the same half, t0 is taken to check the position 1                                       
sec before the t1, So, t0 = t1-1sec and finally, the t2 is when the dribble is ended. There is one                                         
more time t3 which is the time when the player receives the passed ball. This is time is                                   
important in the calculation of the distance of the pass. The path of the player who is pressing                                   
and the player with the ball is shown from t1 to t3. An arrow will be drawn to show the length of                                           
the pass 
 
Before going farther in the implementation stage, let us specify the conditions for                         
counter pressing events. Pressing is defined when the distance between the player                       
who is about to receive the ball and after receiving should decrease rapidly. Counter                           
pressing is when the above event happened in the same half of the team who has just                                 
now received the ball. There are 4 criteria that define the counter pressing is as                             
follows : 
 
1. The first criteria is the change of possession of the ball. The possession                         
change should happen in the same of the half the team receiving the ball 
2. The type of event is a successful pass received. 
3. The player receives the ball then should dribble to pass  
4. There should be players of an opposite team player in the range of 12.4m of                             
the player who has received the ball 
5. The distance between them should decrease to show pressing 
6. Final pass is successfully received. 


Fig 2. System inputs and outputs 
 
System design.   
 
Architectural Design 
The first file which is the “Main_file.m” is the collection of all another file. This is done so that                                     
each file can be run individually to check the functioning of each one 
1. Setting up variables: ​When the main file is executed it initialize the 4 files. The first file                                 
that is executed is an initialized file which set up the variables like the goal width, the                                 
penalty and six yards box. 


2. Setting up Pitch: ​The second one files set up the pitch length and width. This also loads                                 
the data for X, Y, and the eventfile. 


3. Analyzing Counter Pressing:​ There are X steps involves in this. The first of them is 
a. Determine possession change in same half: A for loop is run through each row of                             
eventfile. IF statement is used to check the criteria of changing the ball                         
possession. There are 4 different cases as for each half of the game and the                             
team. The additional conditions of half of the game and the coordinates of the                           
player were put to identify those changes happening in the own half of the team.                             
The player who receives the ball is P1. 
b. Determine the nearest player: ​Opposite team’s player found out in the range of                         
12.4m from P1. 12.4m is defined as the product of High speed(reference) and                         
the time for pressing. High speed is taken as 5m/s and time pressing is taken as                               
2.4sec(reference). This is done for 3-time instances and they are kept in a new                           
file to analyze as if the distance was decreasing in from t0 to t2.  
 
 
Fig 3. Image showing the pressing area and movement of the player and the ball 
 
c. Pass length: Finally the length of the pass is found out to determine the approach                             
of counter-attacking of the team.  
 
Fig 4. Possible passing of the ball 


The routine of data files controlling the software. Each file produces a file which is used by                                 
other following algorithms to find new results 


Fig 5 Hierarchy of subroutines 
 
 
Debugging 
Debugging was done by different methods. An algorithm was developed to debug                       
what's happening in the video is matching to the values. Also takes times in mins and                               
sec and tells about the team, player involved, half, type of event and the coordinates                             
of the player involved. 
Other than this, temporary variables were used and sometimes the conditional                     
statement. The output of each iteration was also checked when the result was                         
looking ambiguous.   
 
Testing and evaluation​.   
The system is tested by comparing the 2 different results obtained. The one is                           
obtained by the software analysis and the other one is obtained by the human                           
analysis. False-positive and false negative were analyzed to see the efficiency of the                         
algorithm.  
Evaluation of the system was done by watching the video and then comparing it with                             
the actual results found. There were 313 incidents where possession changes out of                         
which only 45 were those events happened in the same half of the team gaining the                               
ball. Out of these 45, there were 26 events where the final player has received the ball                                 
after completing the dribble. There were 8 events which the algorithm said it satisfies                           
the definition but in those 8 when saw it manually it was involving the goalkeeper                             
hence it is not counted as the counter pressing event.  
 
Software  Human Observations 
No   Yes  Total 
No   14  5  19 
Yes  8  18  26 
Total  22  23  45 
 
Table 1. Showing the comparison of the final 45 events which satisfy the criteria. 


Draw Pitch 
The blue dot has received the ball from the white dot team in their half. Blue dot is tracked at                                       
three given intervals. Finally, the ball is pass to the player of their team shown by the red line 
 
 
Fig 6. Pitch diagram output  
 
The software can be tailored for use with any accurately recorded player movement                         
data such as GPS data. The subroutines for determining distances between players,                       
identifying the nearest opponent, drawing the pitch and initializing event and                     
movement data structures have been isolated for use with other tactical analysis                       
systems. 
 
Finally, the software system identifies the counter pressing event effectively. There                     
are some events which are ambigous and can be debated. The human analysis helps                           
in analyzing it and bringing it to a conclusion. The using for data and software                             
algorithms helps in identifying the events hence the manager doesn't need to go                         
through the whole video to find out the pattern of playing of opposite team 
. 
 
Bibliography 
Di Salvo, V., Gregson, W., Atkinson, G., Tordoff, P. & Drust, B. (2009), Analysis of high                               
intensity activity in Premier League soccer, ​International Journal of Sports Medicine​,                     
30, 205-212. 
 
Finklestein, A. and Fuks. S. (1989), Multi-party specification, In ​Proceedings of the 5​th
                         
International Workshop on Software Specification and Design​, Pittsburgh, PA, pp.                   
185-195. 
 
Fonseca, S., Milho, J., Travassos, B., Araújo, D. and Lopes, A. (2013), Measuring                         
spatial interaction behavior in team sports using superimposed Voronoi diagrams,                   
International Journal of Performance Analysis in Sport​, 13(1), 179-189. 


More Related Content

Similar to Tactical analysis of counter pressing

Analyzing a Soccer Game with WSO2 CEP
Analyzing a Soccer Game with WSO2 CEPAnalyzing a Soccer Game with WSO2 CEP
Analyzing a Soccer Game with WSO2 CEPSrinath Perera
 
A Study on the application of Operation Research in Sports and Sports Management
A Study on the application of Operation Research in Sports and Sports ManagementA Study on the application of Operation Research in Sports and Sports Management
A Study on the application of Operation Research in Sports and Sports ManagementManoranjan Prusty
 
System development life cycle
System development life cycleSystem development life cycle
System development life cycleNigah Mathour
 
Metulini, R., Manisera, M., Zuccolotto, P. (2017), Space-Time Analysis of Mov...
Metulini, R., Manisera, M., Zuccolotto, P. (2017), Space-Time Analysis of Mov...Metulini, R., Manisera, M., Zuccolotto, P. (2017), Space-Time Analysis of Mov...
Metulini, R., Manisera, M., Zuccolotto, P. (2017), Space-Time Analysis of Mov...University of Salerno
 
Final report robert burgers
Final report robert burgersFinal report robert burgers
Final report robert burgersRobert Burgers
 
HW/SW Partitioning Approach on Reconfigurable Multimedia System on Chip
HW/SW Partitioning Approach on Reconfigurable Multimedia System on ChipHW/SW Partitioning Approach on Reconfigurable Multimedia System on Chip
HW/SW Partitioning Approach on Reconfigurable Multimedia System on ChipCSCJournals
 
Deep learning in sport video analysis: a review
Deep learning in sport video analysis: a reviewDeep learning in sport video analysis: a review
Deep learning in sport video analysis: a reviewTELKOMNIKA JOURNAL
 
Frans Lefeber - Sport, Technology and Mobile media - 2009
Frans Lefeber - Sport, Technology and Mobile media - 2009Frans Lefeber - Sport, Technology and Mobile media - 2009
Frans Lefeber - Sport, Technology and Mobile media - 2009ACTIVE institute
 
Project ppt.pptx
Project ppt.pptxProject ppt.pptx
Project ppt.pptxSnehaDR2
 
Predicting Football Match Results with Data Mining Techniques
Predicting Football Match Results with Data Mining TechniquesPredicting Football Match Results with Data Mining Techniques
Predicting Football Match Results with Data Mining TechniquesIJCSIS Research Publications
 
Stadium Queue Simulation
Stadium Queue SimulationStadium Queue Simulation
Stadium Queue SimulationAditya Singh
 
Conversion of Gait data into OpenSim
Conversion of Gait data into OpenSim Conversion of Gait data into OpenSim
Conversion of Gait data into OpenSim IRJET Journal
 
Automatic Report Generation of a Football Match
Automatic Report Generation of a Football MatchAutomatic Report Generation of a Football Match
Automatic Report Generation of a Football MatchIRJET Journal
 

Similar to Tactical analysis of counter pressing (20)

Analyzing a Soccer Game with WSO2 CEP
Analyzing a Soccer Game with WSO2 CEPAnalyzing a Soccer Game with WSO2 CEP
Analyzing a Soccer Game with WSO2 CEP
 
A Study on the application of Operation Research in Sports and Sports Management
A Study on the application of Operation Research in Sports and Sports ManagementA Study on the application of Operation Research in Sports and Sports Management
A Study on the application of Operation Research in Sports and Sports Management
 
System development life cycle
System development life cycleSystem development life cycle
System development life cycle
 
Metulini, R., Manisera, M., Zuccolotto, P. (2017), Space-Time Analysis of Mov...
Metulini, R., Manisera, M., Zuccolotto, P. (2017), Space-Time Analysis of Mov...Metulini, R., Manisera, M., Zuccolotto, P. (2017), Space-Time Analysis of Mov...
Metulini, R., Manisera, M., Zuccolotto, P. (2017), Space-Time Analysis of Mov...
 
Final report robert burgers
Final report robert burgersFinal report robert burgers
Final report robert burgers
 
HW/SW Partitioning Approach on Reconfigurable Multimedia System on Chip
HW/SW Partitioning Approach on Reconfigurable Multimedia System on ChipHW/SW Partitioning Approach on Reconfigurable Multimedia System on Chip
HW/SW Partitioning Approach on Reconfigurable Multimedia System on Chip
 
RESEARCH PAPER
RESEARCH PAPERRESEARCH PAPER
RESEARCH PAPER
 
Deep learning in sport video analysis: a review
Deep learning in sport video analysis: a reviewDeep learning in sport video analysis: a review
Deep learning in sport video analysis: a review
 
I2 madankarky1 jharibabu
I2 madankarky1 jharibabuI2 madankarky1 jharibabu
I2 madankarky1 jharibabu
 
Lesson how to create sad
Lesson how to create sadLesson how to create sad
Lesson how to create sad
 
Metulini280818 iasi
Metulini280818 iasiMetulini280818 iasi
Metulini280818 iasi
 
Frans Lefeber - Sport, Technology and Mobile media - 2009
Frans Lefeber - Sport, Technology and Mobile media - 2009Frans Lefeber - Sport, Technology and Mobile media - 2009
Frans Lefeber - Sport, Technology and Mobile media - 2009
 
Project ppt.pptx
Project ppt.pptxProject ppt.pptx
Project ppt.pptx
 
Predicting Football Match Results with Data Mining Techniques
Predicting Football Match Results with Data Mining TechniquesPredicting Football Match Results with Data Mining Techniques
Predicting Football Match Results with Data Mining Techniques
 
Sdlc
SdlcSdlc
Sdlc
 
Feasibility study
Feasibility studyFeasibility study
Feasibility study
 
Stadium Queue Simulation
Stadium Queue SimulationStadium Queue Simulation
Stadium Queue Simulation
 
Cricket 2
Cricket 2Cricket 2
Cricket 2
 
Conversion of Gait data into OpenSim
Conversion of Gait data into OpenSim Conversion of Gait data into OpenSim
Conversion of Gait data into OpenSim
 
Automatic Report Generation of a Football Match
Automatic Report Generation of a Football MatchAutomatic Report Generation of a Football Match
Automatic Report Generation of a Football Match
 

Recently uploaded

Schema on read is obsolete. Welcome metaprogramming..pdf
Schema on read is obsolete. Welcome metaprogramming..pdfSchema on read is obsolete. Welcome metaprogramming..pdf
Schema on read is obsolete. Welcome metaprogramming..pdfLars Albertsson
 
代办国外大学文凭《原版美国UCLA文凭证书》加州大学洛杉矶分校毕业证制作成绩单修改
代办国外大学文凭《原版美国UCLA文凭证书》加州大学洛杉矶分校毕业证制作成绩单修改代办国外大学文凭《原版美国UCLA文凭证书》加州大学洛杉矶分校毕业证制作成绩单修改
代办国外大学文凭《原版美国UCLA文凭证书》加州大学洛杉矶分校毕业证制作成绩单修改atducpo
 
VIP High Profile Call Girls Amravati Aarushi 8250192130 Independent Escort Se...
VIP High Profile Call Girls Amravati Aarushi 8250192130 Independent Escort Se...VIP High Profile Call Girls Amravati Aarushi 8250192130 Independent Escort Se...
VIP High Profile Call Girls Amravati Aarushi 8250192130 Independent Escort Se...Suhani Kapoor
 
Customer Service Analytics - Make Sense of All Your Data.pptx
Customer Service Analytics - Make Sense of All Your Data.pptxCustomer Service Analytics - Make Sense of All Your Data.pptx
Customer Service Analytics - Make Sense of All Your Data.pptxEmmanuel Dauda
 
RadioAdProWritingCinderellabyButleri.pdf
RadioAdProWritingCinderellabyButleri.pdfRadioAdProWritingCinderellabyButleri.pdf
RadioAdProWritingCinderellabyButleri.pdfgstagge
 
9711147426✨Call In girls Gurgaon Sector 31. SCO 25 escort service
9711147426✨Call In girls Gurgaon Sector 31. SCO 25 escort service9711147426✨Call In girls Gurgaon Sector 31. SCO 25 escort service
9711147426✨Call In girls Gurgaon Sector 31. SCO 25 escort servicejennyeacort
 
PKS-TGC-1084-630 - Stage 1 Proposal.pptx
PKS-TGC-1084-630 - Stage 1 Proposal.pptxPKS-TGC-1084-630 - Stage 1 Proposal.pptx
PKS-TGC-1084-630 - Stage 1 Proposal.pptxPramod Kumar Srivastava
 
How we prevented account sharing with MFA
How we prevented account sharing with MFAHow we prevented account sharing with MFA
How we prevented account sharing with MFAAndrei Kaleshka
 
Amazon TQM (2) Amazon TQM (2)Amazon TQM (2).pptx
Amazon TQM (2) Amazon TQM (2)Amazon TQM (2).pptxAmazon TQM (2) Amazon TQM (2)Amazon TQM (2).pptx
Amazon TQM (2) Amazon TQM (2)Amazon TQM (2).pptxAbdelrhman abooda
 
{Pooja: 9892124323 } Call Girl in Mumbai | Jas Kaur Rate 4500 Free Hotel Del...
{Pooja:  9892124323 } Call Girl in Mumbai | Jas Kaur Rate 4500 Free Hotel Del...{Pooja:  9892124323 } Call Girl in Mumbai | Jas Kaur Rate 4500 Free Hotel Del...
{Pooja: 9892124323 } Call Girl in Mumbai | Jas Kaur Rate 4500 Free Hotel Del...Pooja Nehwal
 
VIP Call Girls Service Miyapur Hyderabad Call +91-8250192130
VIP Call Girls Service Miyapur Hyderabad Call +91-8250192130VIP Call Girls Service Miyapur Hyderabad Call +91-8250192130
VIP Call Girls Service Miyapur Hyderabad Call +91-8250192130Suhani Kapoor
 
20240419 - Measurecamp Amsterdam - SAM.pdf
20240419 - Measurecamp Amsterdam - SAM.pdf20240419 - Measurecamp Amsterdam - SAM.pdf
20240419 - Measurecamp Amsterdam - SAM.pdfHuman37
 
Call Us ➥97111√47426🤳Call Girls in Aerocity (Delhi NCR)
Call Us ➥97111√47426🤳Call Girls in Aerocity (Delhi NCR)Call Us ➥97111√47426🤳Call Girls in Aerocity (Delhi NCR)
Call Us ➥97111√47426🤳Call Girls in Aerocity (Delhi NCR)jennyeacort
 
GA4 Without Cookies [Measure Camp AMS]
GA4 Without Cookies [Measure Camp AMS]GA4 Without Cookies [Measure Camp AMS]
GA4 Without Cookies [Measure Camp AMS]📊 Markus Baersch
 
Beautiful Sapna Vip Call Girls Hauz Khas 9711199012 Call /Whatsapps
Beautiful Sapna Vip  Call Girls Hauz Khas 9711199012 Call /WhatsappsBeautiful Sapna Vip  Call Girls Hauz Khas 9711199012 Call /Whatsapps
Beautiful Sapna Vip Call Girls Hauz Khas 9711199012 Call /Whatsappssapnasaifi408
 
Saket, (-DELHI )+91-9654467111-(=)CHEAP Call Girls in Escorts Service Saket C...
Saket, (-DELHI )+91-9654467111-(=)CHEAP Call Girls in Escorts Service Saket C...Saket, (-DELHI )+91-9654467111-(=)CHEAP Call Girls in Escorts Service Saket C...
Saket, (-DELHI )+91-9654467111-(=)CHEAP Call Girls in Escorts Service Saket C...Sapana Sha
 
Dubai Call Girls Wifey O52&786472 Call Girls Dubai
Dubai Call Girls Wifey O52&786472 Call Girls DubaiDubai Call Girls Wifey O52&786472 Call Girls Dubai
Dubai Call Girls Wifey O52&786472 Call Girls Dubaihf8803863
 

Recently uploaded (20)

Schema on read is obsolete. Welcome metaprogramming..pdf
Schema on read is obsolete. Welcome metaprogramming..pdfSchema on read is obsolete. Welcome metaprogramming..pdf
Schema on read is obsolete. Welcome metaprogramming..pdf
 
Deep Generative Learning for All - The Gen AI Hype (Spring 2024)
Deep Generative Learning for All - The Gen AI Hype (Spring 2024)Deep Generative Learning for All - The Gen AI Hype (Spring 2024)
Deep Generative Learning for All - The Gen AI Hype (Spring 2024)
 
代办国外大学文凭《原版美国UCLA文凭证书》加州大学洛杉矶分校毕业证制作成绩单修改
代办国外大学文凭《原版美国UCLA文凭证书》加州大学洛杉矶分校毕业证制作成绩单修改代办国外大学文凭《原版美国UCLA文凭证书》加州大学洛杉矶分校毕业证制作成绩单修改
代办国外大学文凭《原版美国UCLA文凭证书》加州大学洛杉矶分校毕业证制作成绩单修改
 
VIP High Profile Call Girls Amravati Aarushi 8250192130 Independent Escort Se...
VIP High Profile Call Girls Amravati Aarushi 8250192130 Independent Escort Se...VIP High Profile Call Girls Amravati Aarushi 8250192130 Independent Escort Se...
VIP High Profile Call Girls Amravati Aarushi 8250192130 Independent Escort Se...
 
Customer Service Analytics - Make Sense of All Your Data.pptx
Customer Service Analytics - Make Sense of All Your Data.pptxCustomer Service Analytics - Make Sense of All Your Data.pptx
Customer Service Analytics - Make Sense of All Your Data.pptx
 
RadioAdProWritingCinderellabyButleri.pdf
RadioAdProWritingCinderellabyButleri.pdfRadioAdProWritingCinderellabyButleri.pdf
RadioAdProWritingCinderellabyButleri.pdf
 
9711147426✨Call In girls Gurgaon Sector 31. SCO 25 escort service
9711147426✨Call In girls Gurgaon Sector 31. SCO 25 escort service9711147426✨Call In girls Gurgaon Sector 31. SCO 25 escort service
9711147426✨Call In girls Gurgaon Sector 31. SCO 25 escort service
 
PKS-TGC-1084-630 - Stage 1 Proposal.pptx
PKS-TGC-1084-630 - Stage 1 Proposal.pptxPKS-TGC-1084-630 - Stage 1 Proposal.pptx
PKS-TGC-1084-630 - Stage 1 Proposal.pptx
 
How we prevented account sharing with MFA
How we prevented account sharing with MFAHow we prevented account sharing with MFA
How we prevented account sharing with MFA
 
Amazon TQM (2) Amazon TQM (2)Amazon TQM (2).pptx
Amazon TQM (2) Amazon TQM (2)Amazon TQM (2).pptxAmazon TQM (2) Amazon TQM (2)Amazon TQM (2).pptx
Amazon TQM (2) Amazon TQM (2)Amazon TQM (2).pptx
 
{Pooja: 9892124323 } Call Girl in Mumbai | Jas Kaur Rate 4500 Free Hotel Del...
{Pooja:  9892124323 } Call Girl in Mumbai | Jas Kaur Rate 4500 Free Hotel Del...{Pooja:  9892124323 } Call Girl in Mumbai | Jas Kaur Rate 4500 Free Hotel Del...
{Pooja: 9892124323 } Call Girl in Mumbai | Jas Kaur Rate 4500 Free Hotel Del...
 
꧁❤ Aerocity Call Girls Service Aerocity Delhi ❤꧂ 9999965857 ☎️ Hard And Sexy ...
꧁❤ Aerocity Call Girls Service Aerocity Delhi ❤꧂ 9999965857 ☎️ Hard And Sexy ...꧁❤ Aerocity Call Girls Service Aerocity Delhi ❤꧂ 9999965857 ☎️ Hard And Sexy ...
꧁❤ Aerocity Call Girls Service Aerocity Delhi ❤꧂ 9999965857 ☎️ Hard And Sexy ...
 
VIP Call Girls Service Miyapur Hyderabad Call +91-8250192130
VIP Call Girls Service Miyapur Hyderabad Call +91-8250192130VIP Call Girls Service Miyapur Hyderabad Call +91-8250192130
VIP Call Girls Service Miyapur Hyderabad Call +91-8250192130
 
Decoding Loan Approval: Predictive Modeling in Action
Decoding Loan Approval: Predictive Modeling in ActionDecoding Loan Approval: Predictive Modeling in Action
Decoding Loan Approval: Predictive Modeling in Action
 
20240419 - Measurecamp Amsterdam - SAM.pdf
20240419 - Measurecamp Amsterdam - SAM.pdf20240419 - Measurecamp Amsterdam - SAM.pdf
20240419 - Measurecamp Amsterdam - SAM.pdf
 
Call Us ➥97111√47426🤳Call Girls in Aerocity (Delhi NCR)
Call Us ➥97111√47426🤳Call Girls in Aerocity (Delhi NCR)Call Us ➥97111√47426🤳Call Girls in Aerocity (Delhi NCR)
Call Us ➥97111√47426🤳Call Girls in Aerocity (Delhi NCR)
 
GA4 Without Cookies [Measure Camp AMS]
GA4 Without Cookies [Measure Camp AMS]GA4 Without Cookies [Measure Camp AMS]
GA4 Without Cookies [Measure Camp AMS]
 
Beautiful Sapna Vip Call Girls Hauz Khas 9711199012 Call /Whatsapps
Beautiful Sapna Vip  Call Girls Hauz Khas 9711199012 Call /WhatsappsBeautiful Sapna Vip  Call Girls Hauz Khas 9711199012 Call /Whatsapps
Beautiful Sapna Vip Call Girls Hauz Khas 9711199012 Call /Whatsapps
 
Saket, (-DELHI )+91-9654467111-(=)CHEAP Call Girls in Escorts Service Saket C...
Saket, (-DELHI )+91-9654467111-(=)CHEAP Call Girls in Escorts Service Saket C...Saket, (-DELHI )+91-9654467111-(=)CHEAP Call Girls in Escorts Service Saket C...
Saket, (-DELHI )+91-9654467111-(=)CHEAP Call Girls in Escorts Service Saket C...
 
Dubai Call Girls Wifey O52&786472 Call Girls Dubai
Dubai Call Girls Wifey O52&786472 Call Girls DubaiDubai Call Girls Wifey O52&786472 Call Girls Dubai
Dubai Call Girls Wifey O52&786472 Call Girls Dubai
 

Tactical analysis of counter pressing

  • 1. Testing and evaluation of a software system to recognize                  the behavior of the teams under counter pressing in                  soccer using the player tracking data    Introduction  The following reports discuss the process of development of a software system which identifies                            the counter pressing behavior of the team. The development of the system was motivated by a                                need for more ambitious used of player movement data that is now widely available in the sport.                                  These data have been largely used to produce distance, speed and acceleration measures (Di                            Salvo et al., 2009; Gregson et al., 2011) as well as abstract mathematical forms that may not be                                    understandable to coaches and players (Fonseca at al., 2013). The report describes how system                            requirements were analyzed before the system was specified. The system structure was                        designed before an evolutionary development approach was used to implement components,                      testing definitions of tactical events in an exploratory and refining system requirements if                          necessary. The system was evaluated by comparing the counter pressing events that were                          automatically identified with those recognized by detailed human video analysis. This report                        commences by describing the pressing in soccer before discussing the system requirements                        and the feasibility of developing the system. The second section is the system specification                            which provides an objective definition of counter pressing in soccer as well as identifying the                              main inputs and outputs of the system. The third section describes the design of the system                                and then the final section explains how the system was tested and evaluated showing the                              evaluation results.    Counter Pressing in Soccer  Counter pressing is the strategy of winning the ball back as soon as it is lost in the opposite                                      half. This is an effective tactic because the player who has just won the ball is vulnerable, as he                                      may be still getting the ball under control. Also, He does not get enough time to fully scan the                                      distribution of his teammates and opponents. It is based highly on the speed and organization                              of the opposite team players who are looking to pressure the man with the ball. The idea is to                                      regain possession quickly as high up the pitch as possible, thus countering the counter-attack.       Technically it is described as when the player A gets the ball in his own half from the opposite                                      team and then the opposite team tries to close in the with high intensity to stop the                                  counter-attack. In order to pass the ball quickly in the forwarding direction, Player A then passes                                the ball. These shot can be long-range shot or short-range shot depending upon the tactical                              strategy of the team and organization of players           
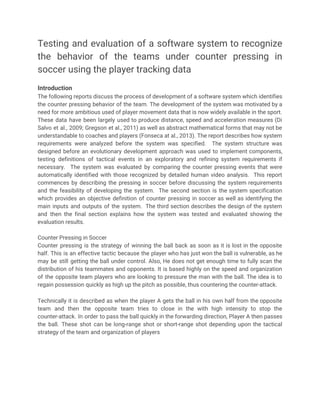
  • 2.   Fig 1. Showing the counter pressing behavior of both teams. a) Ball in the left half of Team A b) Possession                                          change happen in the half of team A. c) Team B starts pressing the player with the ball. d) showing the                                          option to pass the ball    Requirements Analysis  Viewpoint analysis allows system requirements to be considered from multiple perspectives                      (Finklestein and Fuks, 1989). The main viewpoints the challenge identification system were:    Soccer tactics  Coaching and feedback  Software and hardware constraints  Software engineering    Typically, viewpoints are represented by stakeholders or viewpoint authorities which can lead to                          conflicting requirements and the need to resolve such conflicts. This involves viewpoints being                          structured into a hierarchy so that there is a mechanism for conflicts from lower level                              viewpoints to be resolved by arbitration. During the current exercise, there was no specific                            customer group and so all of the viewpoints were represented by the software developer which                              minimised the number of conflicting requirements that were generated. The viewpoint of                        coaching and feedback considered how the system might be used by performance analysts,                         
  • 3. coaches and players to learn about challenging tactics they are implementing, how effectively                          they defend when opponents use challenge tactics and to consider the challenge tactics of                            future opponents.   The requirements derived from this viewpoint included identifying players involved in counter                        pressing events, an ability to display graphical portrayals of pressing and a means of identifying                              video sequences of presses.    The main software constraint was that the system had to be developed in Matlab 7.0.1 (The                                MathWorks Inc., Natick, MA) using the standard libraries available at Cardiff Metropolitan                        University.    This also led to a hardware constraint which was that the system had to be implemented in the                                    performance analysis laboratory of the university. A further software constraint was the data                          files provided for the match used to test the system.    The player trajectories were provided by Prozone Sports (Leeds, UK) while supplementary files                          containing chronologically listed event and possession records were provided by the module                        co-ordinator of the Software Engineering module.    The match video was also provided meaning further data files could be created if necessary, but                                it was desirable that the system could run with the data files provided. From a software                                engineering perspective, the system needed a good response time, especially during the                        evolutionary development process that would be adopted. If the system processed data slowly,                          it could delay time to market as the time between successive versions being implemented and                              tested would be longer than necessary.   Reusability was a further requirement that came from the software engineering viewpoint.                        Tactical analysis systems could be implemented for a variety of different tactical events. Future                            work of this type could be much more efficient if useful system components of common benefit                                to multiple analyses were separated from pressing specific components allowing them to be                          used elsewhere.    System Specification  Prozone has provided X and Y coordinates of all the players for each tenth of a second. The                                    center of the circle is taken as (0,0). The positive X goes from left to right and the positive Y                                        goes from top to bottom. There are total 54000 rows for whole 90 minutes.   The other file is an event file has seven columns which store a record for each instantaneous                                  event performed during the match.     The 7 column of event files are  1. Half (1 or 2)  2. Mins (on video)  3. Seconds (on video)  4. Team (1 = Hull, 2 = Cardiff)  5. Player (1 to 26, 1 to 12 are the Hull players, 13 to 26 are the Cardiff players, 0 = N/A)  6. Event (1 = Pass, 2 = Receive, 3 = Touch, 4 = Shot, 5 = Corner, 6 = Throw In, 0 = N/A)  7. Outcome (1 = Retained, 2 = Lost, 0 = N/A).   
  • 4. Another event that is used in the system is the dribble event. Though it is not included in the                                      eventfile list, it is calculated as if a player receives the ball and then the next event for the same                                        player is pass or shot, then we can consider that the player was dribbling the ball.     The main output file has the distance for three instances :  1. Half   2. Team with the ball  3. t0 = time when the player receives the ball  4. t1 = t1 - 1 sec  5. t2 = time when the ball is passed by the same player  6. t3 = Pass received by the player   7. Index of the last pass received by the player  8. Player passing the last pass  9. The player receiving the last pass  10. Length of the pass  11. Type of the pass    The counter pressing is analysed over a period of time. There are 3 times involve                              here.   First is t1 when the possession is changed in the same half, t0 is taken to check the position 1                                        sec before the t1, So, t0 = t1-1sec and finally, the t2 is when the dribble is ended. There is one                                          more time t3 which is the time when the player receives the passed ball. This is time is                                    important in the calculation of the distance of the pass. The path of the player who is pressing                                    and the player with the ball is shown from t1 to t3. An arrow will be drawn to show the length of                                            the pass    Before going farther in the implementation stage, let us specify the conditions for                          counter pressing events. Pressing is defined when the distance between the player                        who is about to receive the ball and after receiving should decrease rapidly. Counter                            pressing is when the above event happened in the same half of the team who has just                                  now received the ball. There are 4 criteria that define the counter pressing is as                              follows :    1. The first criteria is the change of possession of the ball. The possession                          change should happen in the same of the half the team receiving the ball  2. The type of event is a successful pass received.  3. The player receives the ball then should dribble to pass   4. There should be players of an opposite team player in the range of 12.4m of                              the player who has received the ball  5. The distance between them should decrease to show pressing  6. Final pass is successfully received.      
  • 5.     Fig 2. System inputs and outputs    System design.      Architectural Design  The first file which is the “Main_file.m” is the collection of all another file. This is done so that                                      each file can be run individually to check the functioning of each one  1. Setting up variables: ​When the main file is executed it initialize the 4 files. The first file                                  that is executed is an initialized file which set up the variables like the goal width, the                                  penalty and six yards box.          2. Setting up Pitch: ​The second one files set up the pitch length and width. This also loads                                  the data for X, Y, and the eventfile.        3. Analyzing Counter Pressing:​ There are X steps involves in this. The first of them is  a. Determine possession change in same half: A for loop is run through each row of                              eventfile. IF statement is used to check the criteria of changing the ball                          possession. There are 4 different cases as for each half of the game and the                              team. The additional conditions of half of the game and the coordinates of the                            player were put to identify those changes happening in the own half of the team.                              The player who receives the ball is P1. 
  • 6. b. Determine the nearest player: ​Opposite team’s player found out in the range of                          12.4m from P1. 12.4m is defined as the product of High speed(reference) and                          the time for pressing. High speed is taken as 5m/s and time pressing is taken as                                2.4sec(reference). This is done for 3-time instances and they are kept in a new                            file to analyze as if the distance was decreasing in from t0 to t2.       Fig 3. Image showing the pressing area and movement of the player and the ball    c. Pass length: Finally the length of the pass is found out to determine the approach                              of counter-attacking of the team.     Fig 4. Possible passing of the ball        The routine of data files controlling the software. Each file produces a file which is used by                                  other following algorithms to find new results     
  • 7.   Fig 5 Hierarchy of subroutines      Debugging  Debugging was done by different methods. An algorithm was developed to debug                        what's happening in the video is matching to the values. Also takes times in mins and                                sec and tells about the team, player involved, half, type of event and the coordinates                              of the player involved.  Other than this, temporary variables were used and sometimes the conditional                      statement. The output of each iteration was also checked when the result was                          looking ambiguous.      Testing and evaluation​.    The system is tested by comparing the 2 different results obtained. The one is                            obtained by the software analysis and the other one is obtained by the human                            analysis. False-positive and false negative were analyzed to see the efficiency of the                          algorithm.   Evaluation of the system was done by watching the video and then comparing it with                              the actual results found. There were 313 incidents where possession changes out of                          which only 45 were those events happened in the same half of the team gaining the                                ball. Out of these 45, there were 26 events where the final player has received the ball                                  after completing the dribble. There were 8 events which the algorithm said it satisfies                           
  • 8. the definition but in those 8 when saw it manually it was involving the goalkeeper                              hence it is not counted as the counter pressing event.     Software  Human Observations  No   Yes  Total  No   14  5  19  Yes  8  18  26  Total  22  23  45    Table 1. Showing the comparison of the final 45 events which satisfy the criteria.        Draw Pitch  The blue dot has received the ball from the white dot team in their half. Blue dot is tracked at                                        three given intervals. Finally, the ball is pass to the player of their team shown by the red line      Fig 6. Pitch diagram output     The software can be tailored for use with any accurately recorded player movement                          data such as GPS data. The subroutines for determining distances between players,                        identifying the nearest opponent, drawing the pitch and initializing event and                      movement data structures have been isolated for use with other tactical analysis                        systems.   
  • 9. Finally, the software system identifies the counter pressing event effectively. There                      are some events which are ambigous and can be debated. The human analysis helps                            in analyzing it and bringing it to a conclusion. The using for data and software                              algorithms helps in identifying the events hence the manager doesn't need to go                          through the whole video to find out the pattern of playing of opposite team  .    Bibliography  Di Salvo, V., Gregson, W., Atkinson, G., Tordoff, P. & Drust, B. (2009), Analysis of high                                intensity activity in Premier League soccer, ​International Journal of Sports Medicine​,                      30, 205-212.    Finklestein, A. and Fuks. S. (1989), Multi-party specification, In ​Proceedings of the 5​th                           International Workshop on Software Specification and Design​, Pittsburgh, PA, pp.                    185-195.    Fonseca, S., Milho, J., Travassos, B., Araújo, D. and Lopes, A. (2013), Measuring                          spatial interaction behavior in team sports using superimposed Voronoi diagrams,                    International Journal of Performance Analysis in Sport​, 13(1), 179-189.