VIP Independent Call Girls in Andheri 🌹 9920725232 ( Call Me ) Mumbai Escorts...
Commodity insight report zinc & rm seed 23.06.16
1. News and Developments
Zinc, continues to be the best performer in the current year, however prices plunged the most last week after the LME
data released showed a surge of 19,750 tonnes at LME warehouses in New Orleans. International Lead and Zinc Study
Group (ILZSG) estimated that total zinc inventory, including exchange-registered tonnage, metal held by China's State
Reserves Bureau (SRB) and "commercial stocks" held by producers, consumers and merchants, declined from a peak of
2.2 million tonnes in January 2013 to 1.5 million tonnes at the end of March 2016. Zinc is likely to continue with its
positive trajectory in the coming months as more supply cuts are expected to take place in future.
The warehouse stock in the LME Zinc has come down 23 per cent,
from 0.504 million tonnes in February, to 0.387 million tonnes.
Surging supply and sluggish demand were the major causes for
zinc prices to slump by 26 percent last year. Additionally, signs of a
pick-up in Chinese demand supported the price of the commodity,
as evident from the fall in China’s stock levels. The inventory in
Shanghai Futures Exchange came down by 8 percent to 0.252
million tonnes as of May from 0.274 million tonnes in March.
ILZSG revised up its deficit forecast for 2016 from its previous
prediction in October last year. It expects demand for refined zinc
in 2016 will increase to 3.5 per cent to 14.33 million tonnes as
compared to earlier year. A surge in demand from China’s
infrastructure sector is expected to increase demand for zinc by
4.5 percent this year. China is the world’s largest consumer of zinc.
Technical Outlook
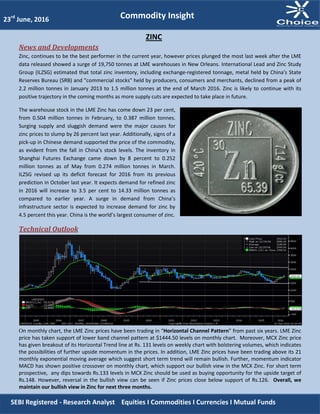
On monthly chart, the LME Zinc prices have been trading in “Horizontal Channel Pattern” from past six years. LME Zinc
price has taken support of lower band channel pattern at $1444.50 levels on monthly chart. Moreover, MCX Zinc price
has given breakout of its Horizontal Trend line at Rs. 131 levels on weekly chart with bolstering volumes, which indicates
the possibilities of further upside momentum in the prices. In addition, LME Zinc prices have been trading above its 21
monthly exponential moving average which suggest short term trend will remain bullish. Further, momentum indicator
MACD has shown positive crossover on monthly chart, which support our bullish view in the MCX Zinc. For short term
prospective, any dips towards Rs.133 levels in MCX Zinc should be used as buying opportunity for the upside target of
Rs.148. However, reversal in the bullish view can be seen if Zinc prices close below support of Rs.126. Overall, we
maintain our bullish view in Zinc for next three months.
23rd
June, 2016
ZINC
Commodity Insight
SEBI Registered - Research Analyst Equities I Commodities I Currencies I Mutual Funds
2. News and Developments
According to Jun’16 latest USDA report, global rapeseed
production is anticipated to decline in 2016/17 to 66.15 mt
compared to that of last year. Lower sown area is reported in
Canada, Ukraine, the EU, and China. Crop declines for major
exporting countries may limit rapeseed imports, particularly for
China and the EU. In Canada and EU the rapeseed production
might drop due lower acreage and expectation of insect
damage. Prices of cooking oils produced in India such as
mustard oil, groundnut oil and cottonseed oil, increased by 5-
6% in last fortnight on account of supply constraints.
Consumers can heave a sigh of relief, as palm oil has become
7.5% cheaper during this period due to increase in production
in Malaysia and Indonesia.
Production of mustard, groundnut and cottonseed suffered in both kharif and rabi seasons is due to erratic weather
conditions. The arrival of the south-west monsoon has kick started seasonal farming activity, with farmers taking up
sowing of key kharif crops such as rice, pulses, oilseeds and cotton in several states. According to the preliminary data
put out by the agriculture ministry, sowing of kharif crops was complete on about 71.24 lakh hectares as on 10th June
2016, about 7% lower than last year's acreage of 76.65 lakh hectares.
Technical Outlook
On daily chart, the NCDEX RM Seed price has given breakout of its “Inverted Head and Shoulder” neck line at Rs. 4580
levels. In long term prospective, NCDEX RM Seed price has shown breakout of its consolidation range of Rs. 4247 to Rs.
4570 levels on daily chart. Moreover, NCDEX RM Seed prices are trading above its 100 Daily exponential moving average
in the above chart, which indicates medium term trend remains up. The Momentum indicator RSI has remained above
60 levels on daily chart, which indicates bullishness in the prices. NCDEX RM Seed prices looks positive, so buy on dips
around Rs.4630 levels with a stop loss to be kept at Rs.4480 for the upside target of Rs.4950. Overall, we hold our
Bullish view in RM Seed for next three months.
RM SEED
23rd
June, 2016
SEBI Registered - Research Analyst Equities I Commodities I Currencies I Mutual Funds
Commodity Insight
3. LME Zinc Inventories
Crop Calendar
Commodity Country January February March April May June July August September October November December
India
EU-27
Canada
China
Sowing
Growth
Harvesting/Arrivals
RM Seed
Commodity LTP WoW (%) MoM (%) Open Interest
(Weekly)
LME Zinc ($/tonne) 2010 -5.10 -0.77 -1971
Shanghai Zinc
($/tonne)
15655 -0.25 -0.92 -0.021M
MCX Zinc (Rs./kg) 135.30 -4.87 0.27 -5333
NCDEX RM Seed
(Rs./quintal)
4767 -1.52 1.04 -14310
SEBI Registered - Research Analyst Equities I Commodities I Currencies I Mutual Funds
Commodity Insight
23rd
June, 2016
Source: Bloomberg
4. This is solely for information of clients of Choice Broking and does not construe to be an investment advice. It is also not intended as an offer or solicitation for the purchase and sale
of any financial instruments. Any action taken by you on the basis of the information contained herein is your responsibility alone and Choice Broking its subsidiaries or its employees
or associates will not be liable in any manner for the consequences of such action taken by you. We have exercised due diligence in checking the correctness and authenticity of the
information contained in this recommendation, but Choice Broking or any of its subsidiaries or associates or employees shall not be in any way responsible for any loss or damage
that may arise to any person from any inadvertent error in the information contained in this recommendation or any action taken on basis of this information. Technical analysis
studies market psychology, price patterns and volume levels. It is used to forecast future price and market movements. Technical analysis is complementary to fundamental analysis
and news sources. The recommendations issued herewith might be contrary to recommendations issued by Choice Broking in the company research undertaken as the
recommendations stated in this report is derived purely from technical analysis. Choice Broking has based this document on information obtained from sources it believes to be
reliable but which it has not independently verified; Choice Broking makes no guarantee, representation or warranty and accepts no responsibility or liability as to its accuracy or
completeness. The opinions contained within the report are based upon publicly available information at the time of publication and are subject to change without notice. The
information and any disclosures provided herein are in summary form and have been prepared for informational purposes. The recommendations and suggested price levels are
intended purely for trading purposes. The recommendations are valid for the day of the report however trading trends and volumes might vary substantially on an intraday basis and
the recommendations may be subject to change. The information and any disclosures provided herein may be considered confidential. Any use, distribution, modification, copying,
forwarding or disclosure by any person is strictly prohibited. The information and any disclosures provided herein do not constitute a solicitation or offer to purchase or sell any
security or other financial product or instrument. The current performance may be unaudited. Past performance does not guarantee future returns. There can be no assurance that
investments will achieve any targeted rates of return, and there is no guarantee against the loss of your entire investment. POTENTIAL CONFLICT OF INTEREST DISCLOSURE (as on
date of report) Disclosure of interest statement – • Analyst interest of the stock /Instrument(s): - No. • Firm interest of the stock / Instrument (s): - No.
Disclaimer
Contact Us
www.choiceindia.comcustomercare@choiceindia.com
Commodity Insight
23rd
June, 2016
SEBI Registered - Research Analyst Equities I Commodities I Currencies I Mutual Funds
Anish Vyas
Digitally signed by Anish Vyas
DN: cn=Anish Vyas, o=Choice Merchandise
Broking Pvt. Ltd, ou=Sr. Research Associate,
email=anish.vyas@choiceindia.com, c=IN
Date: 2016.06.23 15:04:07 +05'30'