Coral bleaching response guide 2016 (Western Indian Ocean)
•Download as PPTX, PDF•
1 like•634 views

Coral bleaching is expected to be severe in the Western Indian Ocean in early 2016 due to high ocean temperatures associated with a strong El Niño event and climate change. This document outlines a four-step plan for monitoring and responding to coral bleaching in the region: (A) Preparation, (B) Initial observations, (C) Monitoring bleaching and mortality levels, and (D) Communication. It provides guidance on monitoring methods at basic, intermediate and advanced levels depending on available resources and expertise. The goal is to track bleaching progression and engage stakeholders to facilitate response and reporting of impacts across the Western Indian Ocean.

Recommended
Recommended
More Related Content
Viewers also liked
Viewers also liked (9)
Similar to Coral bleaching response guide 2016 (Western Indian Ocean)
Similar to Coral bleaching response guide 2016 (Western Indian Ocean) (20)
Recently uploaded
Recently uploaded (20)
Coral bleaching response guide 2016 (Western Indian Ocean)
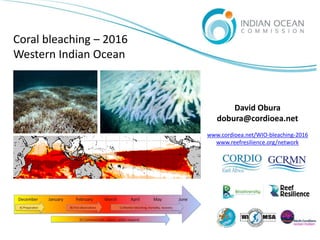
- 1. Coral bleaching – 2016 Western Indian Ocean David Obura dobura@cordioea.net www.cordioea.net/WIO-bleaching-2016 www.reefresilience.org/network
- 2. December January February March April May June A) Preparation B) First observations C) Monitor bleaching, mortality, recovery D) Communicate, report, relate respond Coral bleaching – 2016 Western Indian Ocean 2016 may be a major bleaching year in the WIO 1) 2015 has been the hottest year ever globally 2) A very strong El Niño is underway in Dec 2015 – Jan 2016, in a very similar pattern to that observed in 1997-98 3) Coral bleaching has been widespread in the Pacific and Caribbean in mid-late 2015, which suggests major bleaching likely in the Western Indian Ocean in early 2016 Adding to the ongoing effort to prepare a GCRMN report for the WIO in 2015-16, this is an effort to increase the degree of reporting of bleaching in the WIO in January – May of 2015, and for this data to be reported with the GCRMN Reef Outlook for the Western Indian Ocean, 2016 This is a very simple presentation of a basic bleaching response plan for any responders to undertake in the WIO during 2016. The basic elements of a 4- step response plan, and options for bleaching methods are presented, to suit different users’ needs, and assure consistency among data to help with regional reporting. Key references and resources are listed on the last page. Detailed explanation of the methods is available in the companion report.
- 3. December January February March April May June A) Preparation B) First observations C) Monitor bleaching, mortality, recovery D) Communicate, report, relate respond A) Preparation GUIDING QUESTIONS • Why are you monitoring bleaching? • What staff or volunteers are available to do monitoring? • Do you have any funding to support monitoring? The more complex your answers are to the above, the more detailed you are likely to be able to collect data. A) WHY? Why are you monitoring bleaching? This should guide all decisions in subsequent steps. B) FIRST OBSERVATIONS Who is on the water enough to provide reliable first observations of bleaching? Approach them to do this, and help prepare them. C) MONITORING What methods can you apply given your resources, expertise, etc? Prepare the main stakeholders/individuals who will do the monitoring. D) COMMUNICATION Who needs to know about the bleaching? • Do the responsible agencies/authorities know anything about bleaching? • Do stakeholders (e.g. fishers, tourism operators, hotels, etc.) know anything about bleaching • Does the public know anything about bleaching? • Is the media interested in/know anything about bleaching? DO THE FIRST COMMUNICATION BEFORE BLEACHING HAPPENS – PREPARE ALL STAKEHOLDERS TO HEAR MORE NEWS FROM YOU AS IT UNFOLDS. If you need advice, consult in the WIO group on the reef resilience forum
- 4. December January February March April May June A) Preparation B) First observations C) Monitor bleaching, mortality, recovery D) Communicate, report, relate respond B) First observations . . GUIDING QUESTIONS • Are you getting news/forecasts about the progression of bleaching in the WIO? • Are there people regularly on/over the reefs that can alert you to the first signs of bleaching? (e.g. dive/snorkel guides, fishermen, MPA rangers, pilots in low- flying/small planes) To catch the first signs of coral bleaching you need to have frequent visitors to some reefs that can distinguish the first signs of bleaching from other things. BE WARNED!! • http://coralreefwatch.noaa.gov/satellite/ for global and http://1.usa.gov/1IWoSCq for regional information. • Visit www.cordioea.net/bleachingalert for updated WIO alerts. • Send an email to bleaching@cordioea.net to receive email alerts every 2 weeks. HOW TO OBSERVE FIRST BLEACHING First observations of bleaching must be able to reliably distinguish bleaching from other conditions, such as dead coral skeletons, white soft corals, etc. Go to this page for images of bleached corals.
- 5. December January February March April May June A) Preparation B) First observations C) Monitor bleaching, mortality, recovery D) Communicate, report, relate respond C) Monitoring METHODS Based on your answers and capabilities, there are three basic levels at which you could collect data. These are described in detail in the accompanying GUIDE. Click on the buttons below to see further details on each: Basic – approximate estimate of proportion of colonies affected at a site, little or no taxonomic information. Medium – visual estimates of coral colonies in basic categories of normal/bleached/dead, genus level identification High – area-based censusof coral colonies in continuous categories of normal/bleached/dead, genus level identification, with or without colony size information. . . GUIDING QUESTIONS • How often are you able to visit your sites, how many sites do you have? • Are there stakeholders who can help collect data? • Do you have a system in place to manage/hold the data? • Do you have an existing monitoring programme that this builds on? To track the progression of coral bleaching you ideally need to visit a site once very 2 weeks for as long as the event lasts. If you have different people/groups with different abilities, you could plan for different levels of monitoring to make the most of all contributors. BASELINE Ideally baseline conditions should be established at monitoring sites, so as far as possible: • Pre-select your sites (moderate/good corals) • Apply a first set of measurements before bleaching, then re-start the monitoring after 1st observations of bleaching are confirmed. FREQUENCY • After the first bleaching survey, the method should be repeated every 2 weeks until mortality has ended. • As many sites as possible should be done, the more the better.
- 6. December January February March April May June A) Preparation B) First observations C) Monitor bleaching, mortality, recovery D) Communicating METHODS Based on your answers to the above, Xxx more on this to be done … using recent presentations and reef managers guide . . GUIDING QUESTIONS • How often are you able to visit your sites, how many sites do you have? • Are there stakeholders who can help collect data? • Do you have a system in place to manage/hold the data? To track the progression of coral bleaching you need to visit a site once very 2-4 weeks for as long as the event lasts. If you have different people/groups with different abilities, you could plan a coordinated response to make the most of all contributors. D) Communicate, report, relate respond
- 7. Monitoring methods The next pages give details on recommended monitoring methods at basic, intermediate and high levels of expertise/effort. The final pages show photographs of the typical appearance of bleaching, and of other features underwater that are white, but are NOT bleaching.
- 8. Component Basic Sampling location Arbitrary, use 5-6 minute time swim for standardization Spatial Broad area of reef in view, perhaps 10-50 m along Corals All hard corals, key genera noted where possible. Bleaching & mortality observations None (<1%), low (1-10%), medium (10-50%), high (50-90%), extreme (>90%) bleaching. Can also use the same levels to estimate mortality. Method – in situ Estimate overall “look” of coral community, for all corals combined, and estimate proportion in categories given above. Can do an overall count of colonies affected or not, to help estimation of %, but be aware of tendency to focus on larger colonies. Note key features, such as principal genera affected, and estimate proportion for those, if possible Method - photographic Take 2-3 general views of the reef area, plus 10 or more vertical images 1m above substrate, separated by 2 or more meters. Two methods for analysis: o proportion of corals is estimated as a % of coral community in each category in each photo, averaged across the photos. o using 5*5 grid of points (25 per frame), score number of corals in each category, add together for total, and calculate % per category. Use a 1m long PVC stick/ monopod to help with camera-benthos distance, but try and keep it out of the frame to maximize the utility of photos for other purposes. Pros Most accessible for users with low technical skills. Most rapid, can be applied over many sample sites in a short time. Cons Very open to personal bias in estimation of area affected and estimating impact. Minimum taxonomic resolution Modifications Can add detail on taxonomy (genera) and the proportion affected. Photos/video can be collected to verify estimates, or for experienced observers to assess basic bleaching levels remotely. Ideal target population People ‘on the job’ (dive-masters, snorkel guides, MPA rangers/staff doing routine patrols), volunteers with limited experience. C) Monitoring method - BASIC
- 9. Component Medium Sampling location Arbitrary Spatial Multiple areas selected by eye. Sizes of 1-2 up to 12 m2 in size have been used. Corals All coral genera, no size Bleaching & mortality observations Fixed classes, e.g. normal, pale, part-bleached (10-50%), bleached (100%), part-dead, fully dead (recent mortality only). More detailed categories have also been used: 0%, pale (any amount), <20%, 20-50%, 50-80%, 80-100% bleached, recently dead. Method – in situ Score ALL coral colonies >10 cm diameter in the sampling area, recording their genus and condition. Take care to not exclude normal colonies. If uncertain of genus ID, record (‘other’) Method - photographic Take 4-5 general views of the reef area. Take 20 or more vertical images 1m above substrate, separated by 2 or more meters – follow same guidelines as for basic method. Analysis same as in basic category, including genus identification and greater replication. Pros Relatively rapid, allows for sample selection over wide area of reef. Can be undertaken more easily while doing other work. Cons Bias due to selection of sample points Bias due to preferential recording of bleaching bleached corals over normal ones, particularly for smaller colonies Inadequate sampling of all corals - reefs can have >40 colonies/m2, so counting all colonies reliably in larger samples (e.g. 2m radius) is unreliable and unlikely to be done consistently. Fixed classes for pale, bleaching and partial mortality ignore complex interactions between classes, especially partial morality with partial bleaching. Modifications Disease and other conditions can be added. Use radial lines/quadrats to standardize sampling of unit areas. Ideal target population Management and monitoring programmes with semi-experienced staff/students/etc, but contributors are of varying experience levels C) Monitoring method - INTERMEDIATE
- 10. Component High Sampling location Arbitrary or fixed. Spatial Belt transects (e.g. 25*1 m) Due to the higher accuracy of this method, for repeated sampling it is advisable to fix a transect during the first sample(s), using nails at the beginning and intermediate points (e.g. 5 m apart) in the transect. Ideally, record 2 or more transects per site. Corals Genus, with or without size Bleaching & mortality observations Continuous scale - proportion (%) of colony pale, bleached, dead. Include disease and other conditions. Method – in situ Score ALL coral colonies >10 cm diameter whose centers are within the quadrats/belts. Record their genus and % of each condition on the coral colony. If included, record size – IUCN method uses size classes of 11-20; 21-40; 41-80; 81-160; 161-320; and > 320 cm. If uncertain of genus ID, record (‘other’) If using fixed transects, only need to record all colonies on the first sample. After that, only record those colonies that show some degree of bleaching/mortality (and disease). Method - photographic Take 4-5 general shots of the reef area, Take vertical images 1m above substrate along the full line of the transect. Make sure the images overlap enough to show the continuity of the transect. This is unlikely to record the full 1m width of the transect, but the degree of sampling should be comparable (e.g. of a 25*0.6 m belt). Analysis same as in medium category, with greater replication. If sizes are to be included, must use a length scale. This can be a right-angle at the benthic end of the 1m spacer/mono-pod. Use a 20 cm length, marked clearly at 10 and 20 cm. Pros Most unbiased method to prevent over-counting of bleached and large corals (forces counting of normal and small corals) Bleaching and mortality estimates are standardize to coral biomass (area) and density of corals on the reef. Accommodates variation in bleaching and mortality state of corals. Addresses size-dependent variation in bleaching Cons Time consuming. Sampling constrained to smaller areas of a reef due to the higher detail, so risk of bias due to spot-selection. Likely to be too detailed for most management applications, most applicable to research programmes. Modifications Multiple additions can be done –e.g. of disease, benthic cover, algae characteristics, etc. to extend the detail of C) Monitoring method - HIGH
- 11. Examples of bleaching … images
- 12. Examples of other white things on the reef – not bleaching …
- 13. References and resources … Manual Obura DO, xxxx and others?? (2016). Coral Bleaching Monitoring Guide, Western Indian Ocean – 2016. Biodiversity Project, Indian Ocean Commission, CORDIO East Africa. Xxx and others? References in the main manual Florida Reef Resilience Program (xx) Florida Reef Tract: Coral Bleaching Response Plan Marshall, P. (2003). Great Barrier Reef Coral Bleaching Response Program. Great Barrier Reef Marine Park Authority, Australia. Marshall and Schuttenberg 2006 – Reef Managers guide McClanahan TR, Ateweberhan M, Graham NAJ, Wilson SK, Ruiz Sebastián C, Guillaume MMM, Bruggemann JH (2007) Western Indian Ocean coral communities: bleaching responses and susceptibility to extinction. Mar Ecol Prog Ser 337: 1–13 Obura, D.O., and Grimsditch, G., (2009) Resilience assessment of coral reefs- Assessment protocol for coral reefs, focussing on coral bleaching and thermal stress. IUCN Working group on Climate change and coral reefs. IUCN, Gland, Switzerland, www.iucn.org/cccr/publications 70pp. Oliver, J, P. Marshall, N. Setiasih and L. Hansen, 2004. A global protocol for assessment and monitoring of coral bleaching. WorldFish Center, Penang, Malaysia and WWF Indonesia, Jakarta. 35 p. All the above references are available at www.cordioea.net/WIO- bleaching Websites Resources associated with this guide: • IOC project pages xxx • www.cordioea.net/WIO-bleaching • www.reefresilience.org xxxxx NOAA Coral Reef Watch homepage: http://coralreefwatch.noaa.gov/satellite/research /coral_bleaching_report.php Reefbase bleaching pages (not updated): xxx … etc ...
Editor's Notes
- Mainly note that the alert is available on the website and each two-week update is sent an email list. Observations start at the beginning of the bleaching season, and end in May/June depending on the severity of bleaching.
- Mainly note that the alert is available on the website and each two-week update is sent an email list. Observations start at the beginning of the bleaching season, and end in May/June depending on the severity of bleaching.
- Mainly note that the alert is available on the website and each two-week update is sent an email list. Observations start at the beginning of the bleaching season, and end in May/June depending on the severity of bleaching.
- Mainly note that the alert is available on the website and each two-week update is sent an email list. Observations start at the beginning of the bleaching season, and end in May/June depending on the severity of bleaching.
- Mainly note that the alert is available on the website and each two-week update is sent an email list. Observations start at the beginning of the bleaching season, and end in May/June depending on the severity of bleaching.