Download as PDF, PPTX


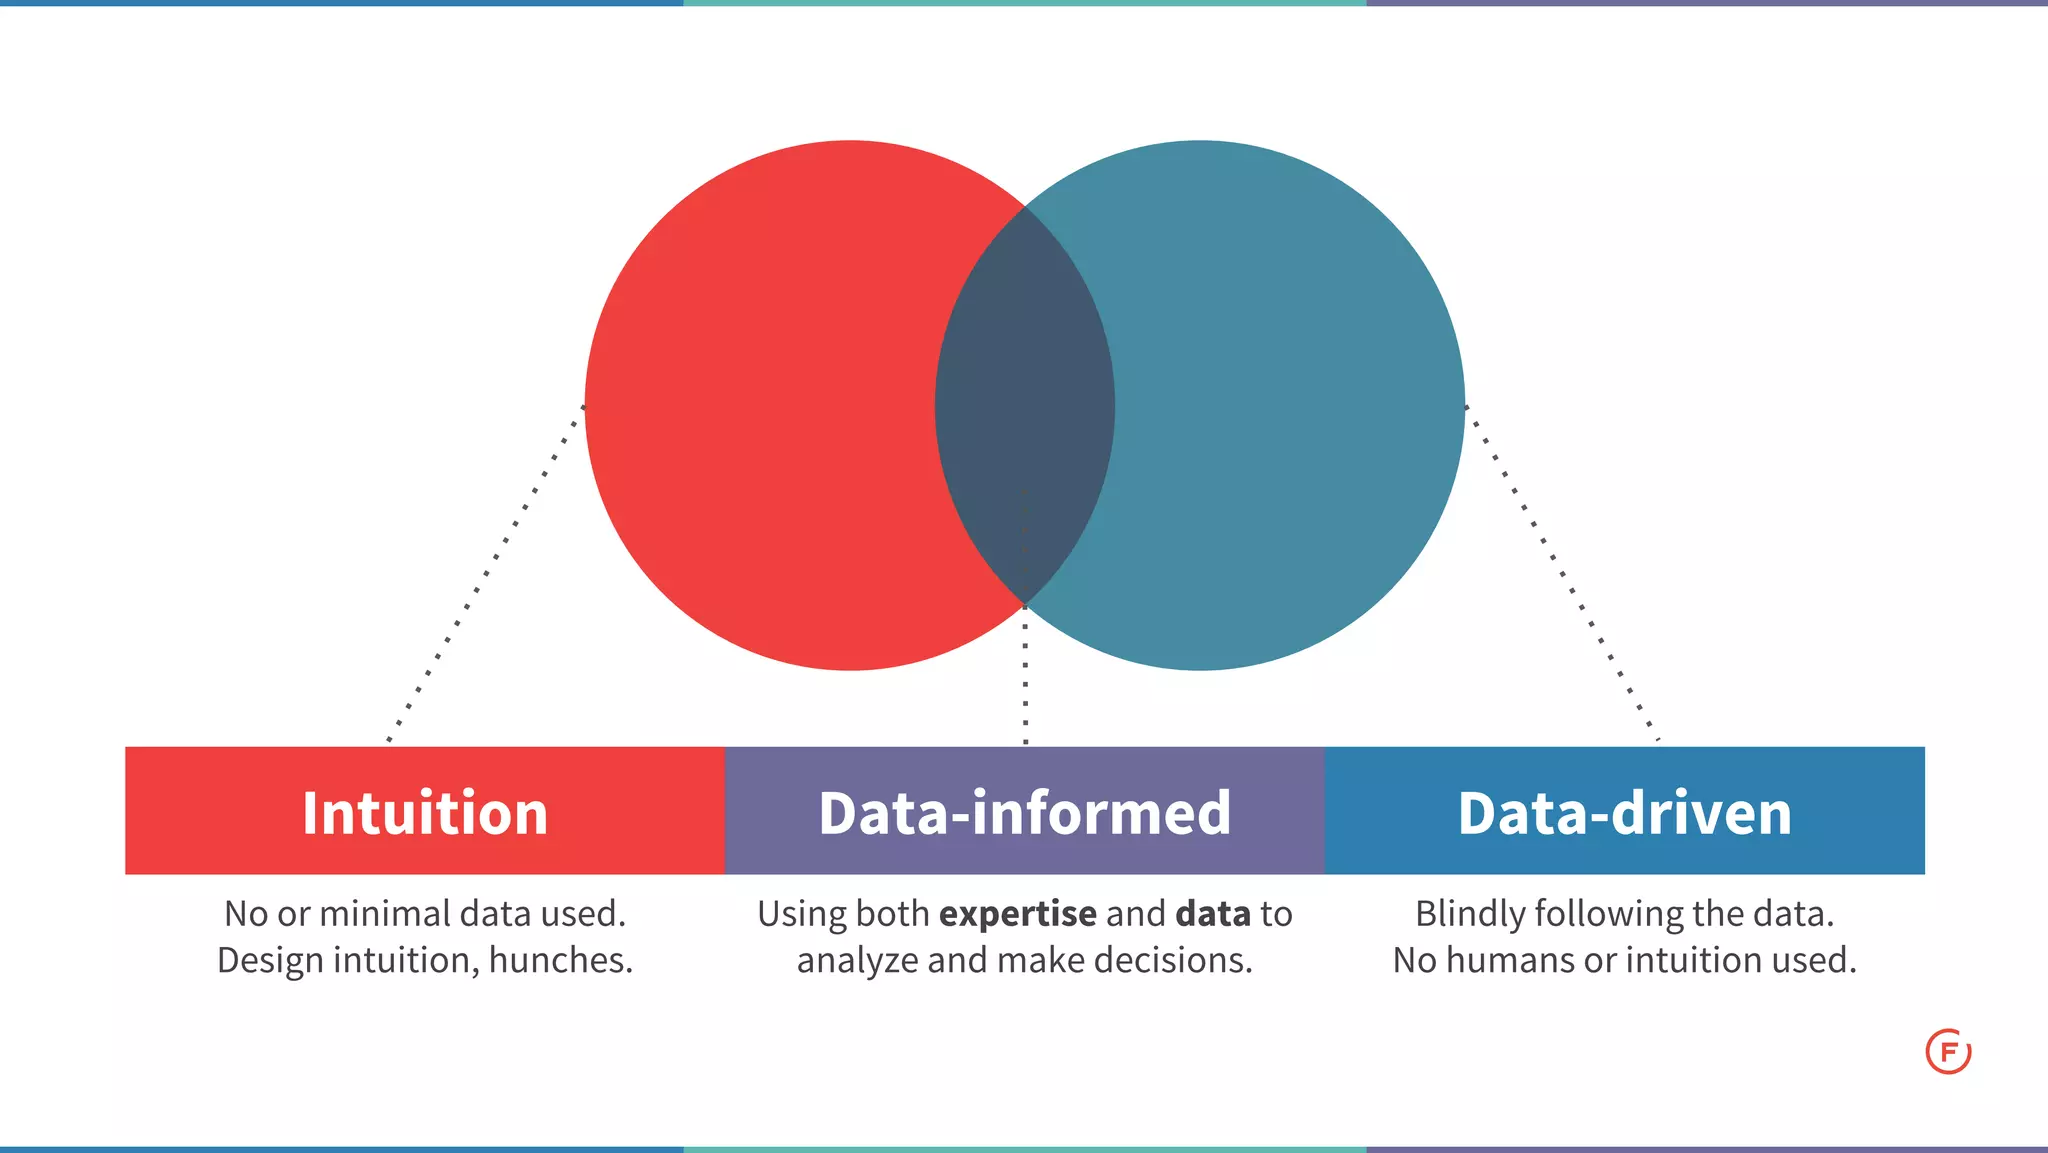


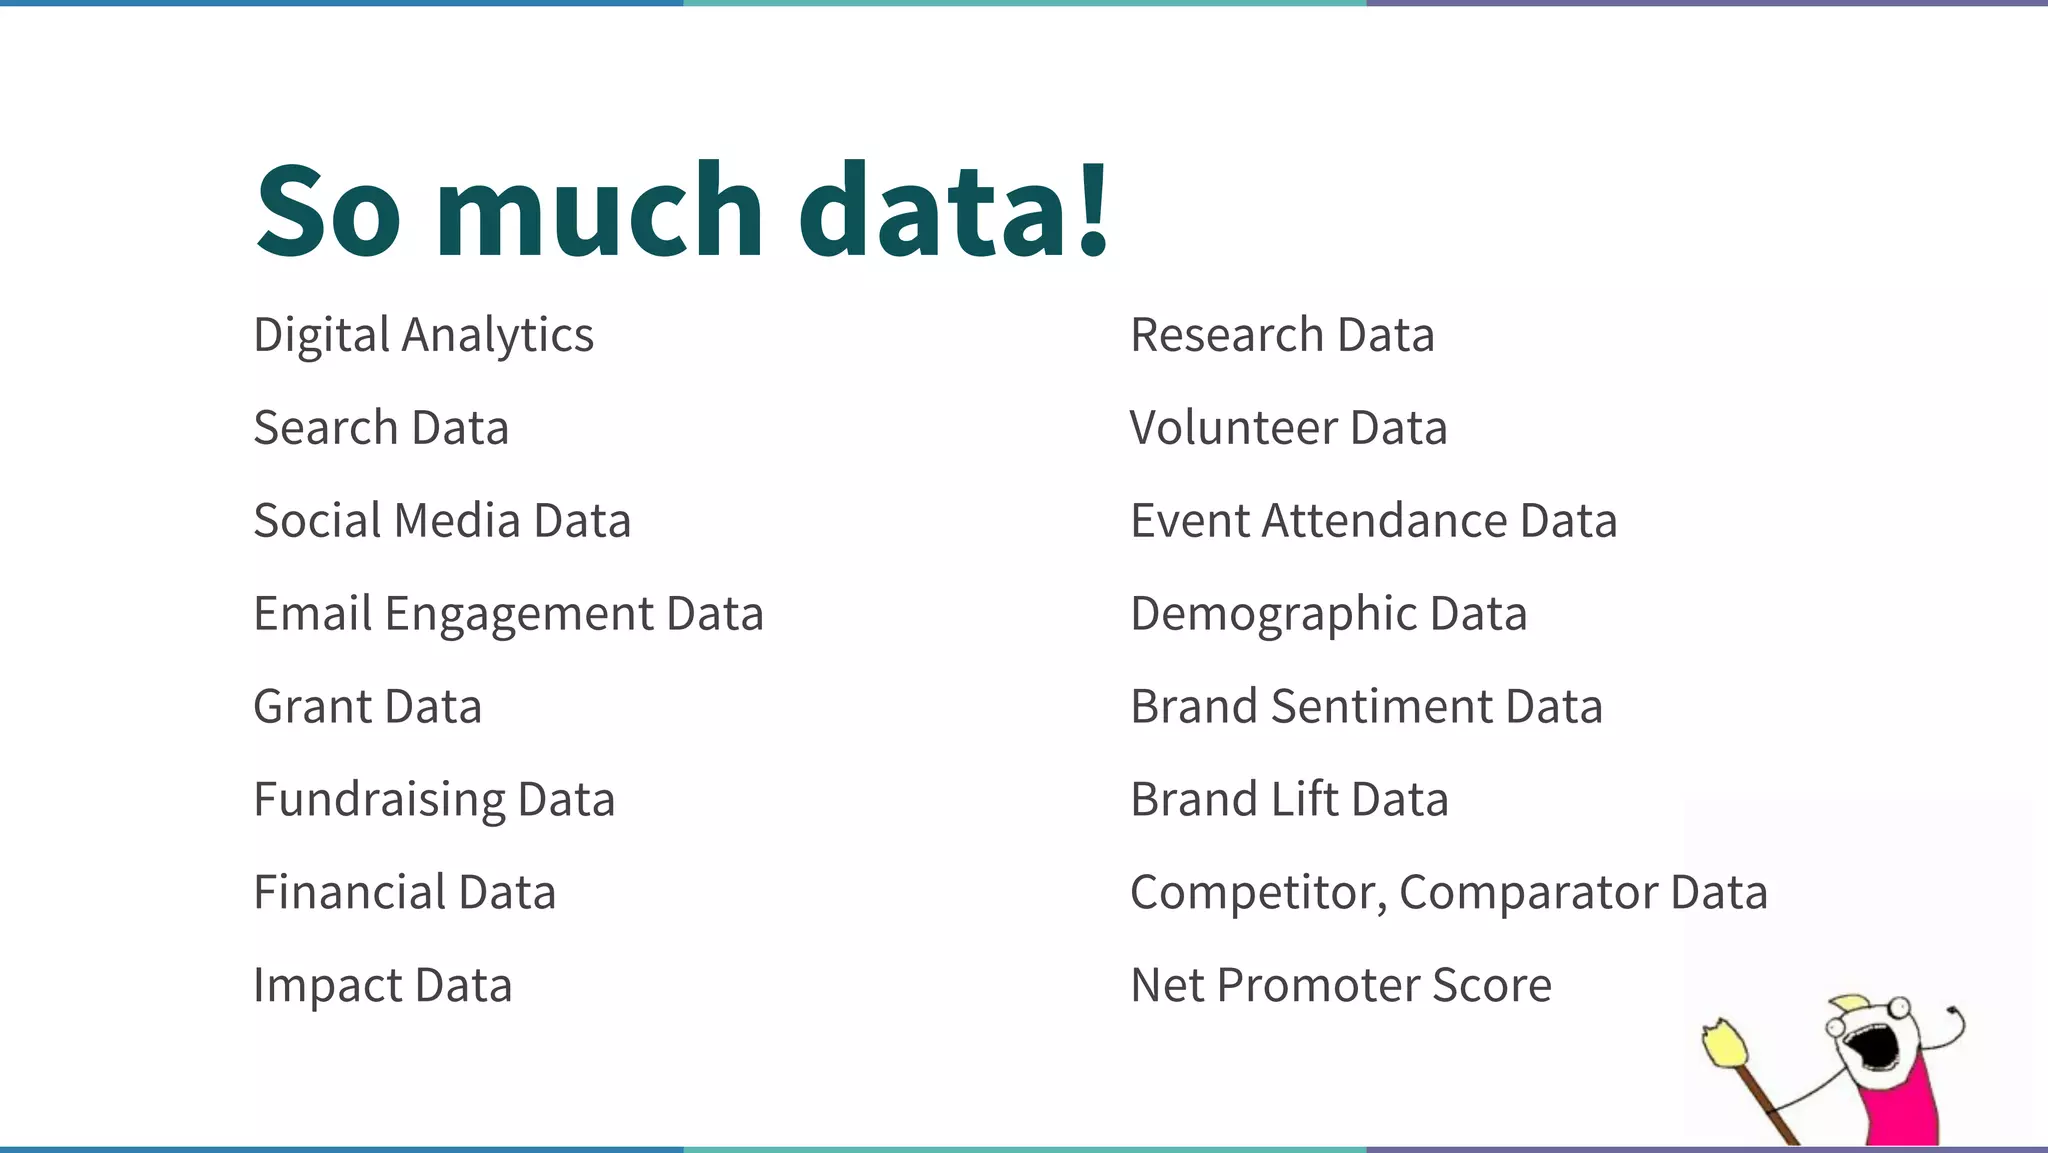

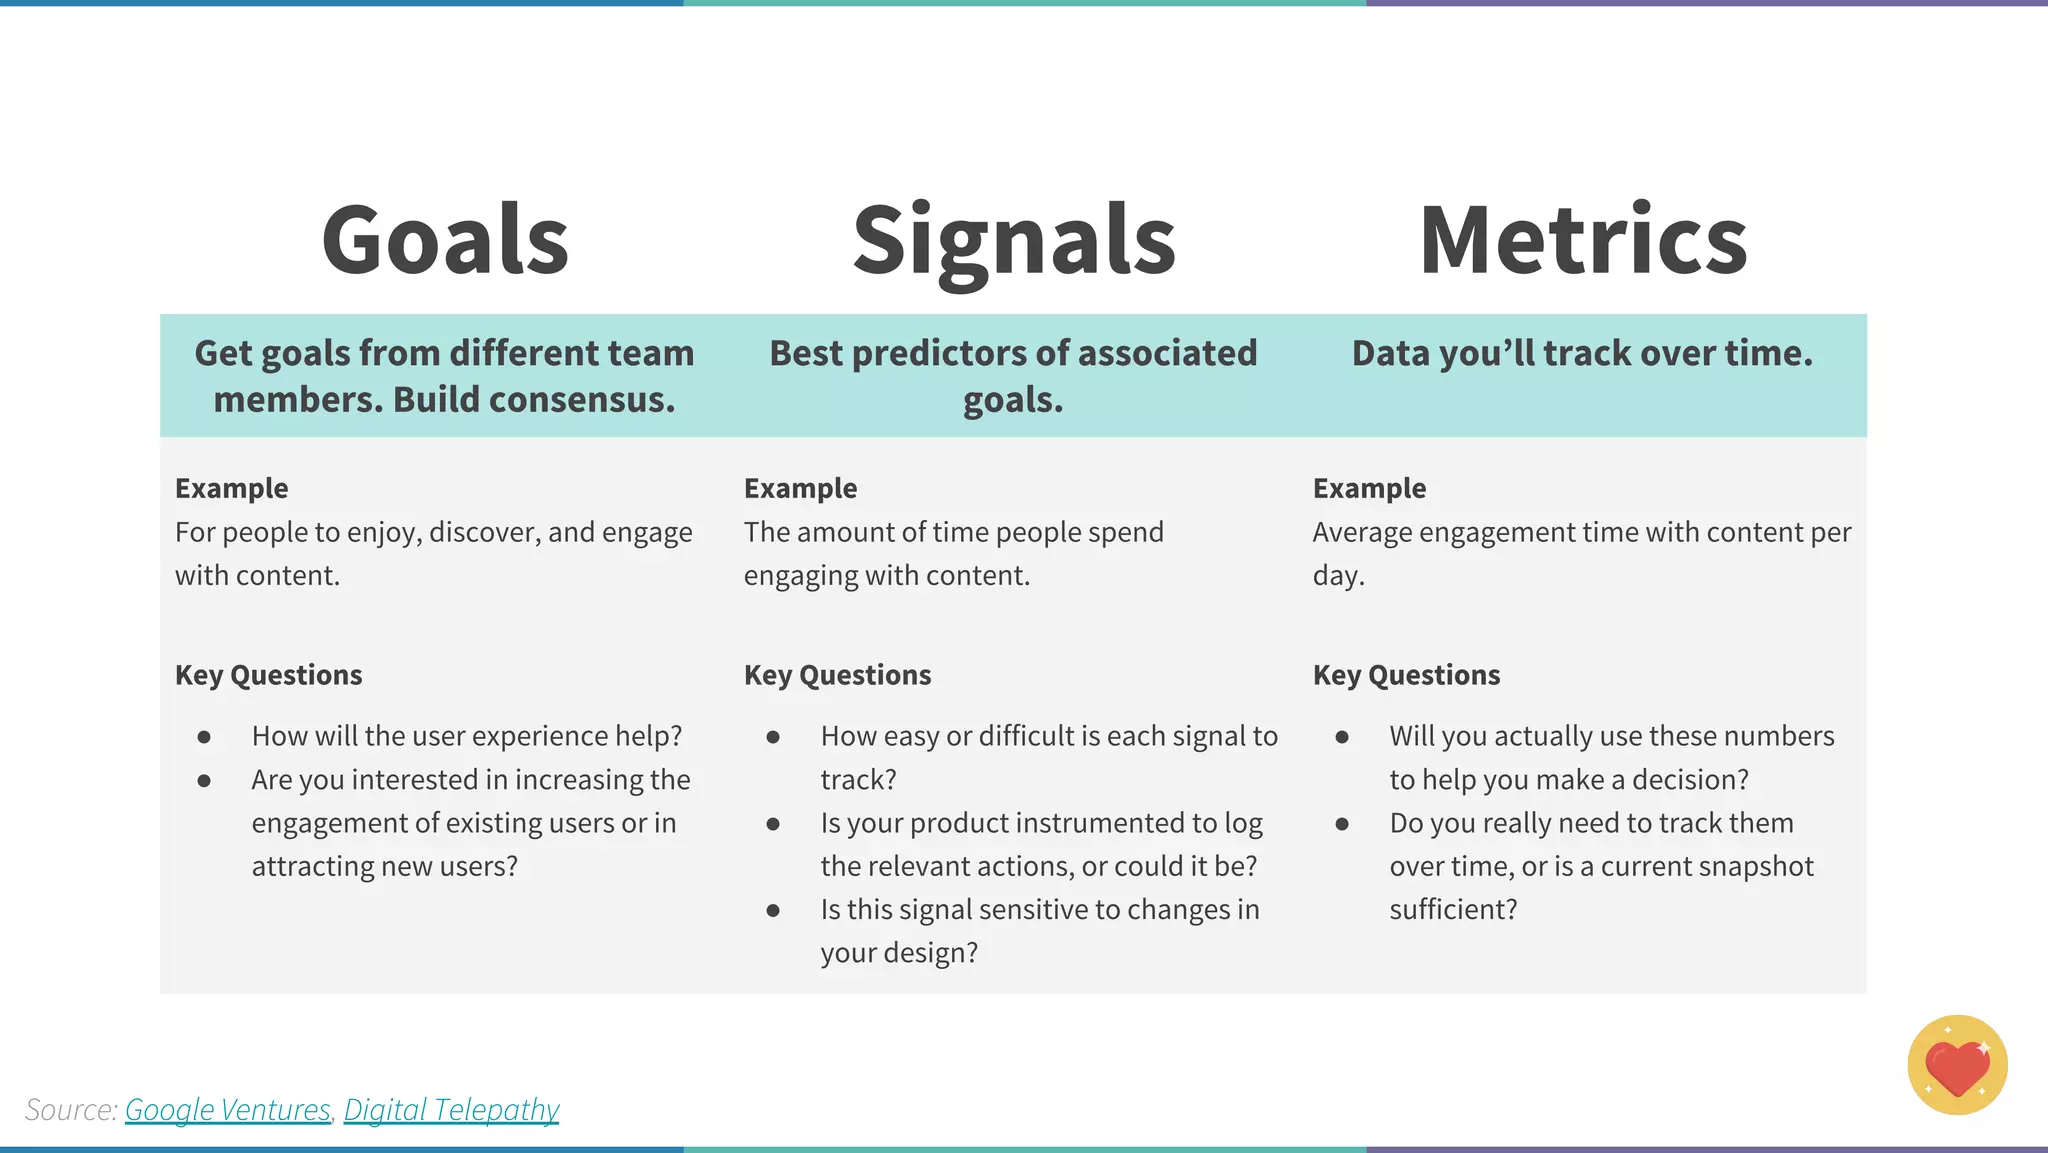

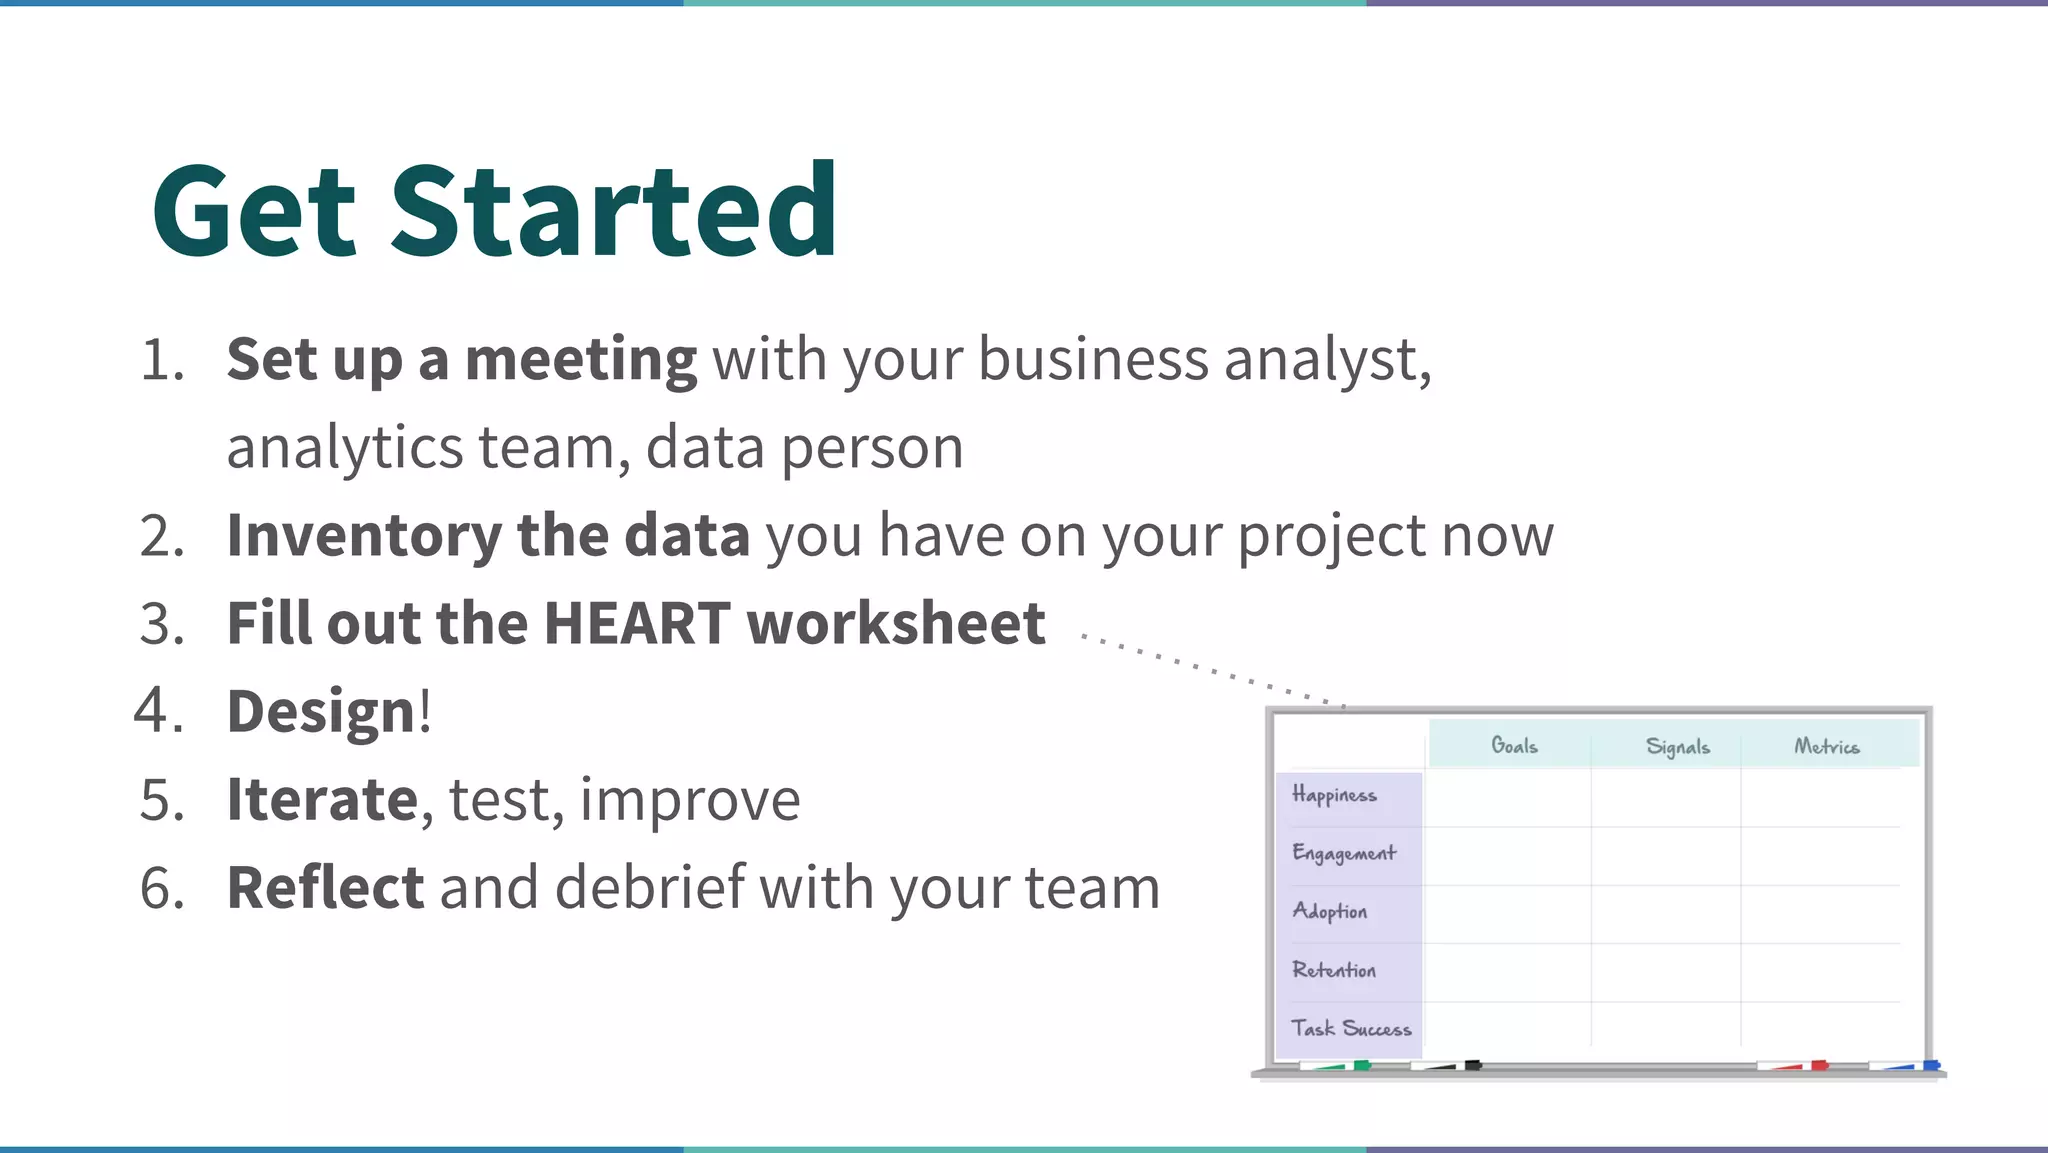


The document discusses the importance of data-informed design, distinguishing it from data-driven design. It emphasizes the necessity for designers to integrate business insights into their work, utilize various data sources for informed decision-making, and improve user experience through iterative design. The text also outlines steps to develop a data-informed approach and addresses common challenges faced in implementing data-informed design practices.


