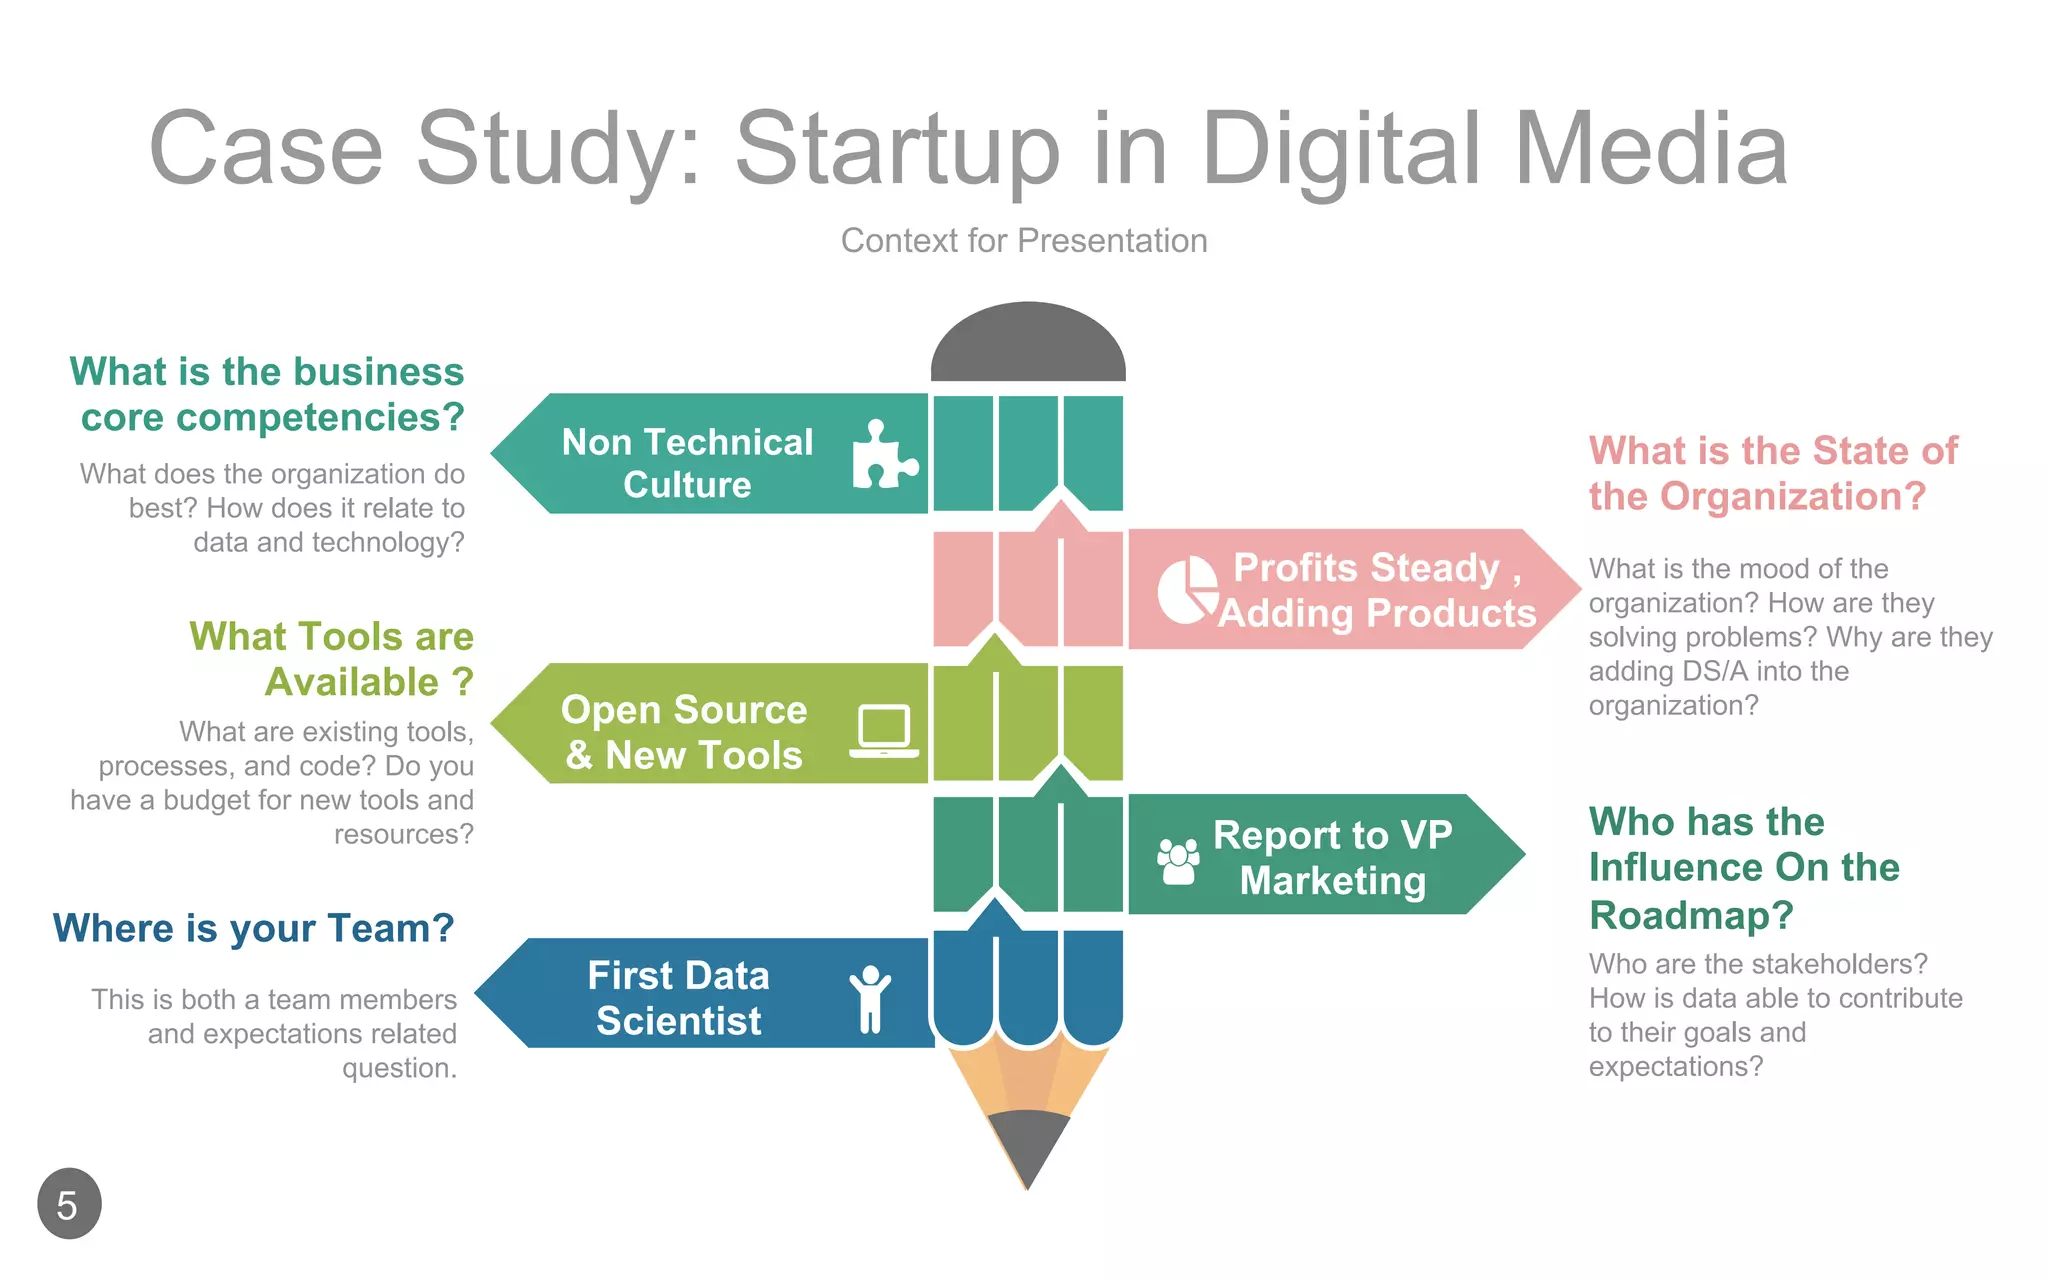
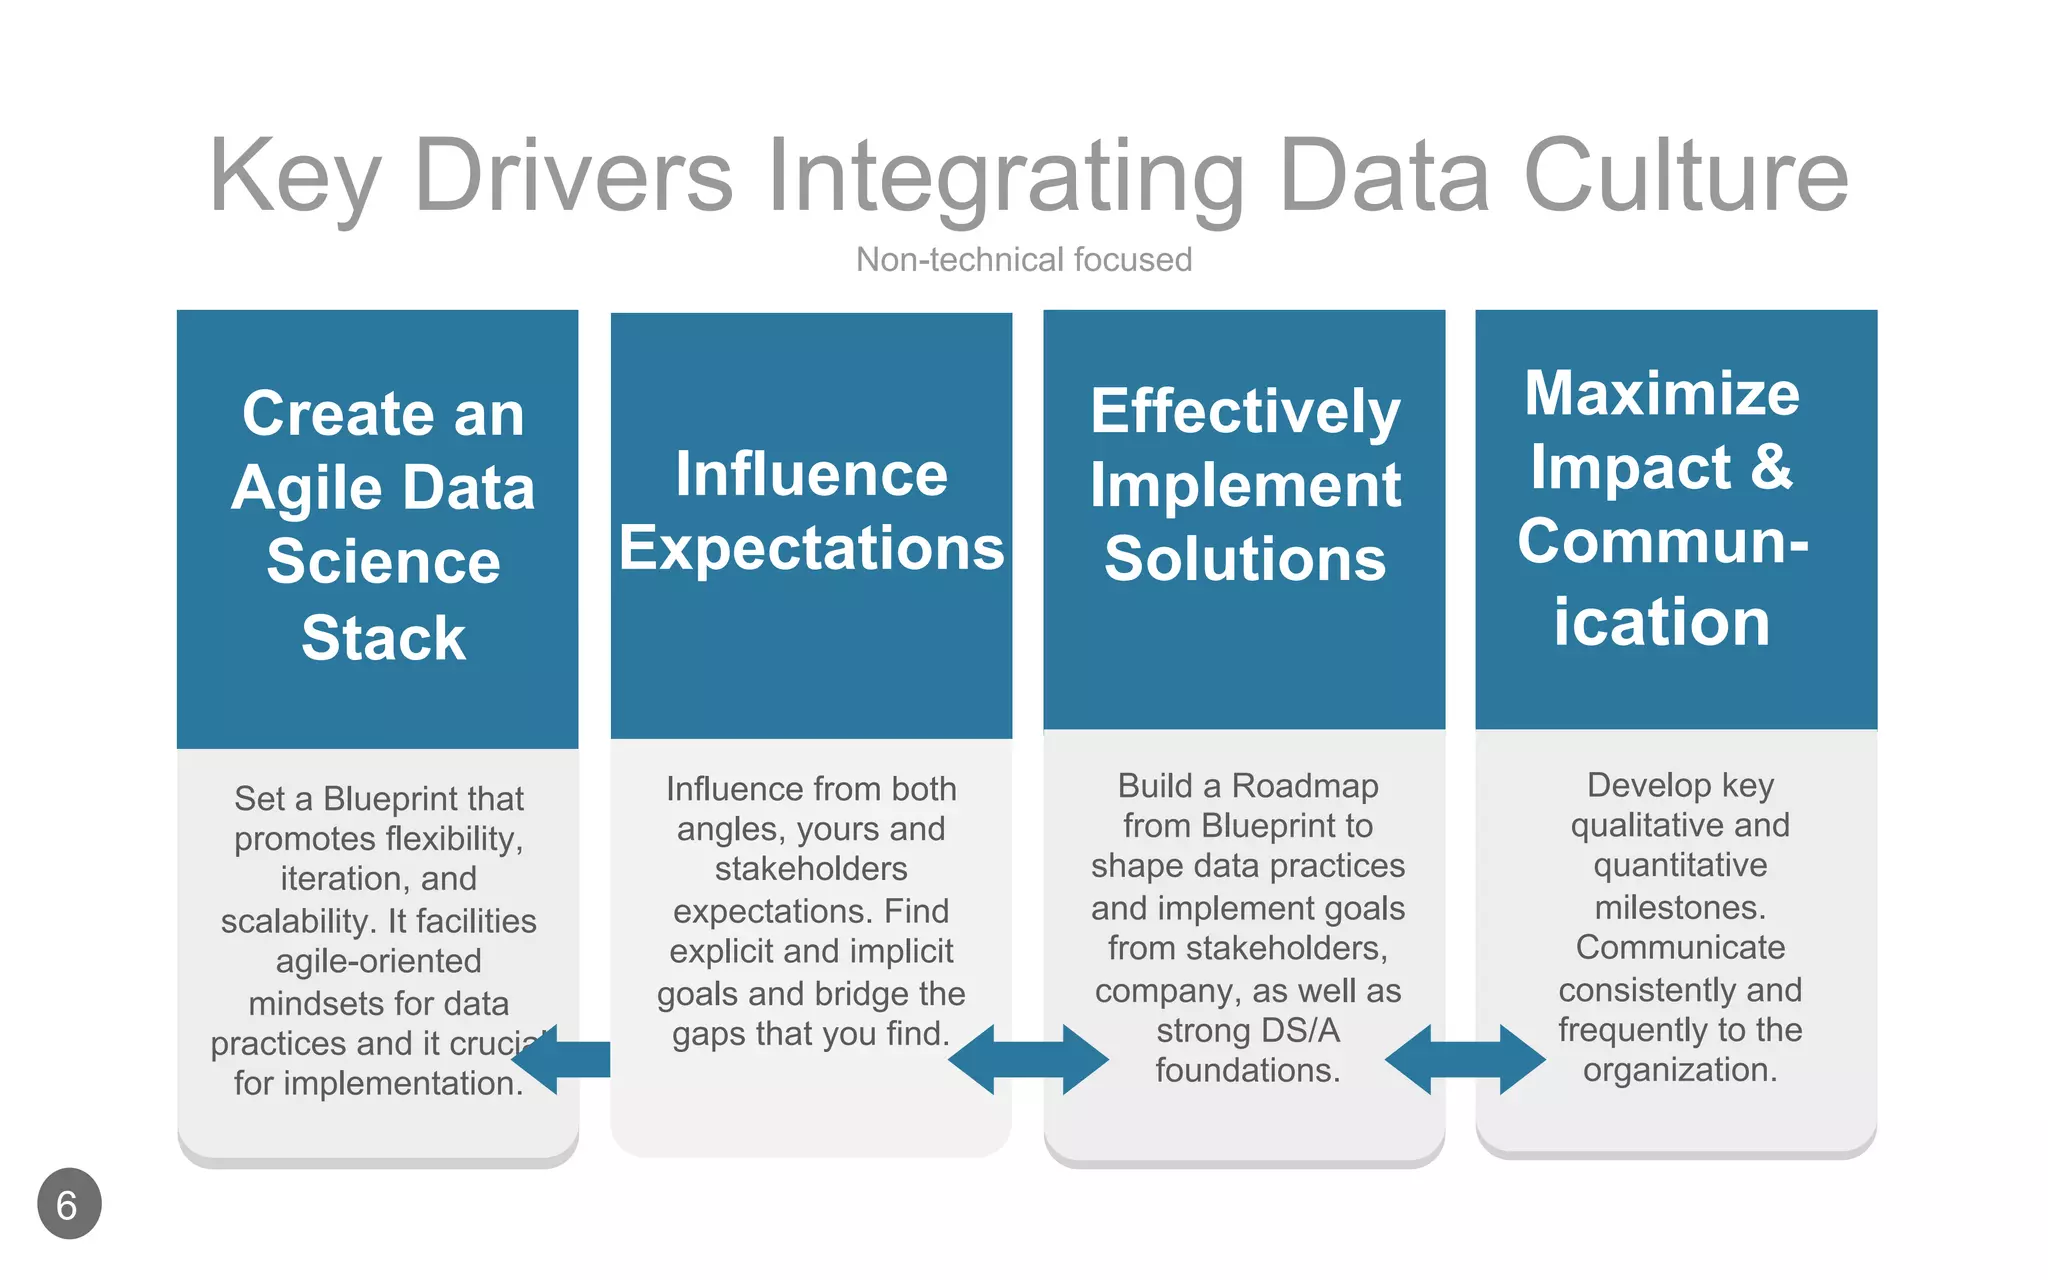
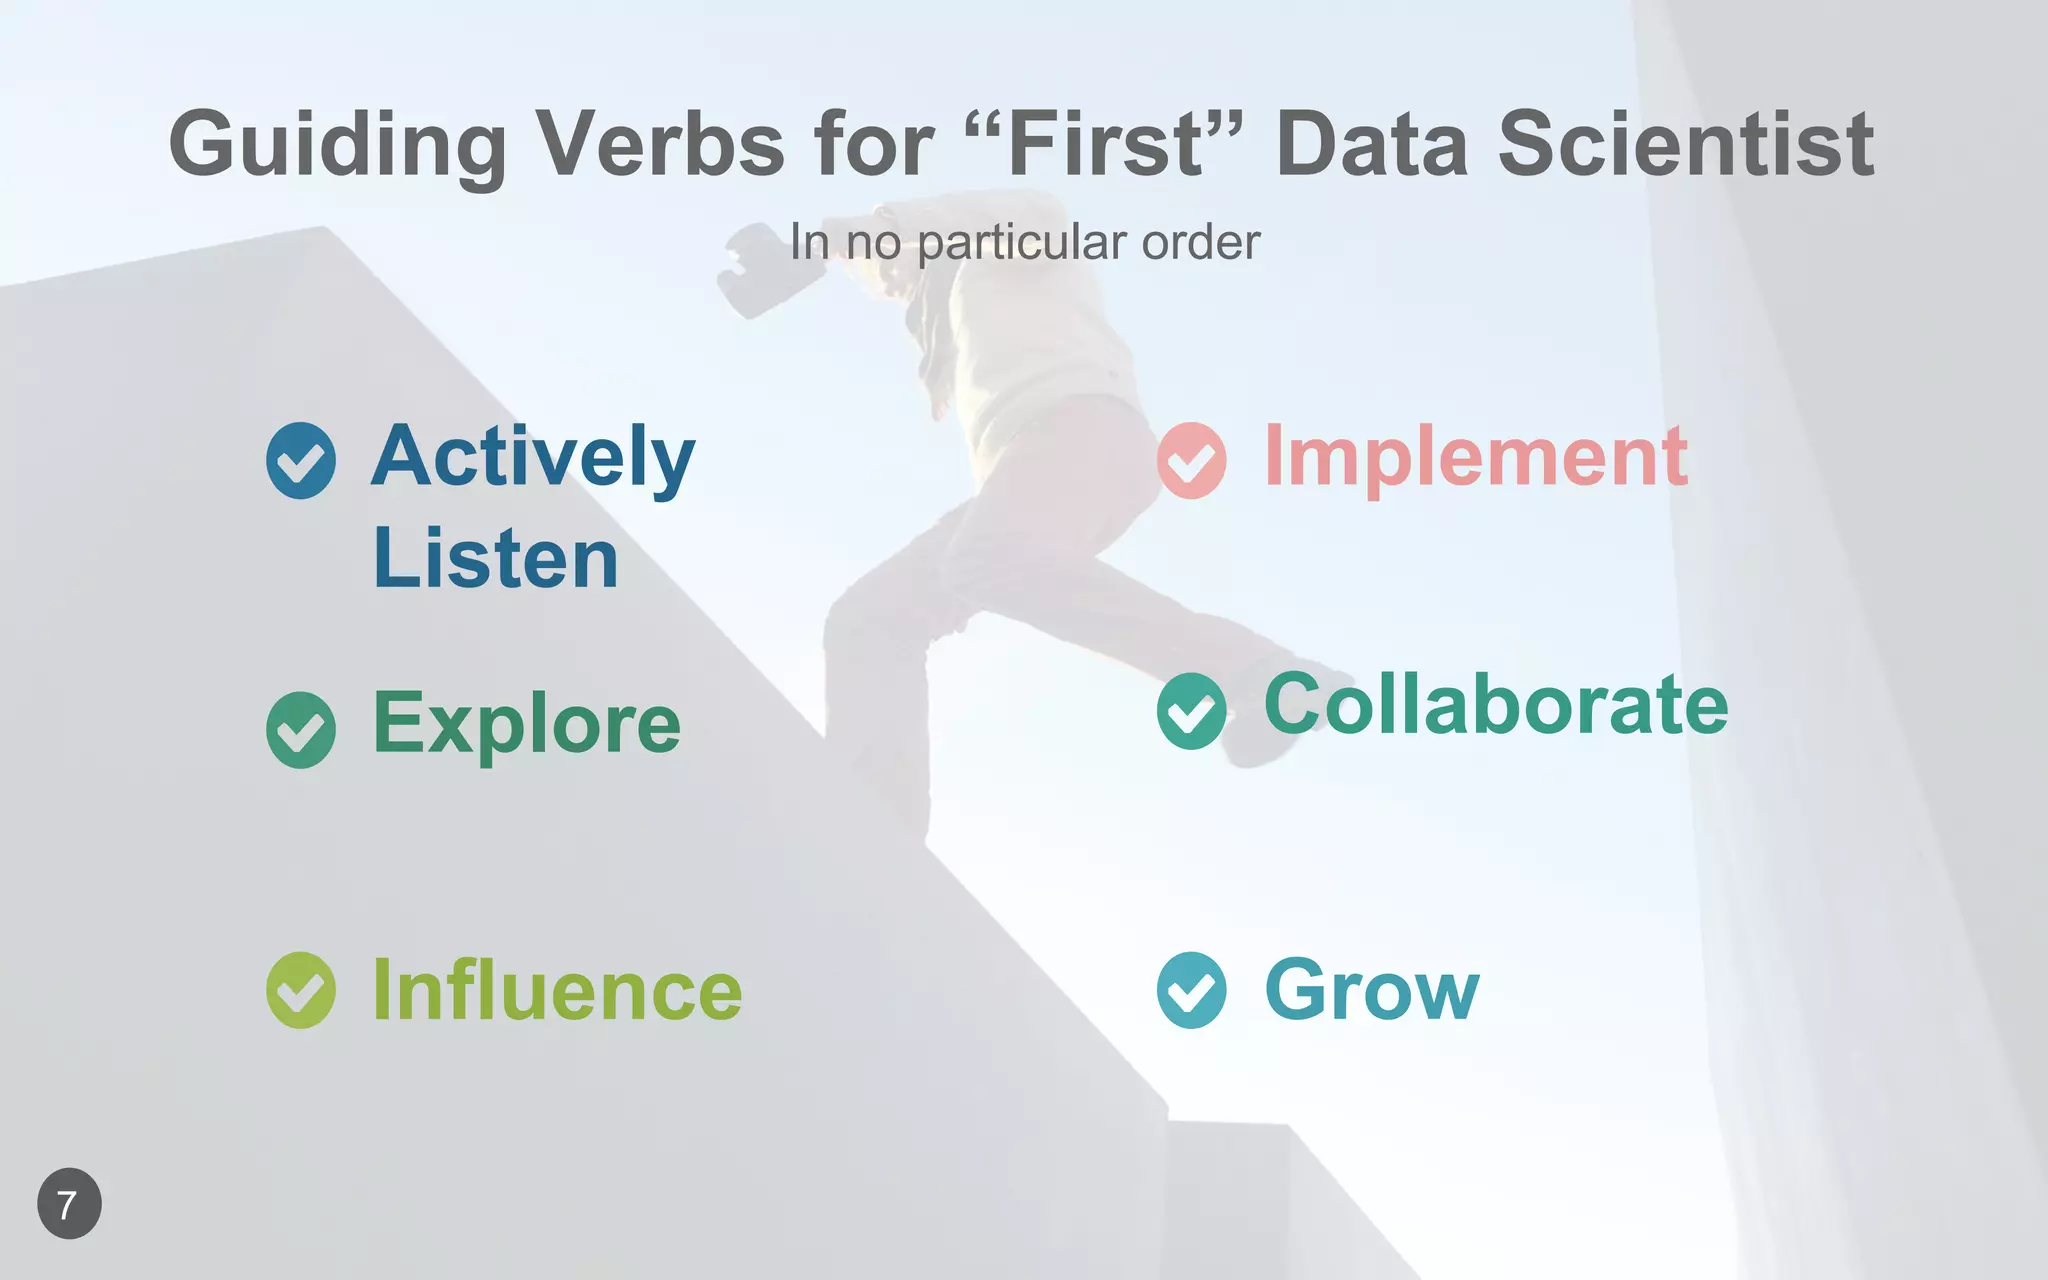
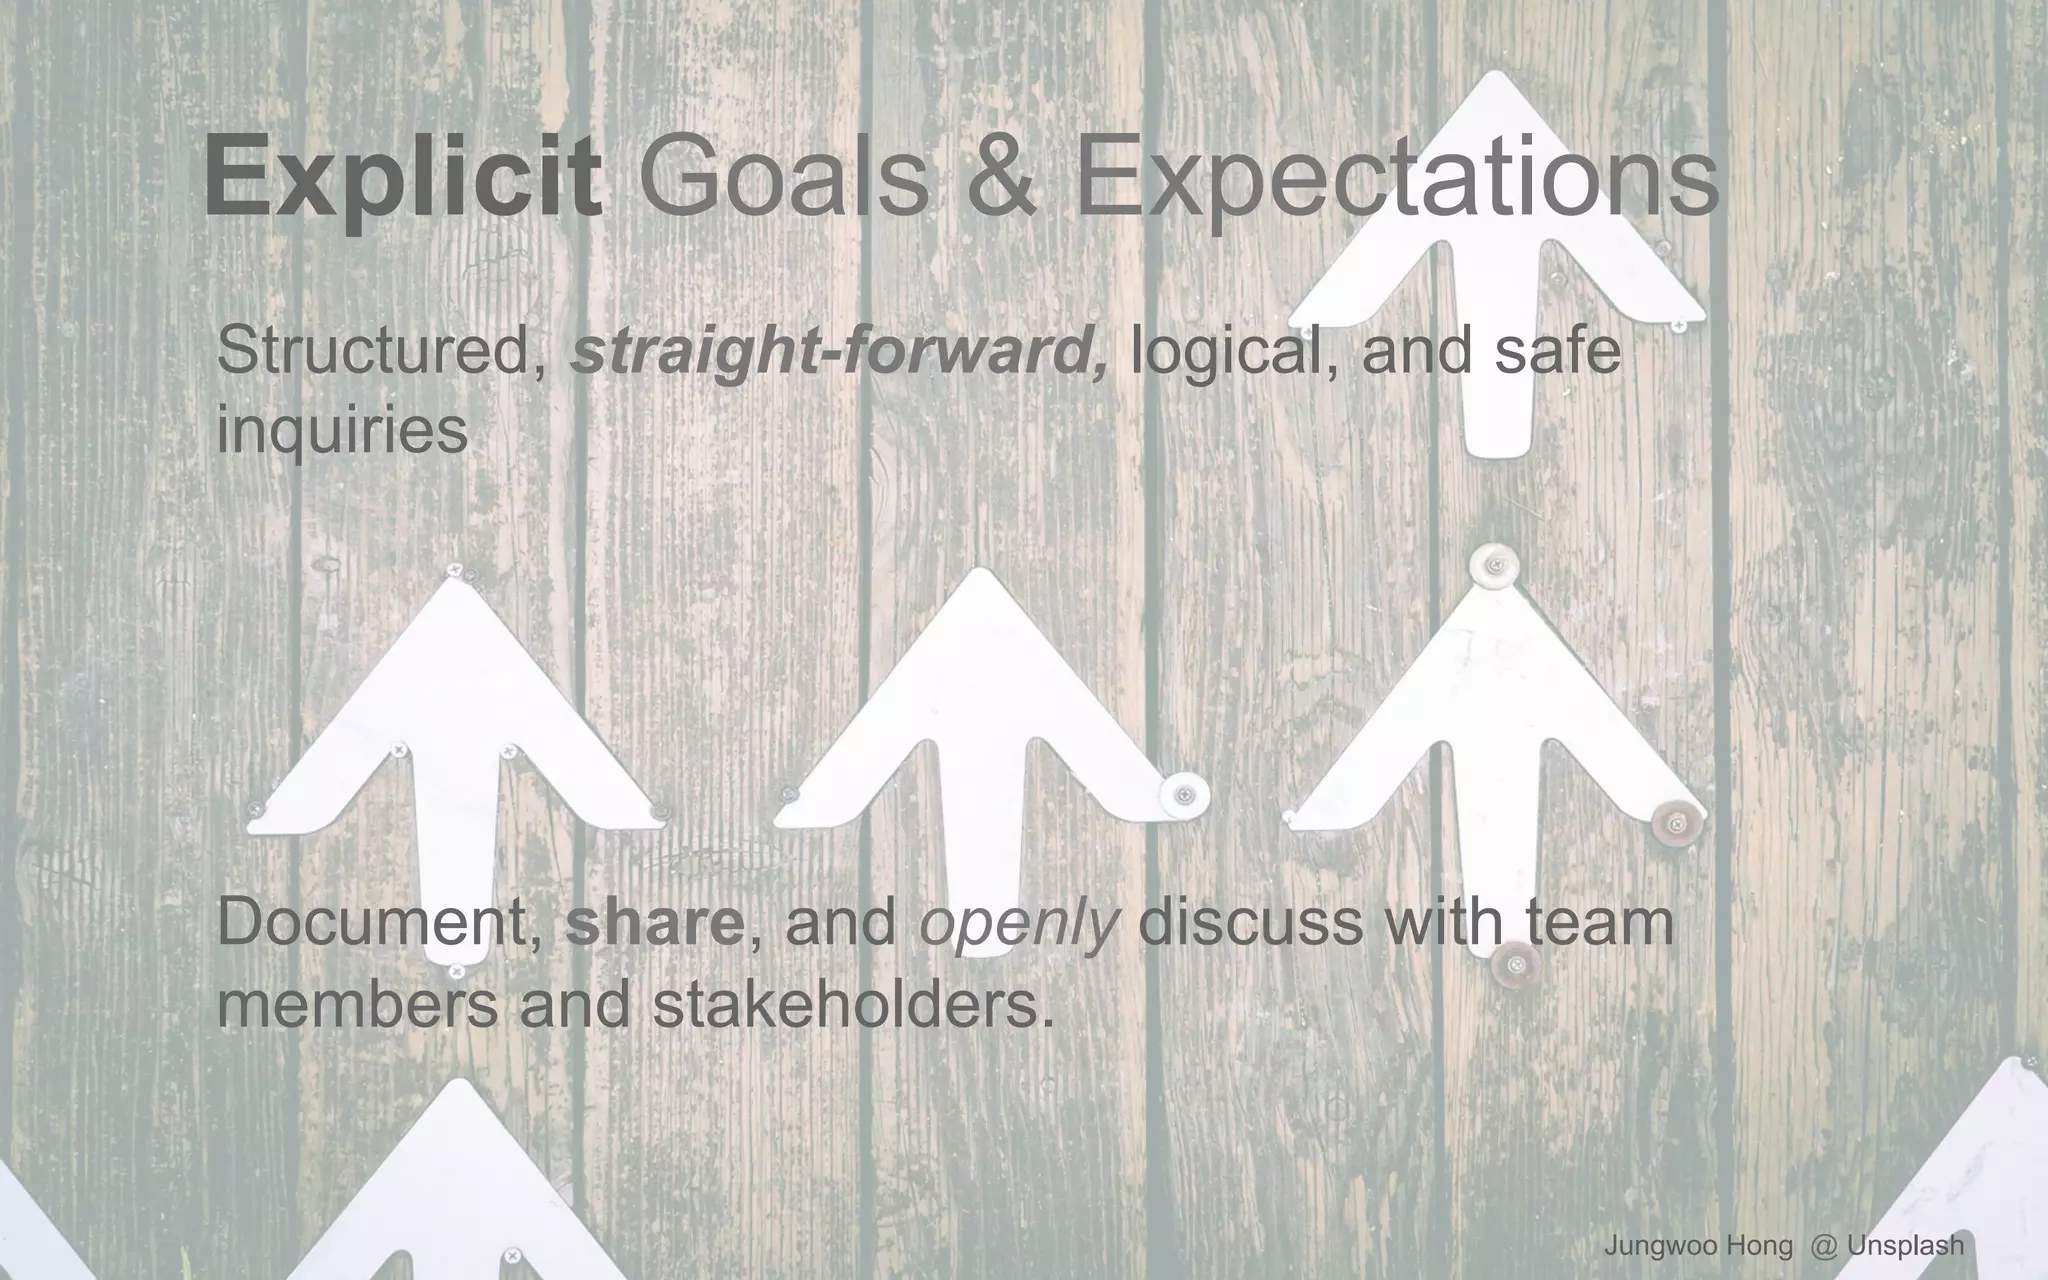
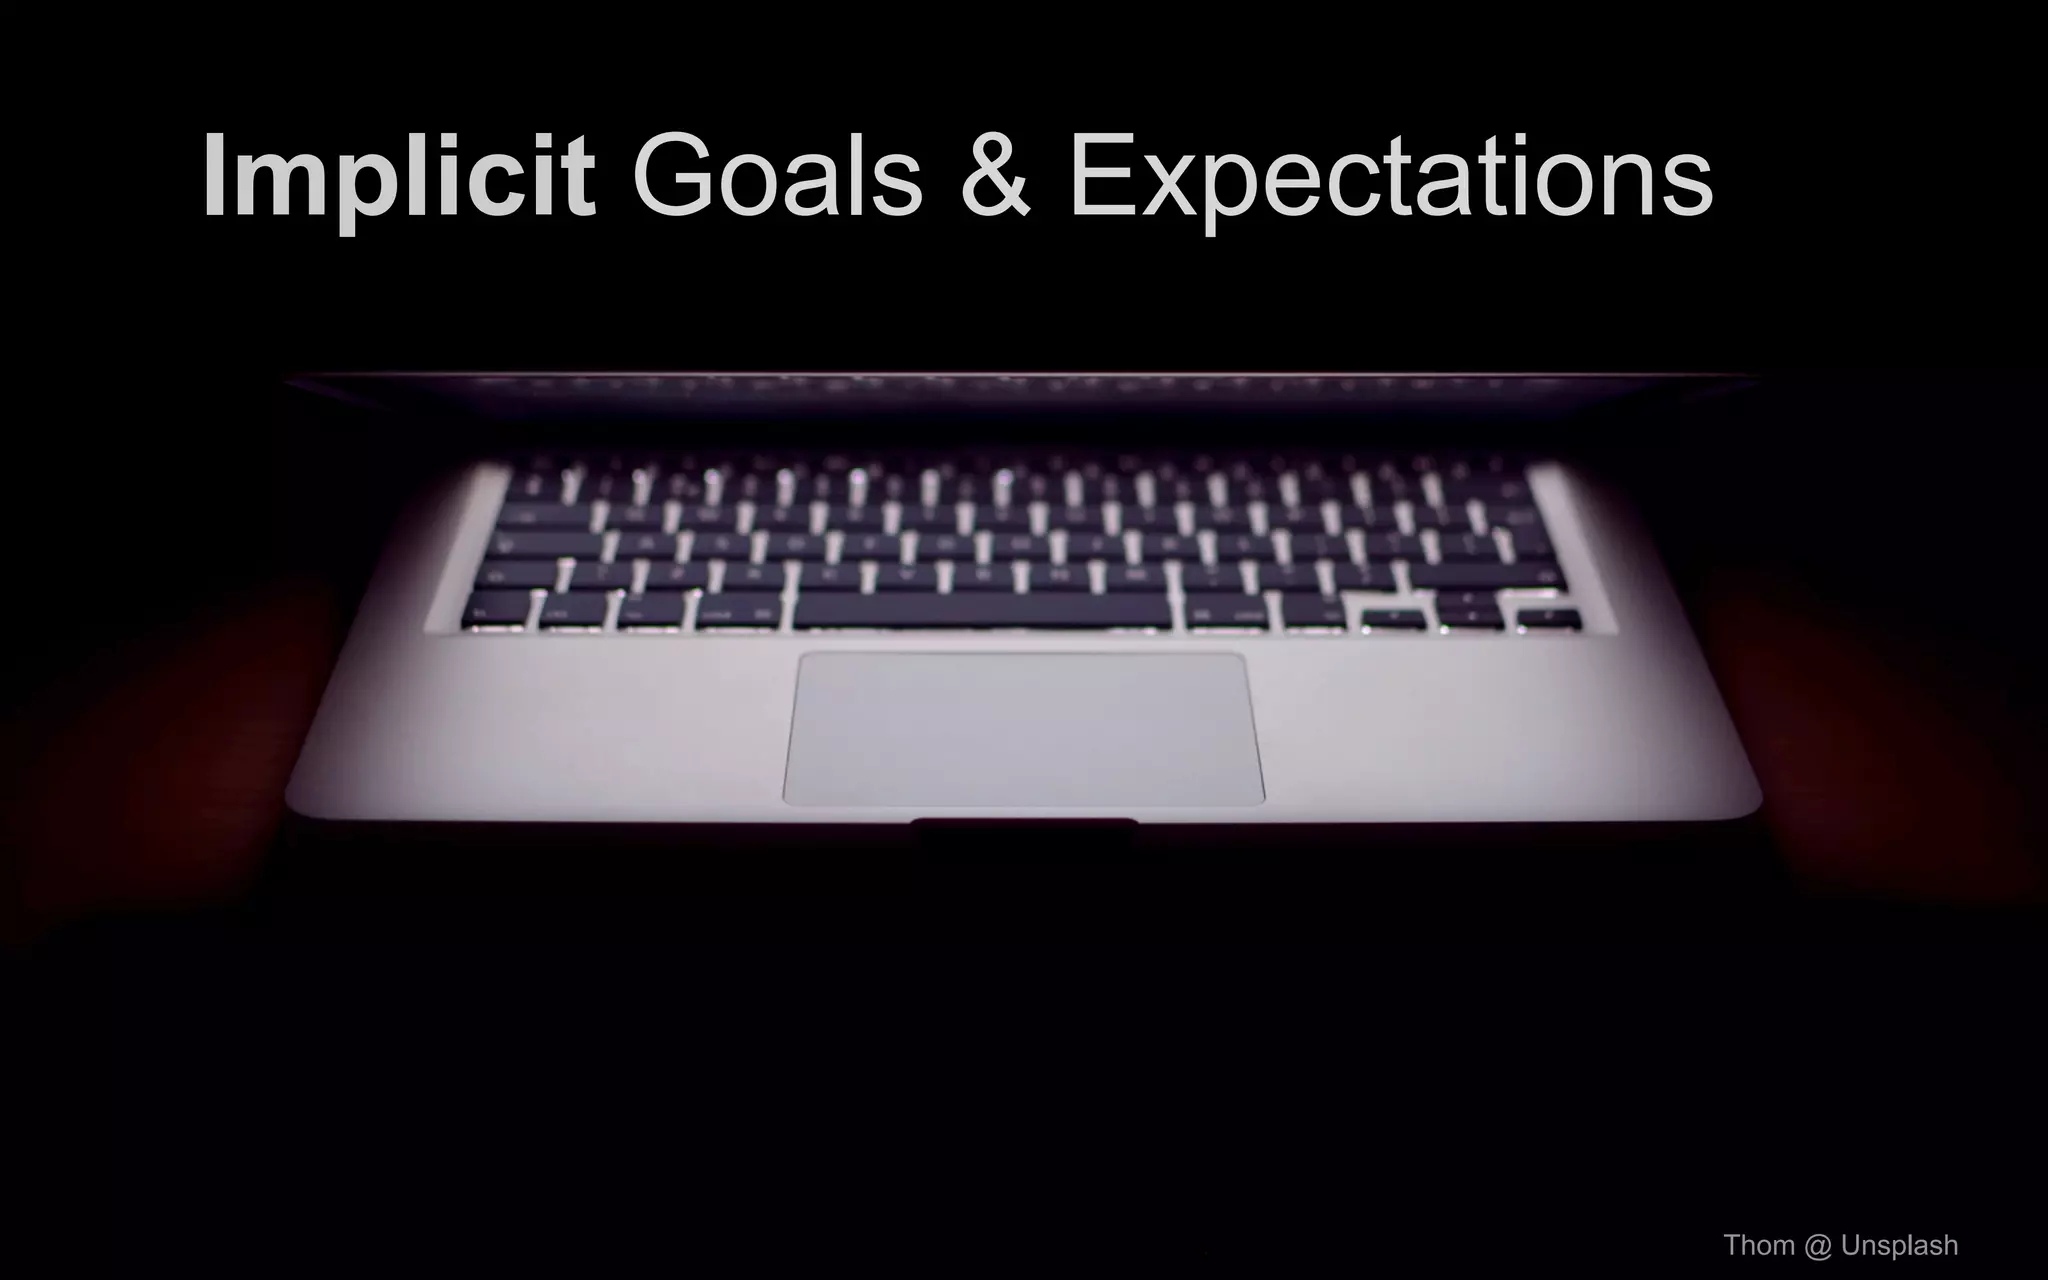
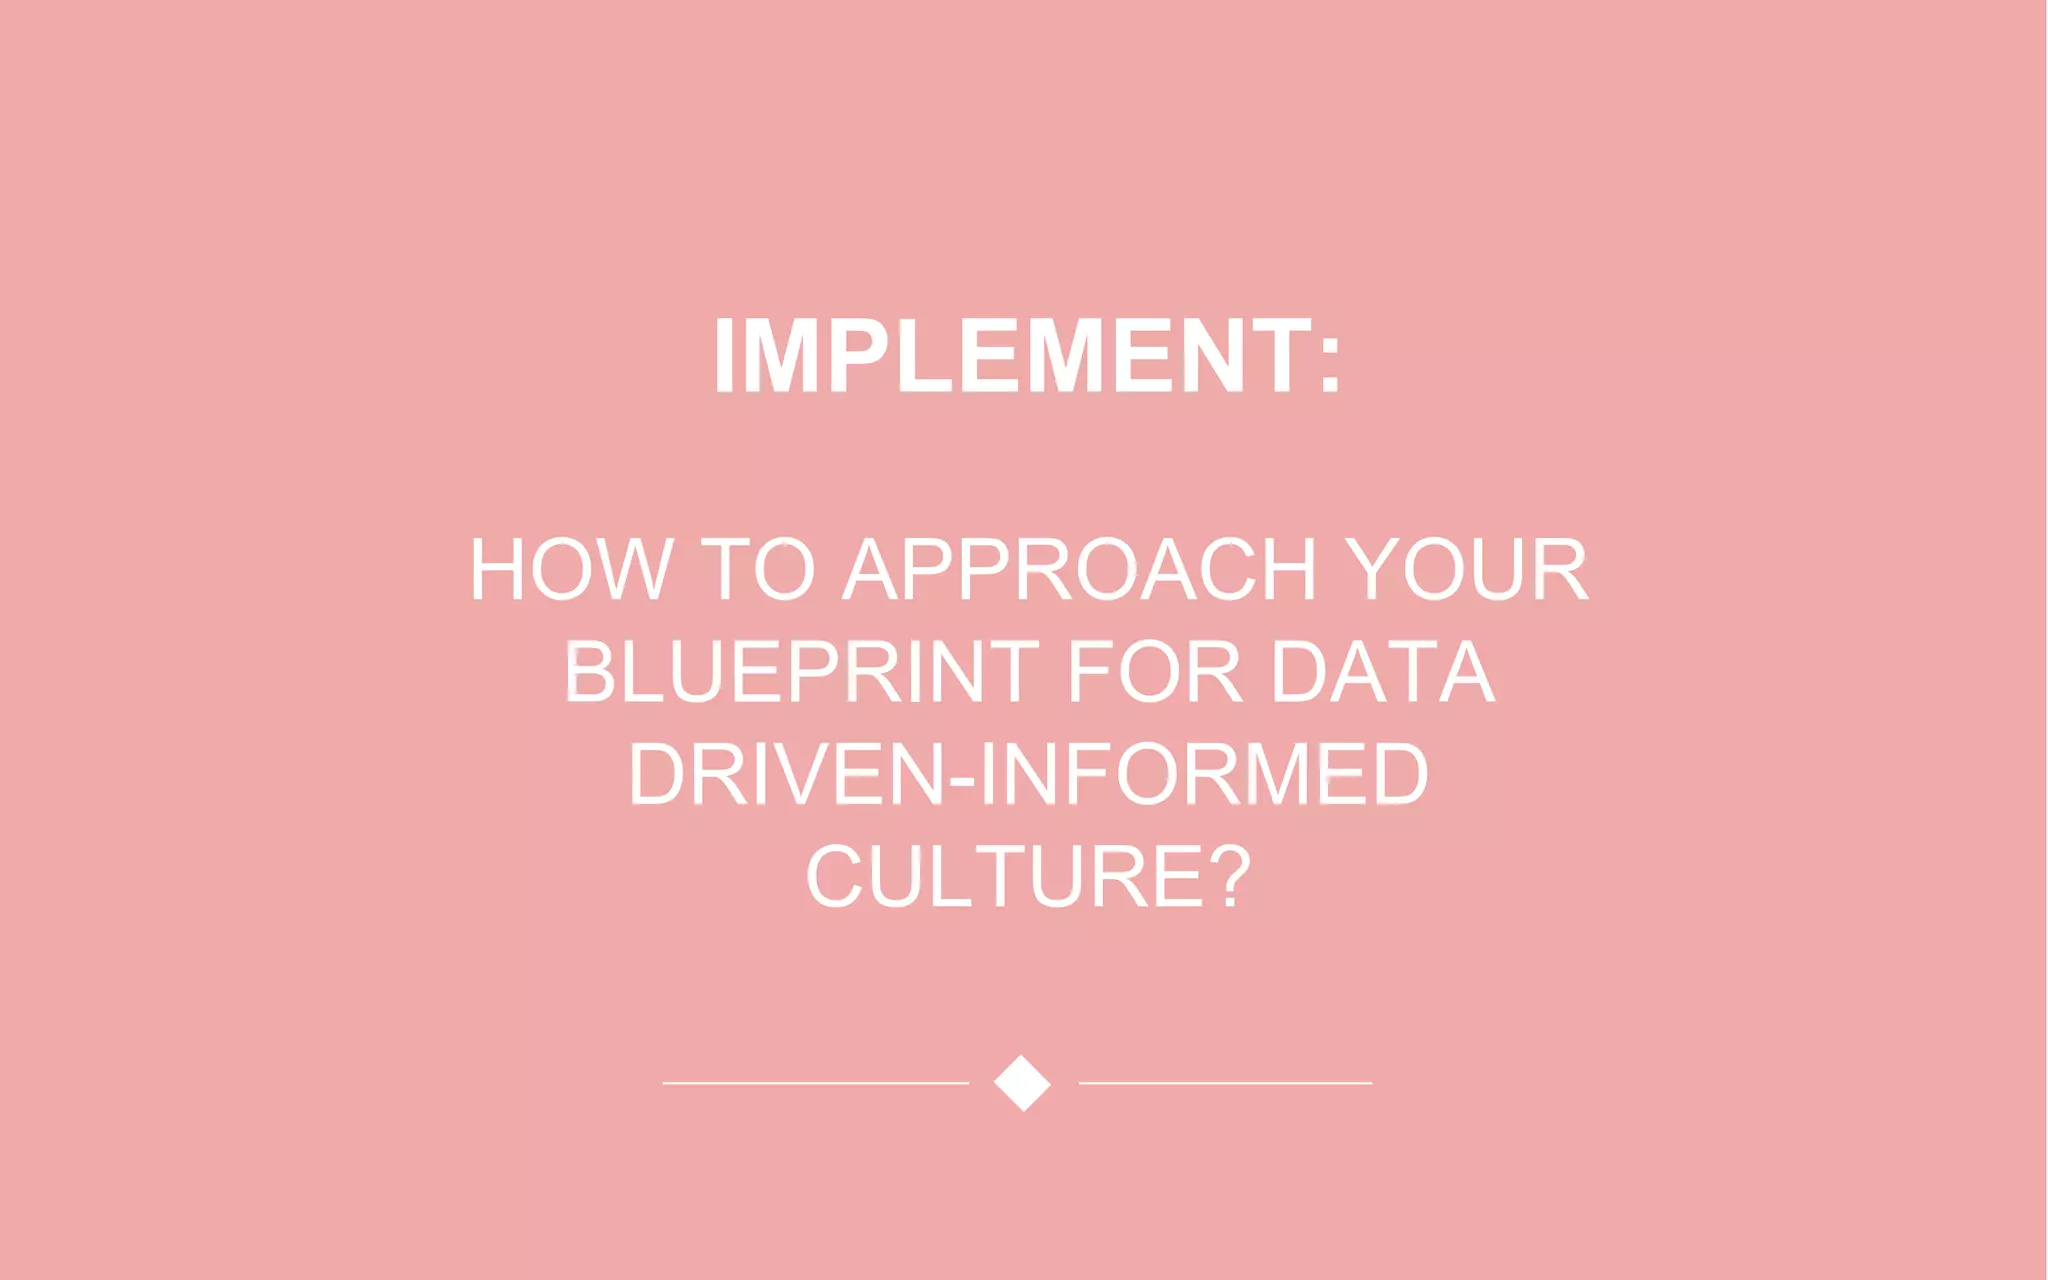
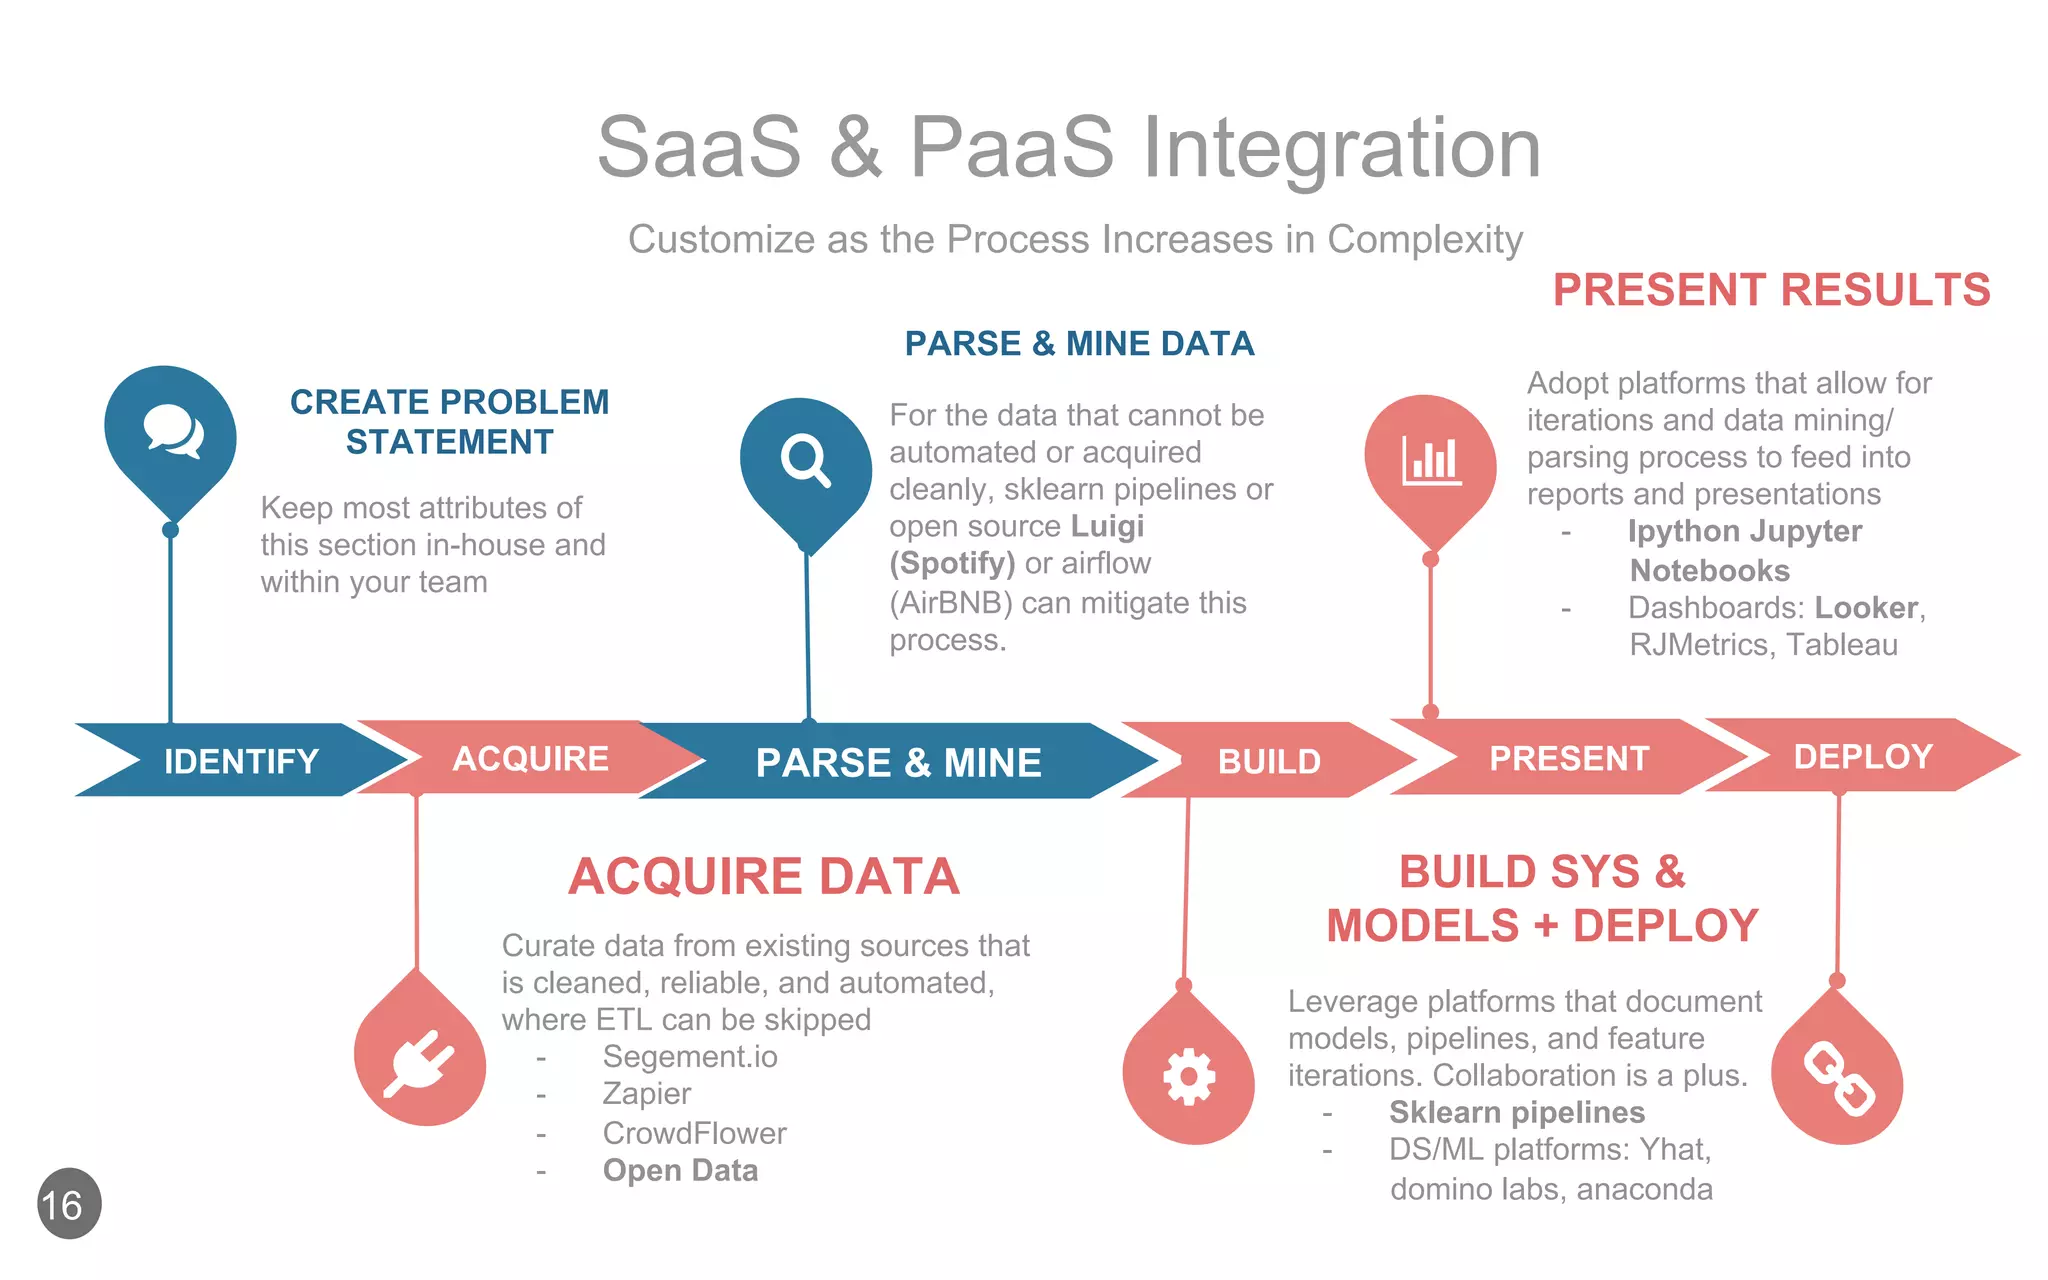
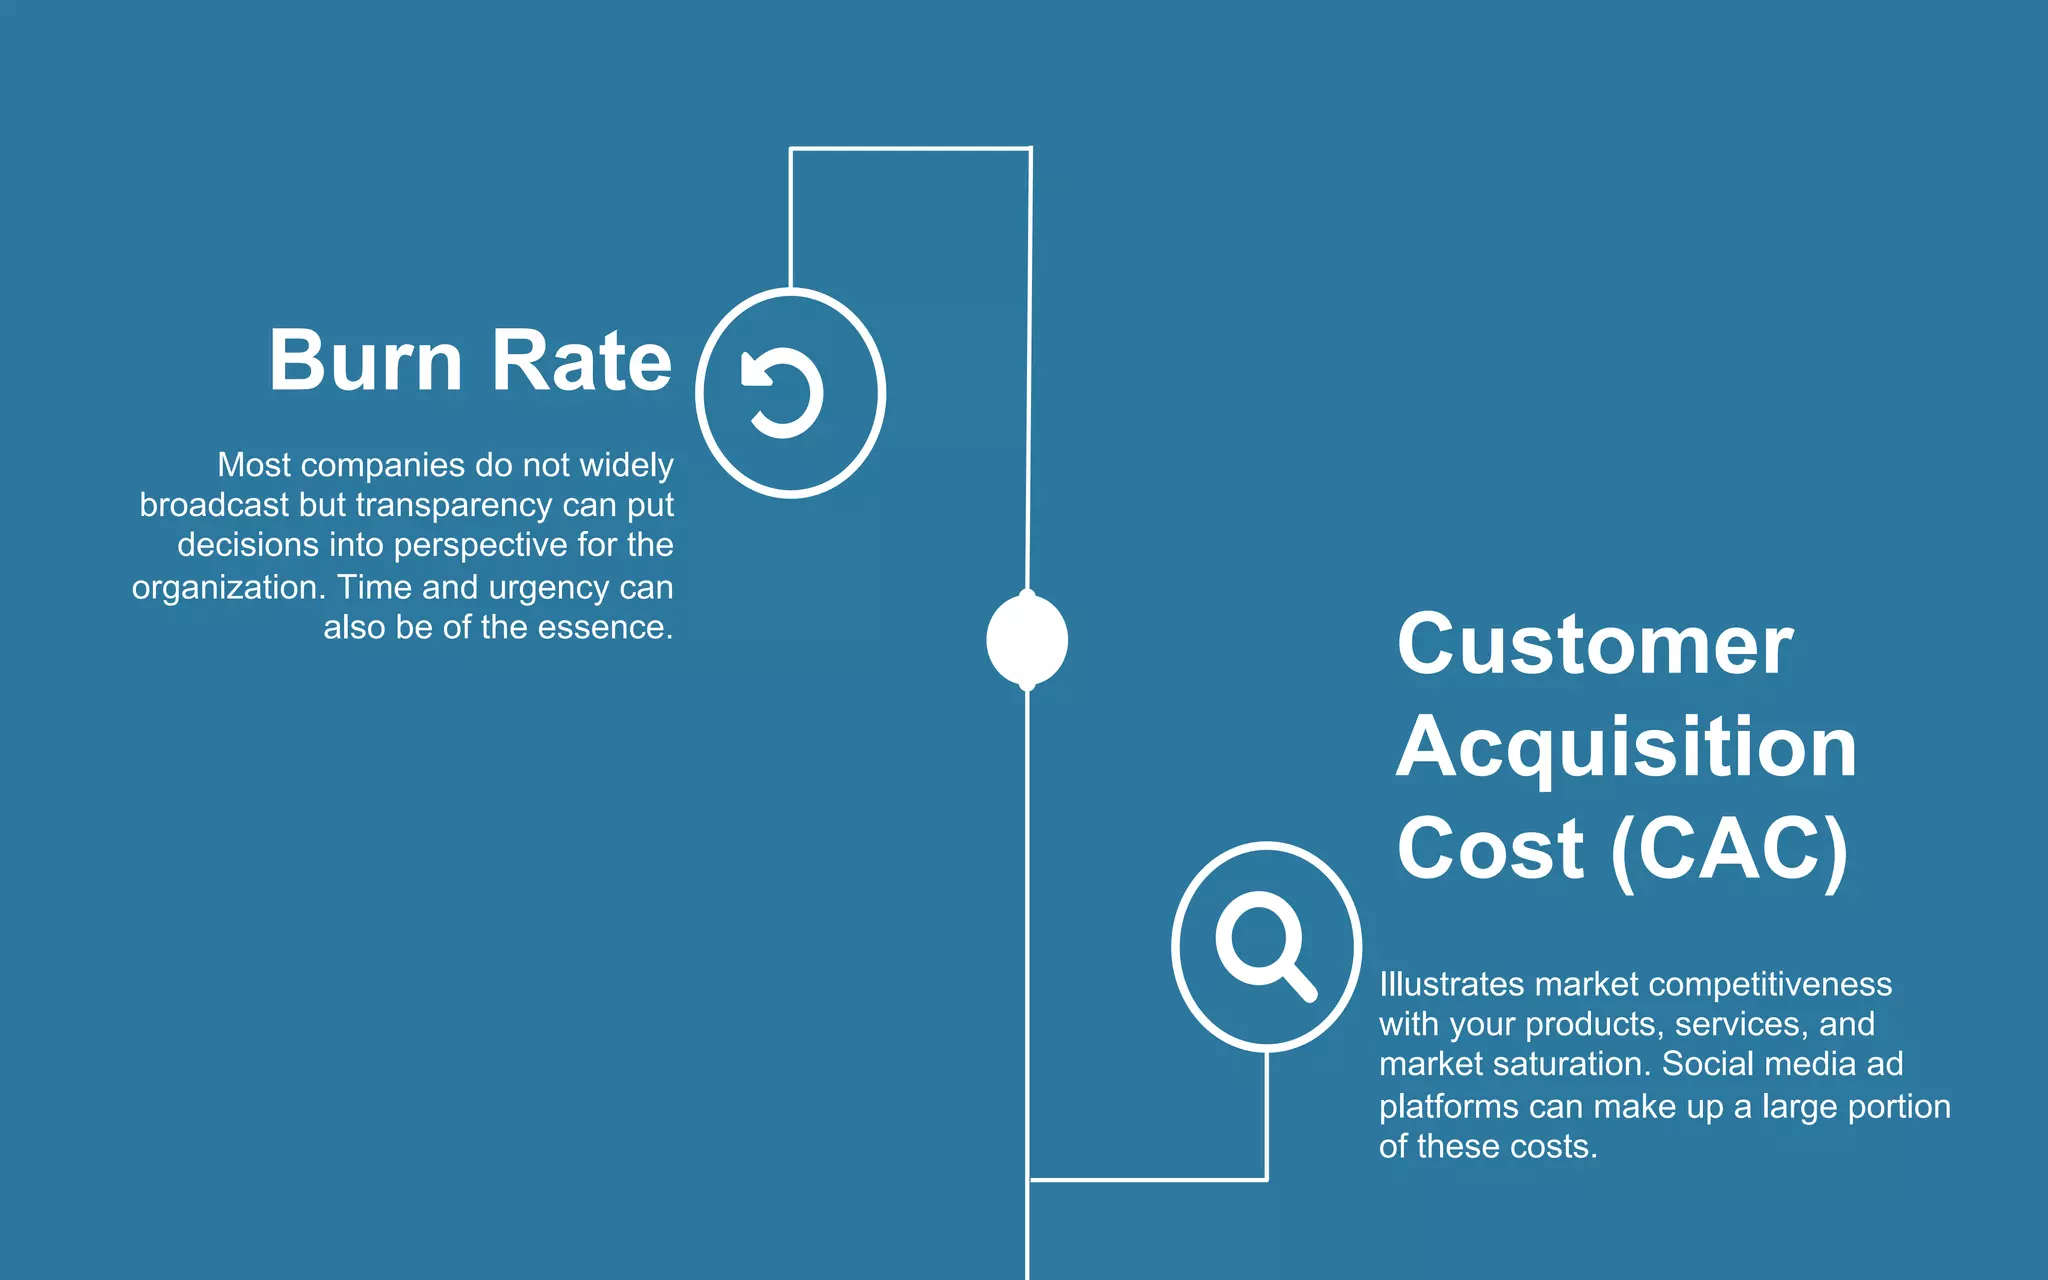
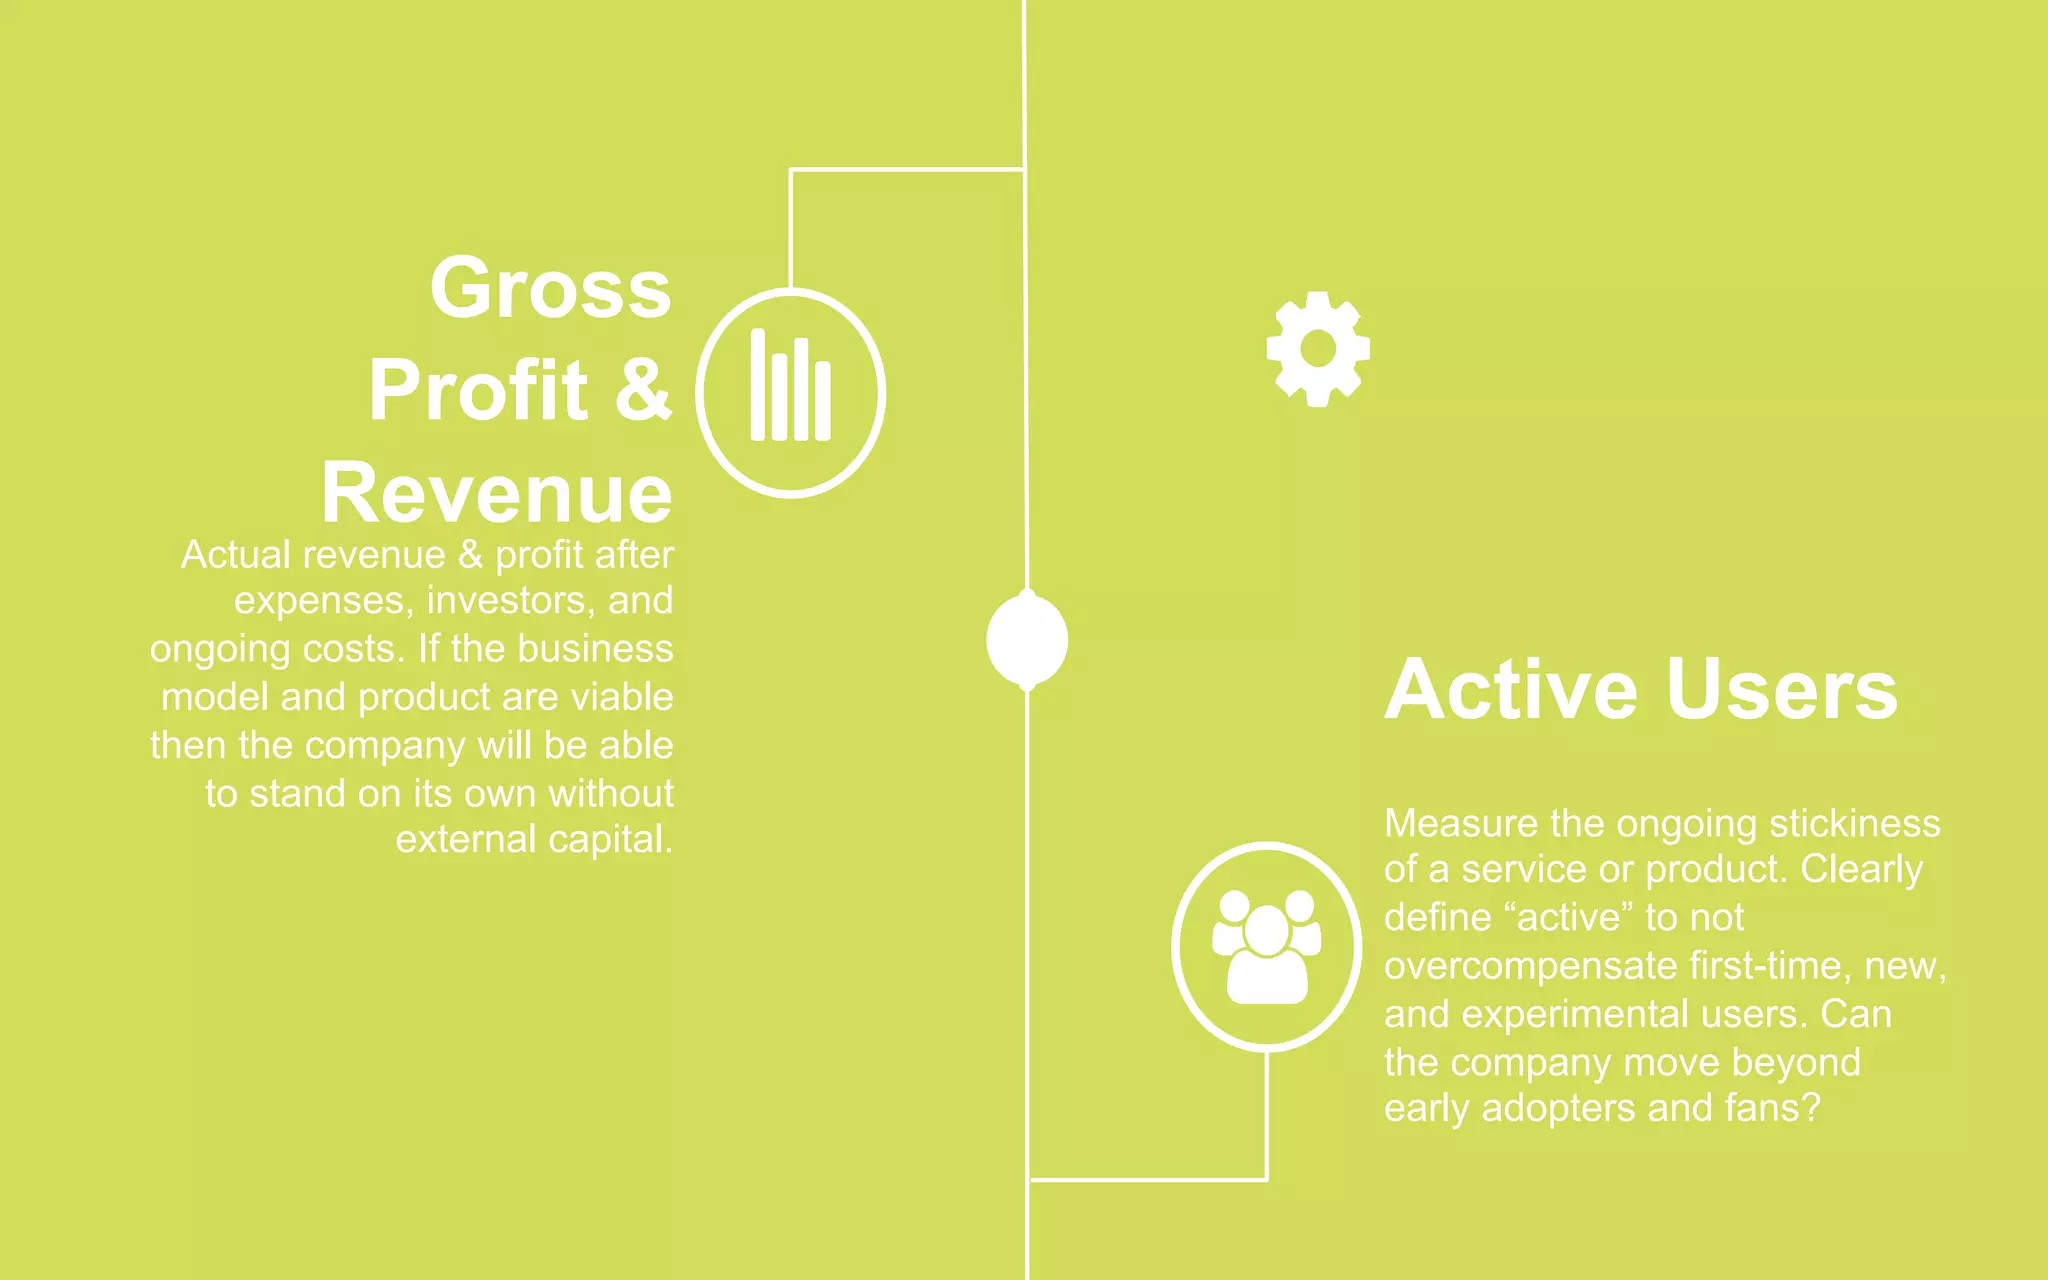
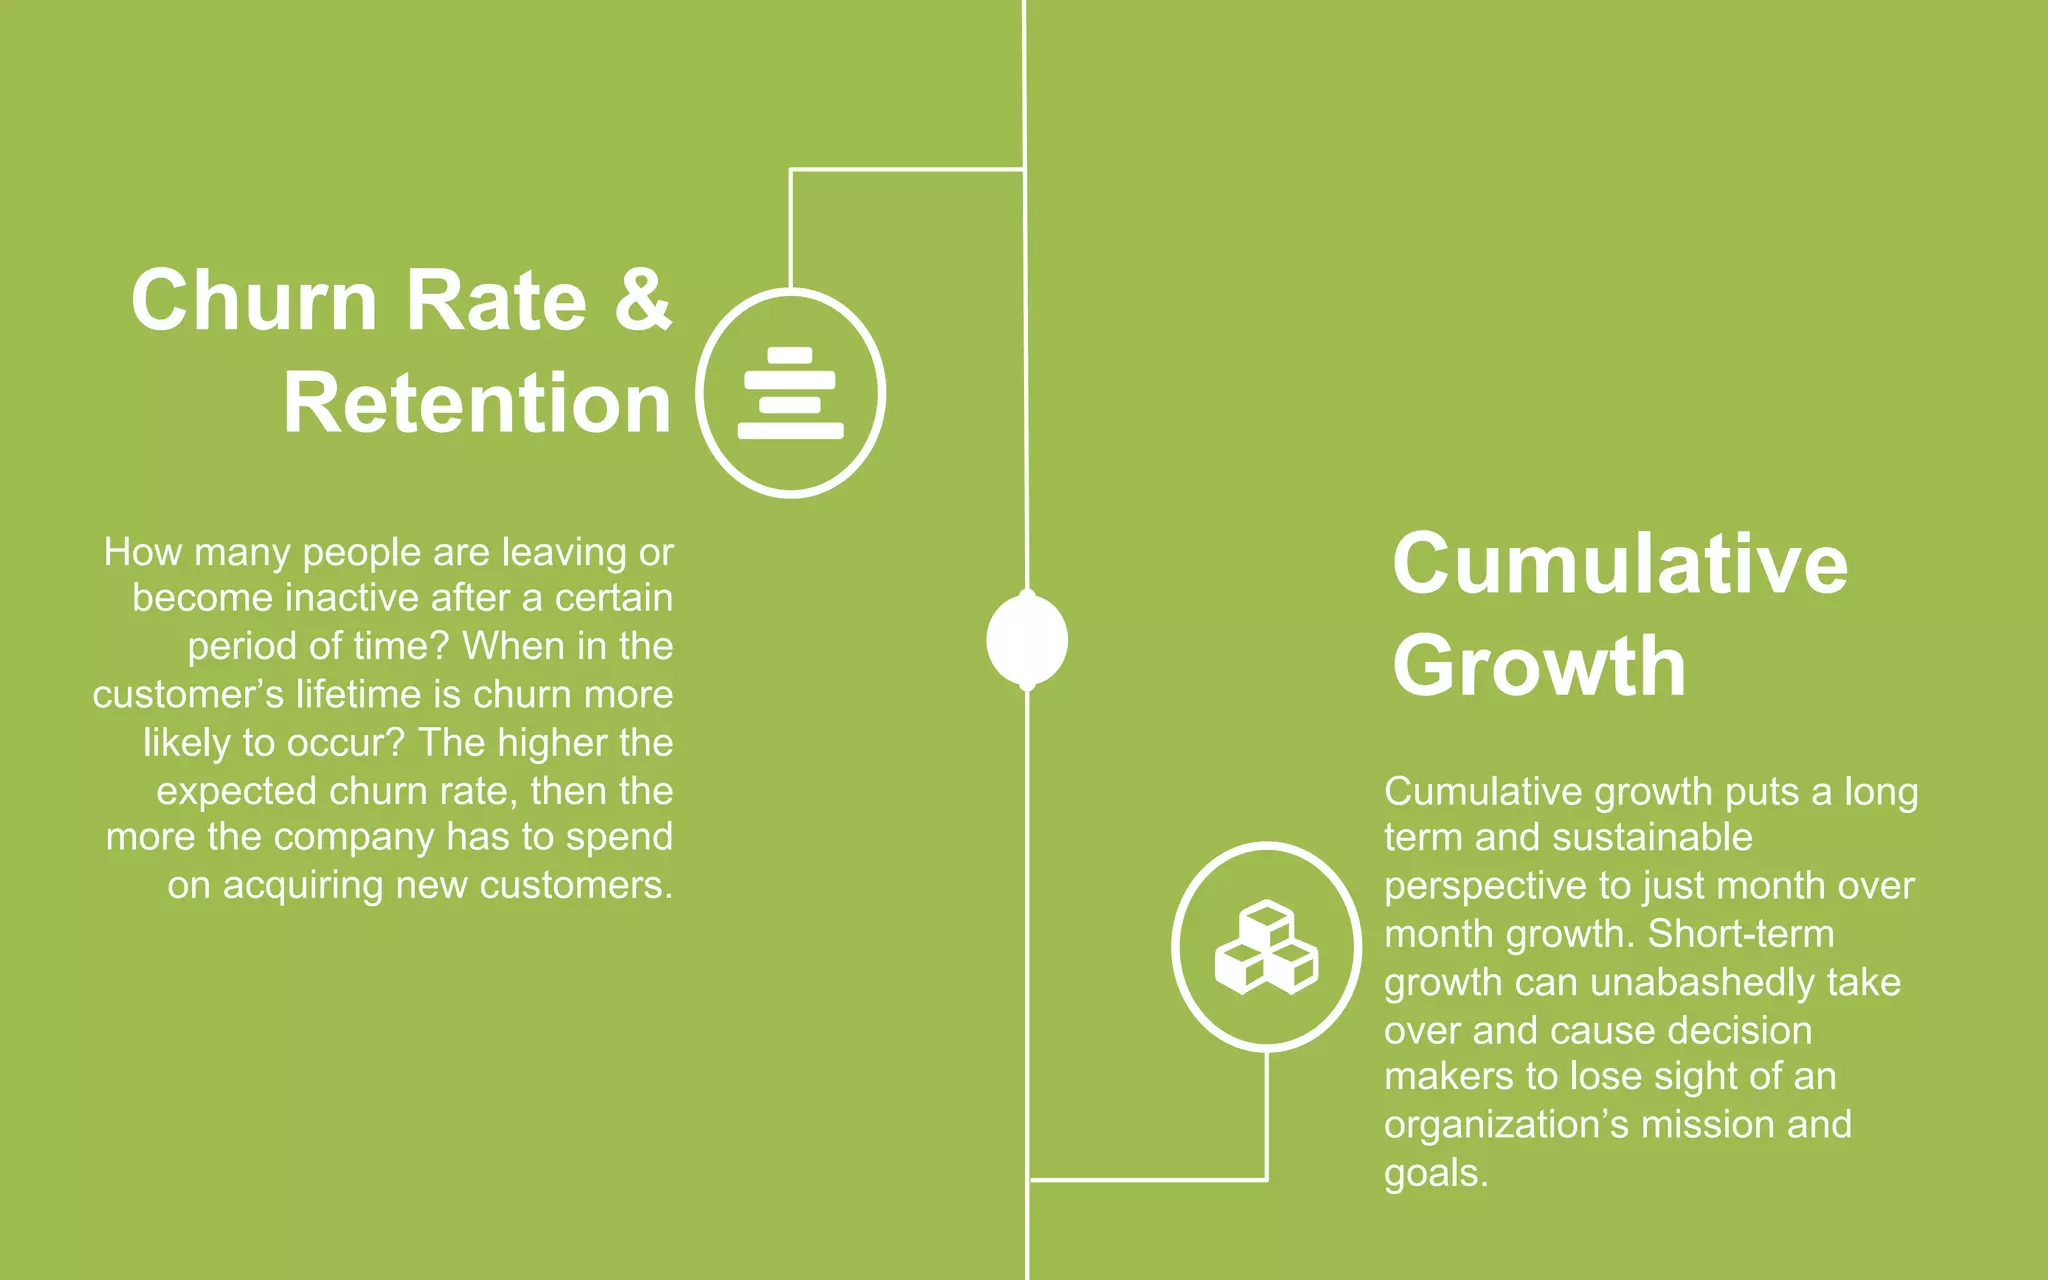
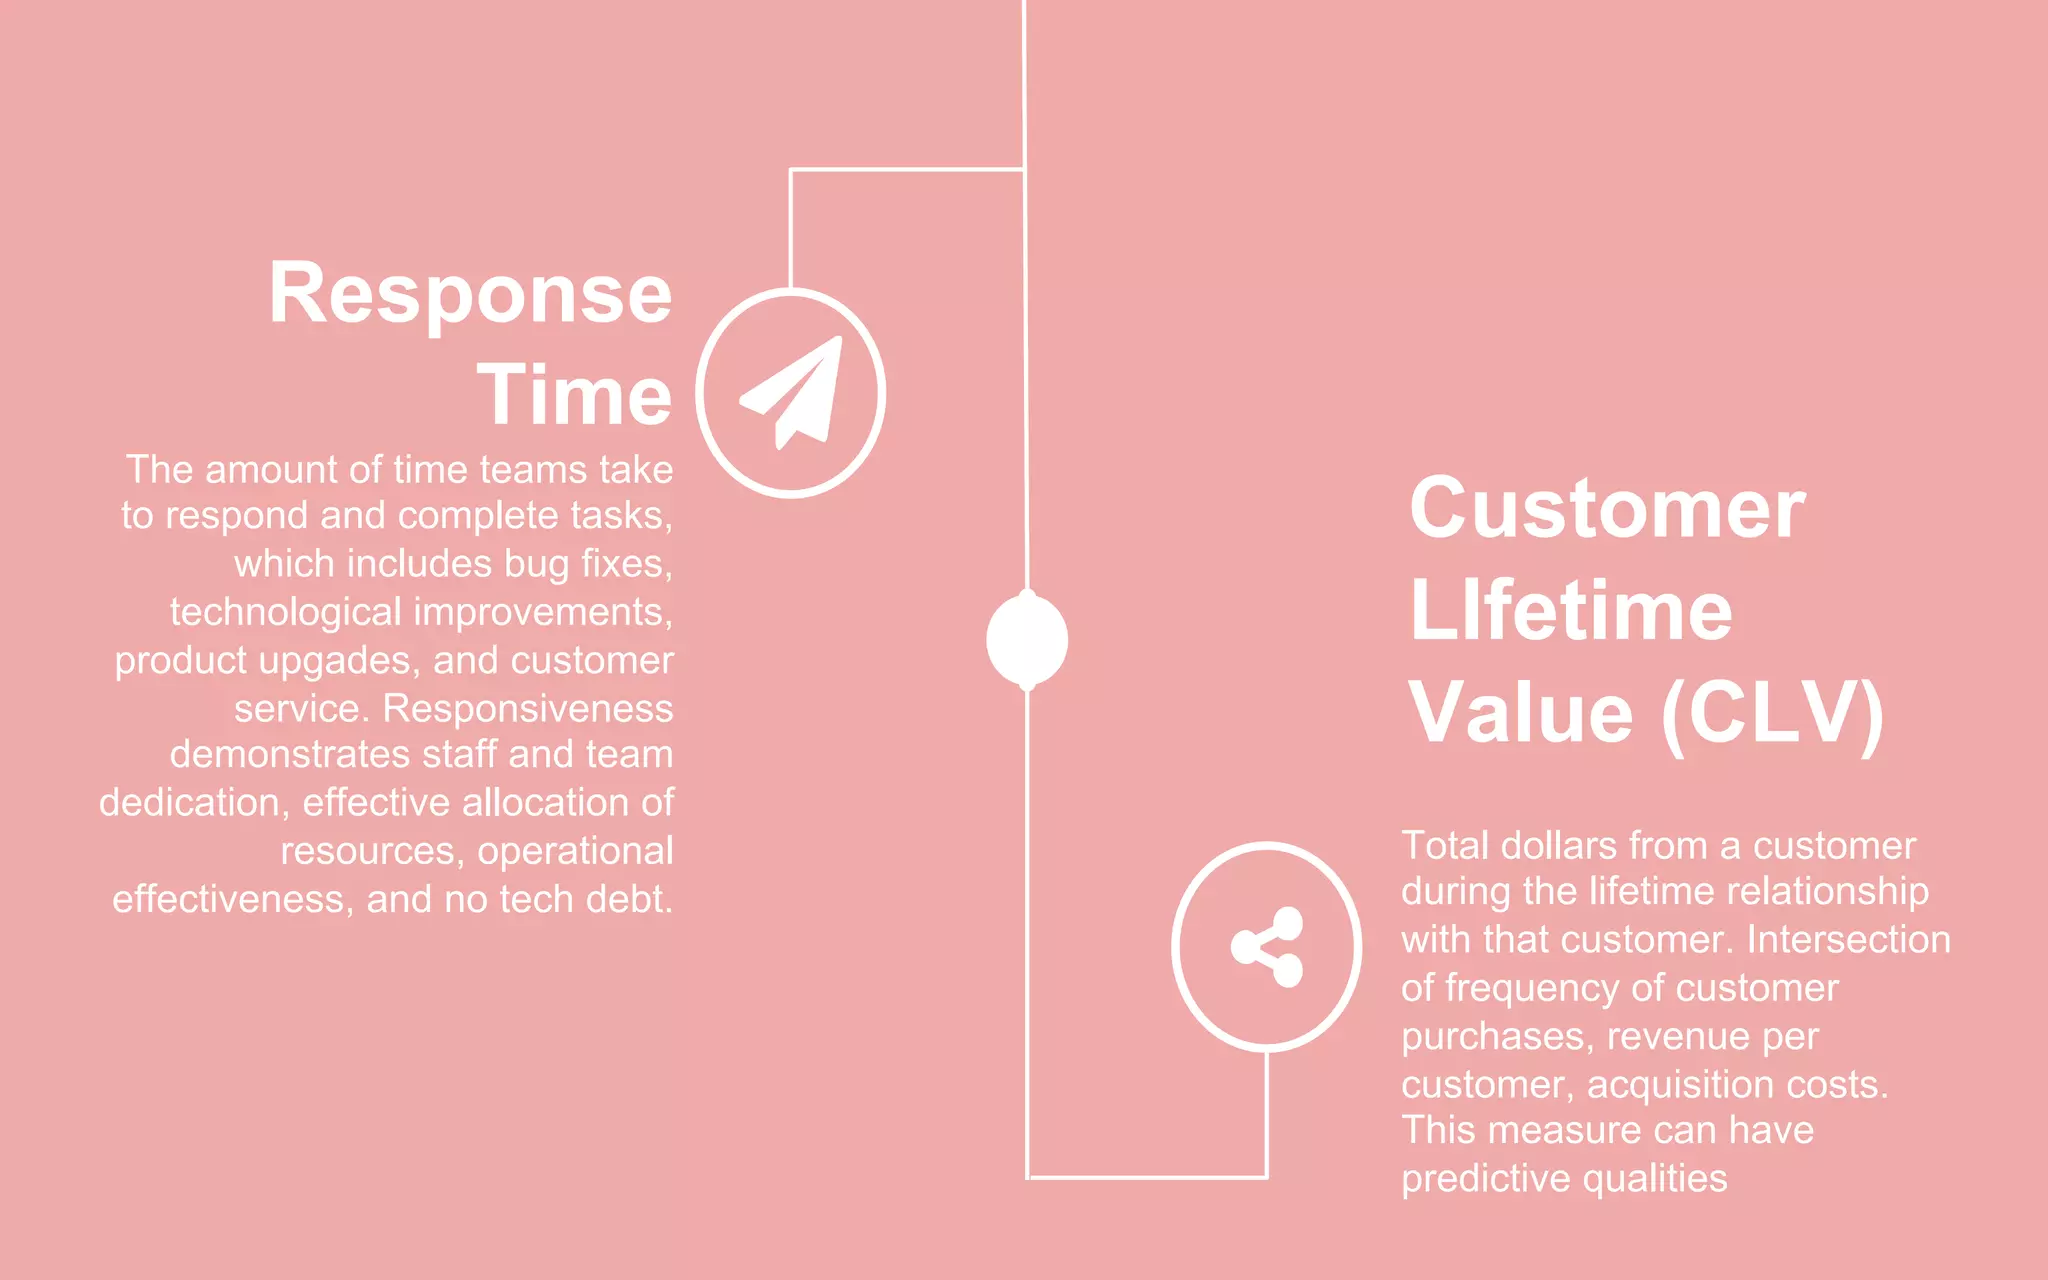
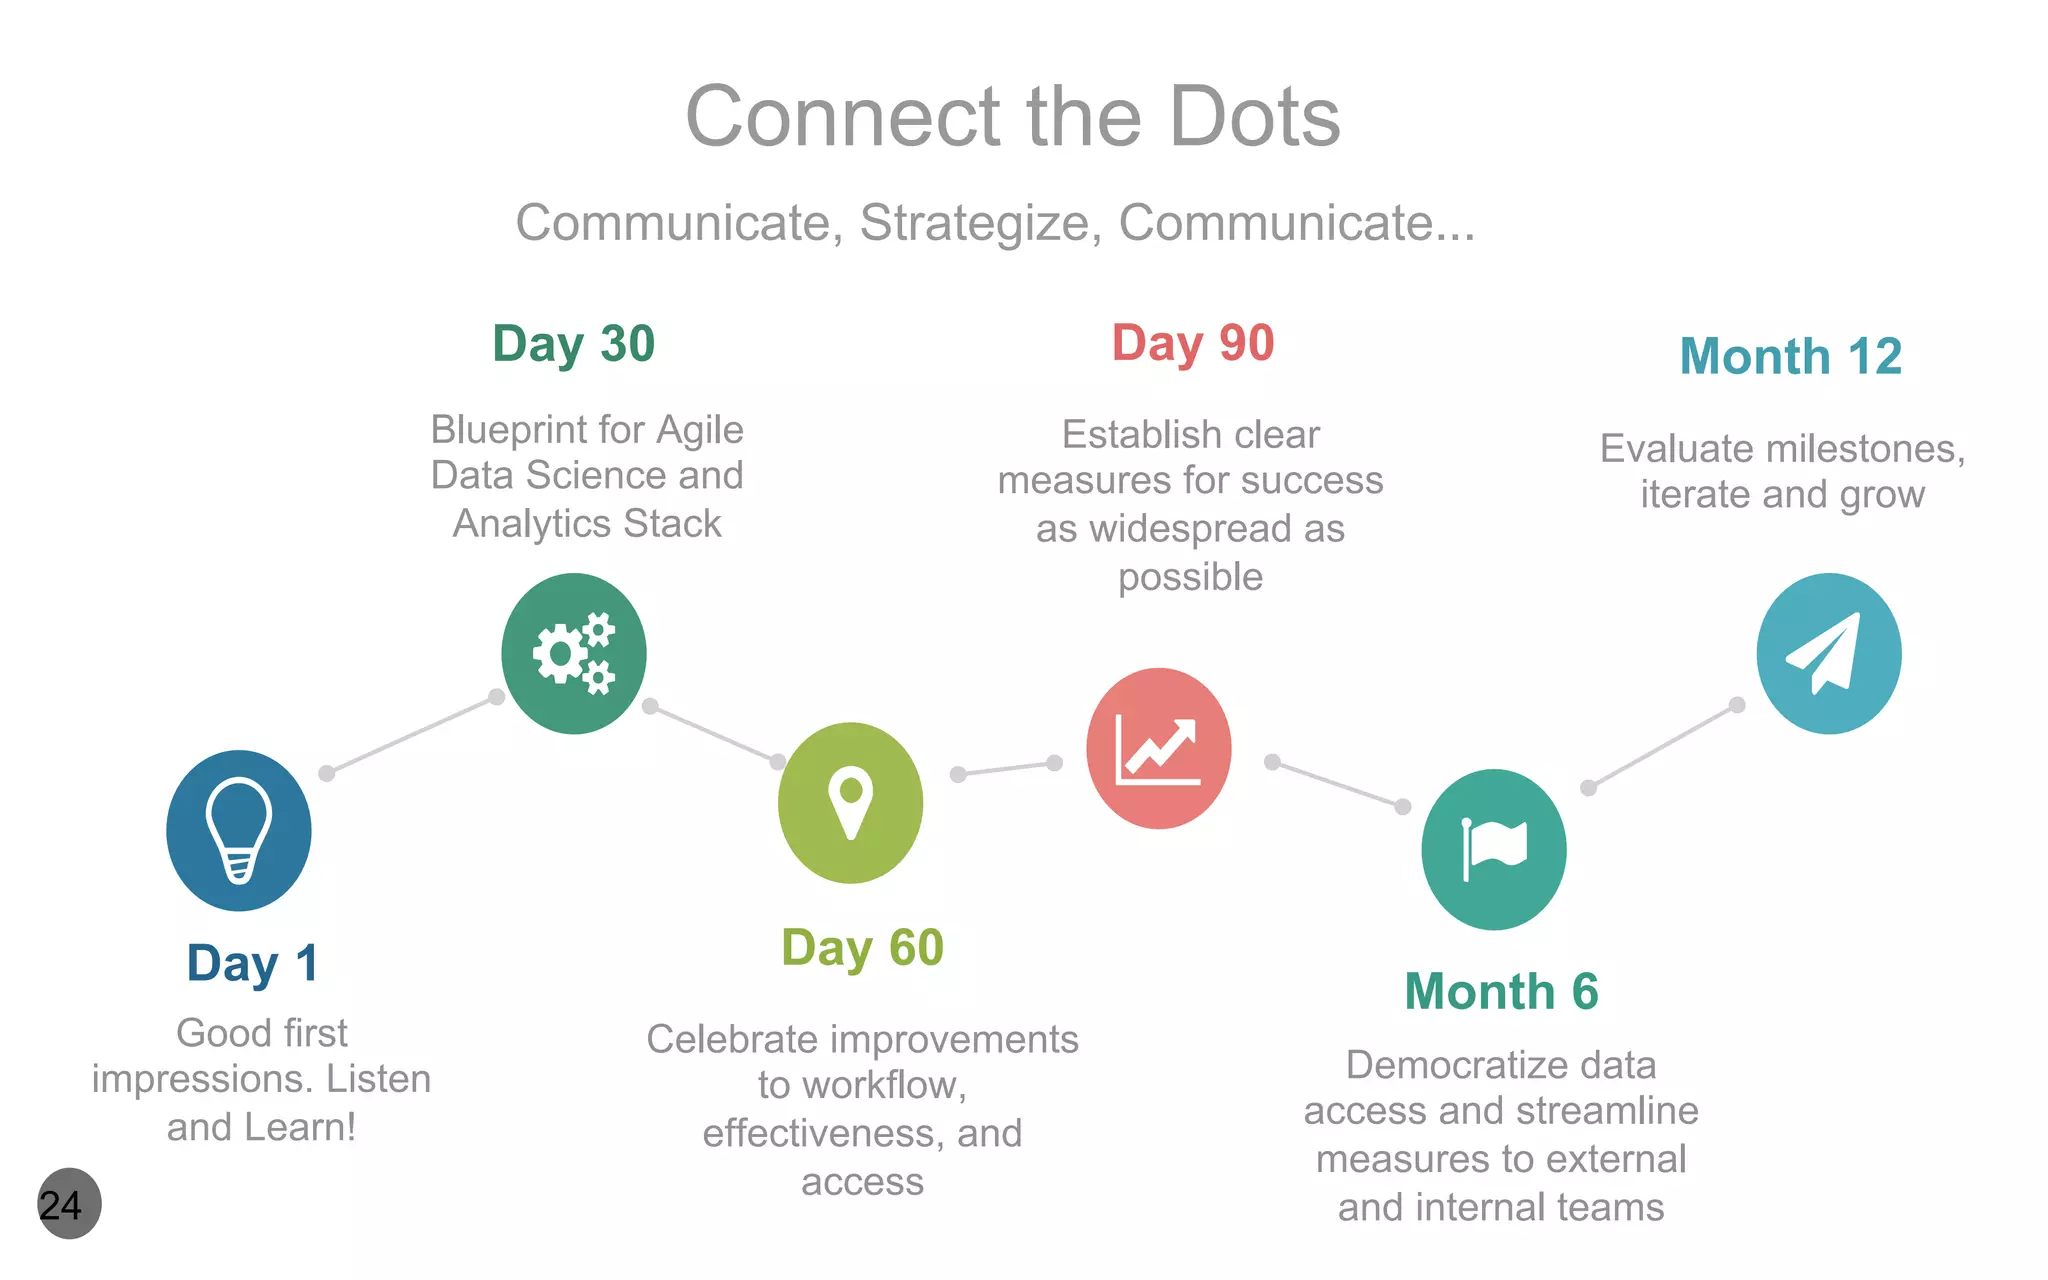
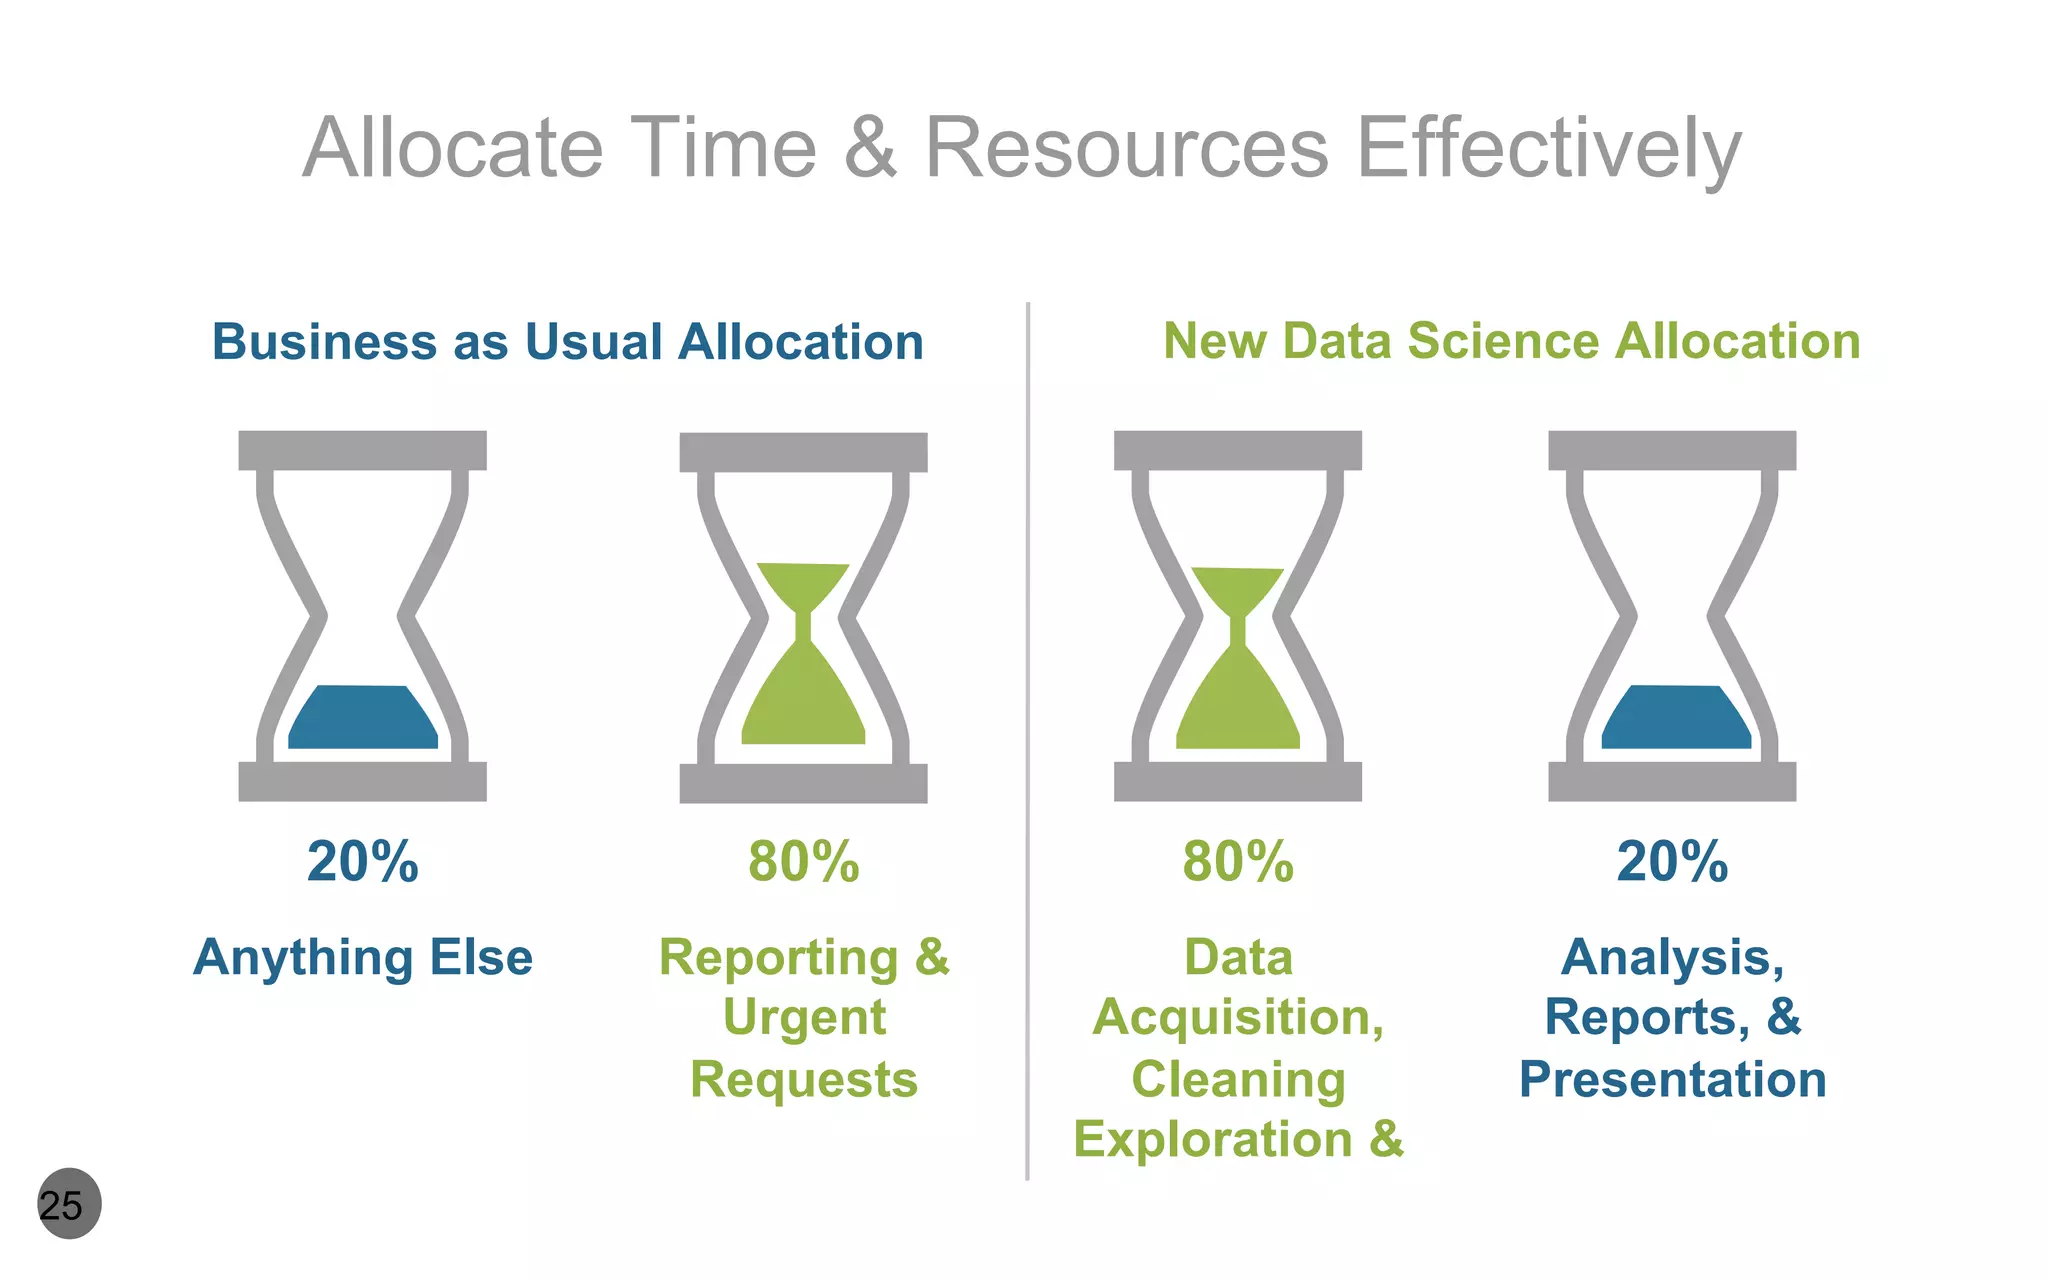
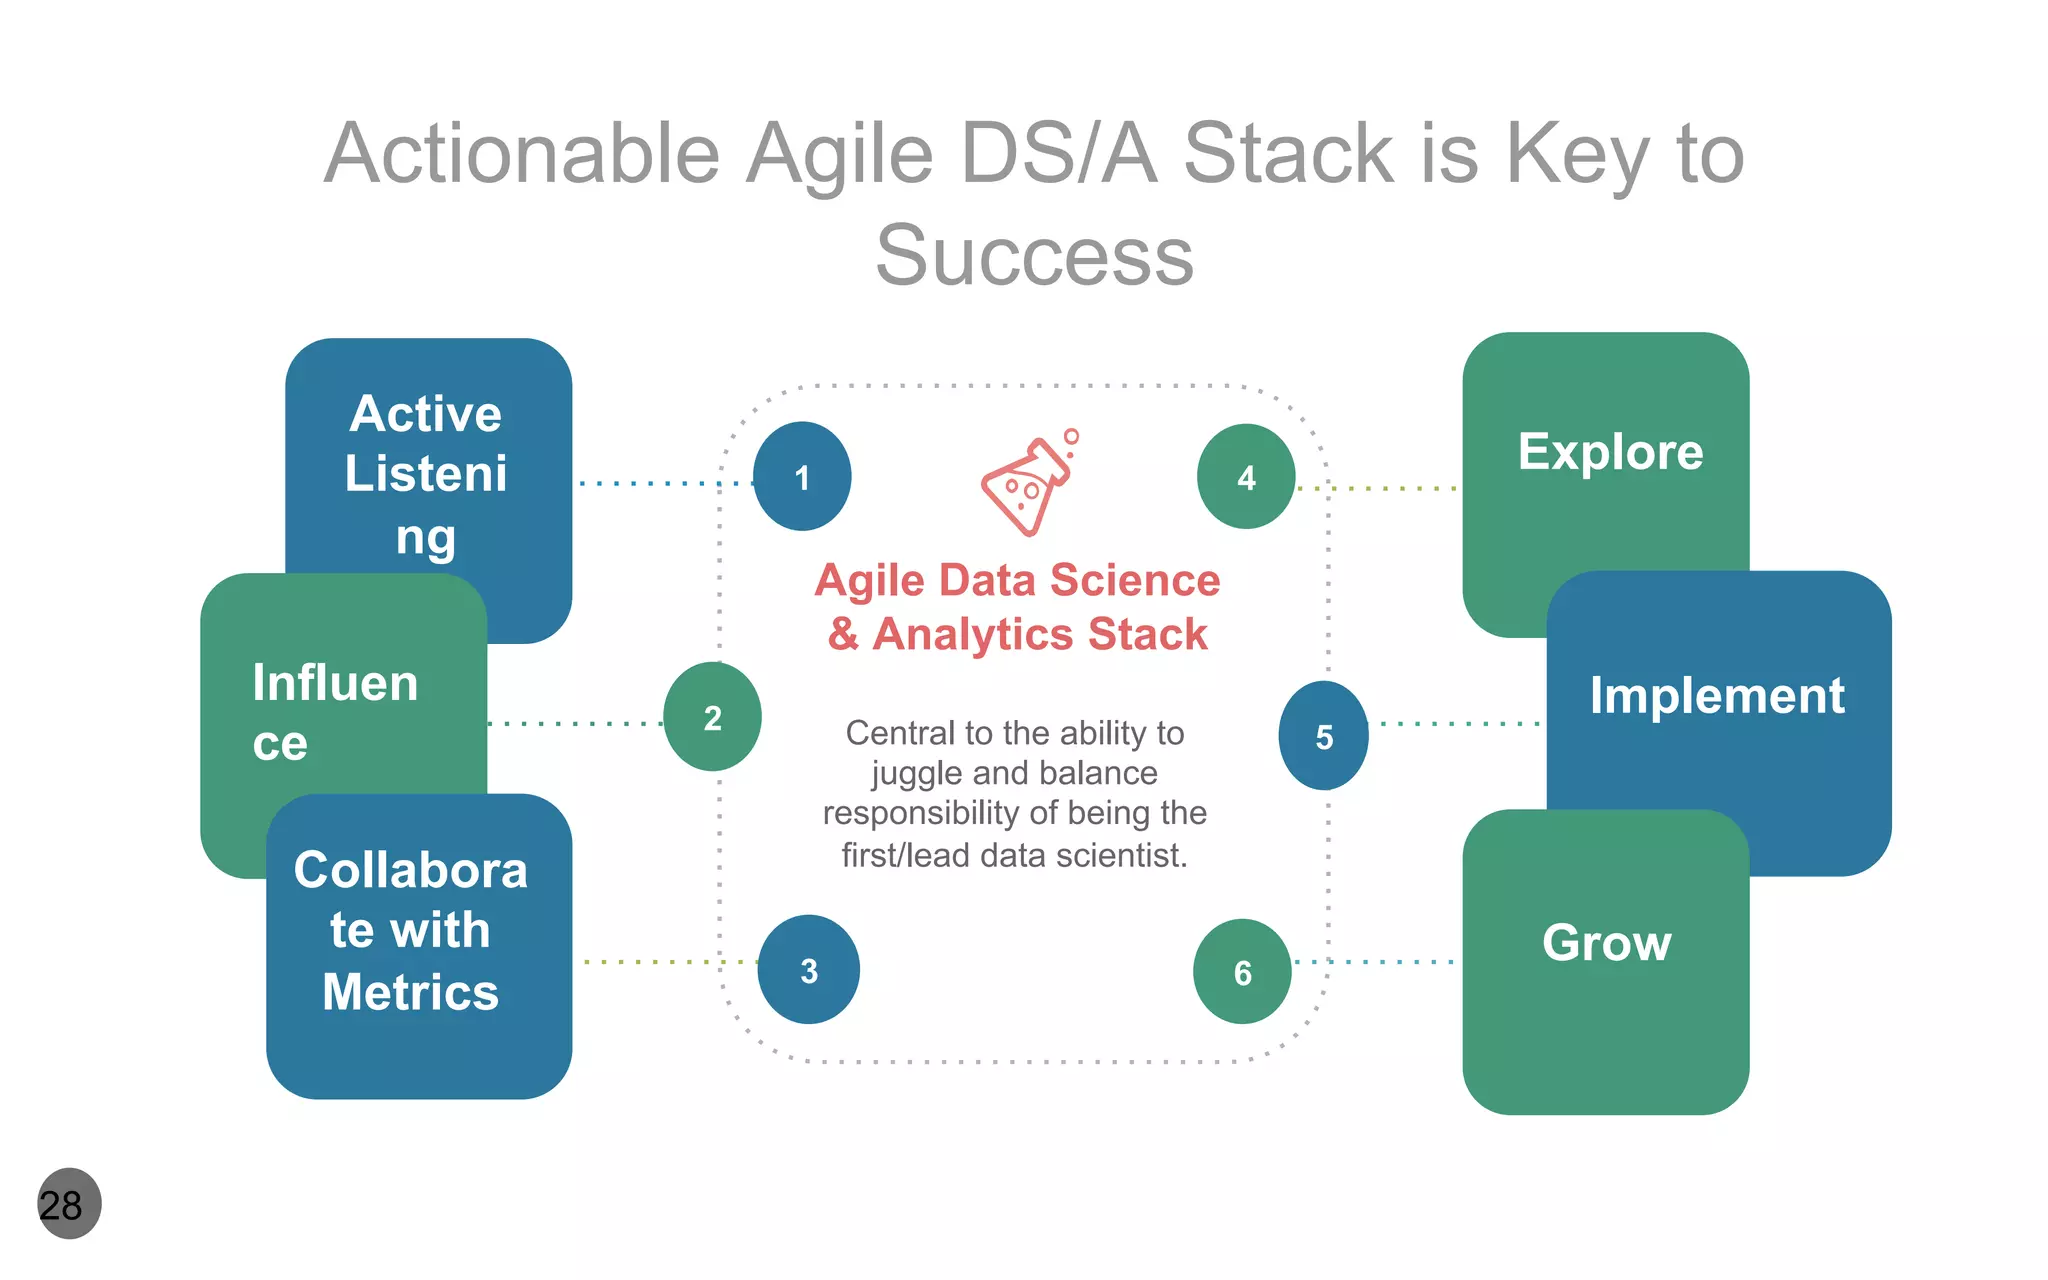
Backstage to Data Driven
Culture
Success with an
Agile Data Science
Stack
Big Data LA Day 2016
Pauline Chow
2
So, You are the First Data
Scientist…?
WORLDWIDE BUSINESS BUSINESS TO GO CREATIVE SOLUTIONS
What my Friends Think I Do What my Mom Thinks I Do What Society Thinks I Do
What my Boss Think I Do What I Think I Do What I Actually Do
Misconceptions about Data Scientists
3
4
So, You are the First or Lead Data
Scientist…?
Open Source
& New Tools
Profits Steady ,
Adding Products
Report to VP
Marketing
Non Technical
Culture
First Data
Scientist
What does the organization do
best? How does it relate to
data and technology?
What is the business
core competencies?
What are existing tools,
processes, and code? Do you
have a budget for new tools and
resources?
What Tools are
Available ?
This is both a team members
and expectations related
question.
Where is your Team?
What is the mood of the
organization? How are they
solving problems? Why are they
adding DS/A into the
organization?
What is the State of
the Organization?
Who are the stakeholders?
How is data able to contribute
to their goals and
expectations?
Who has the
Influence On the
Roadmap?
Context for Presentation
Case Study: Startup in Digital Media
5
Effectively
Implement
Solutions
Maximize
Impact &
Commun-
ication
Set a Blueprint that
promotes flexibility,
iteration, and
scalability. It facilities
agile-oriented
mindsets for data
practices and it crucial
for implementation.
Build a Roadmap
from Blueprint to
shape data practices
and implement goals
from stakeholders,
company, as well as
strong DS/A
foundations.
Develop key
qualitative and
quantitative
milestones.
Communicate
consistently and
frequently to the
organization.
Influence
Expectations
Influence from both
angles, yours and
stakeholders
expectations. Find
explicit and implicit
goals and bridge the
gaps that you find.
6
Key Drivers Integrating Data Culture
Create an
Agile Data
Science
Stack
Non-technical focused
Actively
Listen
Implement
Explore Collaborate
Influence Grow
Guiding Verbs for “First” Data Scientist
7
In no particular order
ACTIVE LISTENING:
What Are you Trying to Hear?
Explicit Goals & Expectations
Structured, straight-forward, logical, and safe
inquiries
Document, share, and openly discuss with team
members and stakeholders.
Jungwoo Hong @ Unsplash
Implicit Goals & Expectations
Thom @ Unsplash
IMPLEMENT:
HOW TO APPROACH YOUR
BLUEPRINT FOR DATA
DRIVEN-INFORMED
CULTURE?
Architecture
First
Process
First
12
STACK AGILE APPROACHES
Anthony Delanoix @ Unsplash Jeff Sheldon @ Unsplash
Blueprint approach from infrastructure perspective
AGILE BY ARCHITECTURE
13
Customize as the team grows
SaaS & PaaS Integration
14
IDENTIFY
BUILD SYS &
MODELS
- Select Appropriate Models
- Build Models and Pipelines
for Scalability
- Evaluate and refine Models
ACQUIRE
DATA
- Identify the “right” source
- Import data and set up
remote / local storage
- Determine tools to work
with selected sources
CREATE PROBLEM
STATEMENT
- Identify business, data,
product objectives
- Brainstorm potential
solutions
- Create questions and
identify people/stakeholders
to help
PARSE & MINE DATA
- Determine distribution of
data and necessary
transformations
- Format, clean, splice, etc
- Create new derived data
PRESENT RESULTS
- Summarize Findings
- Add Storytelling aspects
- Identify next questions
and additional analysis
- For teams and
stakeholders
15
AGILE BY PROCESS
Blueprint approach from workflow perspective
ACQUIRE PARSE & MINE PRESENTBUILD DEPLOY
IDENTIFY
BUILD SYS &
MODELS + DEPLOY
Leverage platforms that document
models, pipelines, and feature
iterations. Collaboration is a plus.
-  Sklearn pipelines
-  DS/ML platforms: Yhat,
domino labs, anaconda
ACQUIRE DATA
Curate data from existing sources that
is cleaned, reliable, and automated,
where ETL can be skipped
-  Segement.io
-  Zapier
-  CrowdFlower
-  Open Data
CREATE PROBLEM
STATEMENT
Keep most attributes of
this section in-house and
within your team
PARSE & MINE DATA
For the data that cannot be
automated or acquired
cleanly, sklearn pipelines or
open source Luigi
(Spotify) or airflow
(AirBNB) can mitigate this
process.
PRESENT RESULTS
Adopt platforms that allow for
iterations and data mining/
parsing process to feed into
reports and presentations
-  Ipython Jupyter
Notebooks
-  Dashboards: Looker,
RJMetrics, Tableau
16
SaaS & PaaS Integration
Customize as the Process Increases in Complexity
ACQUIRE PARSE & MINE PRESENTBUILD DEPLOY
COLLABORATE:
What Metrics to Emphasize for
Teamwork?
Burn Rate
Most companies do not widely
broadcast but transparency can put
decisions into perspective for the
organization. Time and urgency can
also be of the essence.
Customer
Acquisition
Cost (CAC)
Illustrates market competitiveness
with your products, services, and
market saturation. Social media ad
platforms can make up a large portion
of these costs.
Gross
Profit &
Revenue
Actual revenue & profit after
expenses, investors, and
ongoing costs. If the business
model and product are viable
then the company will be able
to stand on its own without
external capital.
Active Users
Measure the ongoing stickiness
of a service or product. Clearly
define “active” to not
overcompensate first-time, new,
and experimental users. Can
the company move beyond
early adopters and fans?
Churn Rate &
Retention
How many people are leaving or
become inactive after a certain
period of time? When in the
customer’s lifetime is churn more
likely to occur? The higher the
expected churn rate, then the
more the company has to spend
on acquiring new customers.
Cumulative
Growth
Cumulative growth puts a long
term and sustainable
perspective to just month over
month growth. Short-term
growth can unabashedly take
over and cause decision
makers to lose sight of an
organization’s mission and
goals.
Response
Time
The amount of time teams take
to respond and complete tasks,
which includes bug fixes,
technological improvements,
product upgades, and customer
service. Responsiveness
demonstrates staff and team
dedication, effective allocation of
resources, operational
effectiveness, and no tech debt.
Customer
LIfetime
Value (CLV)
Total dollars from a customer
during the lifetime relationship
with that customer. Intersection
of frequency of customer
purchases, revenue per
customer, acquisition costs.
This measure can have
predictive qualities
INFLUENCE
How to align and connect
goals and expectations?
"Leadership is the art of giving people
a platform for spreading ideas that
work."
-Seth Godin
23
Evaluate milestones,
iterate and grow
Month 12
Blueprint for Agile
Data Science and
Analytics Stack
Day 30
Establish clear
measures for success
as widespread as
possible
Day 90
Good first
impressions. Listen
and Learn!
Day 1
Celebrate improvements
to workflow,
effectiveness, and
access
Day 60
Democratize data
access and streamline
measures to external
and internal teams
Month 6
Communicate, Strategize, Communicate...
Connect the Dots
24
Anything Else Reporting &
Urgent
Requests
Data
Acquisition,
Cleaning
Exploration &
Analysis,
Reports, &
Presentation
20% 80% 80% 20%
25
Allocate Time & Resources Effectively
Business as Usual Allocation New Data Science Allocation
GROW YOUR TEAM
When to increase the ability and
capabilities of your team?
Technical Project
Manager
Data Scientist
Data Engineer
Data Engineer
Analyst
Researcher
Team Members
6
1
2
5Central to the ability to
juggle and balance
responsibility of being the
first/lead data scientist.
Agile Data Science
& Analytics Stack
3
4
Active
Listeni
ng
Influen
ce
Collabora
te with
Metrics
Explore
Implement
Grow
Actionable Agile DS/A Stack is Key to
Success
28
@DataThinker
WhenThereIsData.com
pauline.chow@gmail.com

Success Through an Actionable Data Science Stack

  • 1.
    Backstage to DataDriven Culture Success with an Agile Data Science Stack Big Data LA Day 2016 Pauline Chow
  • 2.
    2 So, You arethe First Data Scientist…?
  • 3.
    WORLDWIDE BUSINESS BUSINESSTO GO CREATIVE SOLUTIONS WORLDWIDE BUSINESS BUSINESS TO GO CREATIVE SOLUTIONS What my Friends Think I Do What my Mom Thinks I Do What Society Thinks I Do What my Boss Think I Do What I Think I Do What I Actually Do Misconceptions about Data Scientists 3
  • 4.
    4 So, You arethe First or Lead Data Scientist…?
  • 5.
    Open Source & NewTools Profits Steady , Adding Products Report to VP Marketing Non Technical Culture First Data Scientist What does the organization do best? How does it relate to data and technology? What is the business core competencies? What are existing tools, processes, and code? Do you have a budget for new tools and resources? What Tools are Available ? This is both a team members and expectations related question. Where is your Team? What is the mood of the organization? How are they solving problems? Why are they adding DS/A into the organization? What is the State of the Organization? Who are the stakeholders? How is data able to contribute to their goals and expectations? Who has the Influence On the Roadmap? Context for Presentation Case Study: Startup in Digital Media 5
  • 6.
    Effectively Implement Solutions Maximize Impact & Commun- ication Set aBlueprint that promotes flexibility, iteration, and scalability. It facilities agile-oriented mindsets for data practices and it crucial for implementation. Build a Roadmap from Blueprint to shape data practices and implement goals from stakeholders, company, as well as strong DS/A foundations. Develop key qualitative and quantitative milestones. Communicate consistently and frequently to the organization. Influence Expectations Influence from both angles, yours and stakeholders expectations. Find explicit and implicit goals and bridge the gaps that you find. 6 Key Drivers Integrating Data Culture Create an Agile Data Science Stack Non-technical focused
  • 7.
    Actively Listen Implement Explore Collaborate Influence Grow GuidingVerbs for “First” Data Scientist 7 In no particular order
  • 8.
    ACTIVE LISTENING: What Areyou Trying to Hear?
  • 9.
    Explicit Goals &Expectations Structured, straight-forward, logical, and safe inquiries Document, share, and openly discuss with team members and stakeholders. Jungwoo Hong @ Unsplash
  • 10.
    Implicit Goals &Expectations Thom @ Unsplash
  • 11.
    IMPLEMENT: HOW TO APPROACHYOUR BLUEPRINT FOR DATA DRIVEN-INFORMED CULTURE?
  • 12.
    Architecture First Process First 12 STACK AGILE APPROACHES AnthonyDelanoix @ Unsplash Jeff Sheldon @ Unsplash
  • 13.
    Blueprint approach frominfrastructure perspective AGILE BY ARCHITECTURE 13
  • 14.
    Customize as theteam grows SaaS & PaaS Integration 14
  • 15.
    IDENTIFY BUILD SYS & MODELS -Select Appropriate Models - Build Models and Pipelines for Scalability - Evaluate and refine Models ACQUIRE DATA - Identify the “right” source - Import data and set up remote / local storage - Determine tools to work with selected sources CREATE PROBLEM STATEMENT - Identify business, data, product objectives - Brainstorm potential solutions - Create questions and identify people/stakeholders to help PARSE & MINE DATA - Determine distribution of data and necessary transformations - Format, clean, splice, etc - Create new derived data PRESENT RESULTS - Summarize Findings - Add Storytelling aspects - Identify next questions and additional analysis - For teams and stakeholders 15 AGILE BY PROCESS Blueprint approach from workflow perspective ACQUIRE PARSE & MINE PRESENTBUILD DEPLOY
  • 16.
    IDENTIFY BUILD SYS & MODELS+ DEPLOY Leverage platforms that document models, pipelines, and feature iterations. Collaboration is a plus. -  Sklearn pipelines -  DS/ML platforms: Yhat, domino labs, anaconda ACQUIRE DATA Curate data from existing sources that is cleaned, reliable, and automated, where ETL can be skipped -  Segement.io -  Zapier -  CrowdFlower -  Open Data CREATE PROBLEM STATEMENT Keep most attributes of this section in-house and within your team PARSE & MINE DATA For the data that cannot be automated or acquired cleanly, sklearn pipelines or open source Luigi (Spotify) or airflow (AirBNB) can mitigate this process. PRESENT RESULTS Adopt platforms that allow for iterations and data mining/ parsing process to feed into reports and presentations -  Ipython Jupyter Notebooks -  Dashboards: Looker, RJMetrics, Tableau 16 SaaS & PaaS Integration Customize as the Process Increases in Complexity ACQUIRE PARSE & MINE PRESENTBUILD DEPLOY
  • 17.
    COLLABORATE: What Metrics toEmphasize for Teamwork?
  • 18.
    Burn Rate Most companiesdo not widely broadcast but transparency can put decisions into perspective for the organization. Time and urgency can also be of the essence. Customer Acquisition Cost (CAC) Illustrates market competitiveness with your products, services, and market saturation. Social media ad platforms can make up a large portion of these costs.
  • 19.
    Gross Profit & Revenue Actual revenue& profit after expenses, investors, and ongoing costs. If the business model and product are viable then the company will be able to stand on its own without external capital. Active Users Measure the ongoing stickiness of a service or product. Clearly define “active” to not overcompensate first-time, new, and experimental users. Can the company move beyond early adopters and fans?
  • 20.
    Churn Rate & Retention Howmany people are leaving or become inactive after a certain period of time? When in the customer’s lifetime is churn more likely to occur? The higher the expected churn rate, then the more the company has to spend on acquiring new customers. Cumulative Growth Cumulative growth puts a long term and sustainable perspective to just month over month growth. Short-term growth can unabashedly take over and cause decision makers to lose sight of an organization’s mission and goals.
  • 21.
    Response Time The amount oftime teams take to respond and complete tasks, which includes bug fixes, technological improvements, product upgades, and customer service. Responsiveness demonstrates staff and team dedication, effective allocation of resources, operational effectiveness, and no tech debt. Customer LIfetime Value (CLV) Total dollars from a customer during the lifetime relationship with that customer. Intersection of frequency of customer purchases, revenue per customer, acquisition costs. This measure can have predictive qualities
  • 22.
    INFLUENCE How to alignand connect goals and expectations?
  • 23.
    "Leadership is theart of giving people a platform for spreading ideas that work." -Seth Godin 23
  • 24.
    Evaluate milestones, iterate andgrow Month 12 Blueprint for Agile Data Science and Analytics Stack Day 30 Establish clear measures for success as widespread as possible Day 90 Good first impressions. Listen and Learn! Day 1 Celebrate improvements to workflow, effectiveness, and access Day 60 Democratize data access and streamline measures to external and internal teams Month 6 Communicate, Strategize, Communicate... Connect the Dots 24
  • 25.
    Anything Else Reporting& Urgent Requests Data Acquisition, Cleaning Exploration & Analysis, Reports, & Presentation 20% 80% 80% 20% 25 Allocate Time & Resources Effectively Business as Usual Allocation New Data Science Allocation
  • 26.
    GROW YOUR TEAM Whento increase the ability and capabilities of your team?
  • 27.
    Technical Project Manager Data Scientist DataEngineer Data Engineer Analyst Researcher Team Members
  • 28.
    6 1 2 5Central to theability to juggle and balance responsibility of being the first/lead data scientist. Agile Data Science & Analytics Stack 3 4 Active Listeni ng Influen ce Collabora te with Metrics Explore Implement Grow Actionable Agile DS/A Stack is Key to Success 28
  • 29.