
Recommended
More Related Content
What's hot
What's hot (19)
Similar to 2019 Q3 Colliers St. Louis Industrial Market Report
Similar to 2019 Q3 Colliers St. Louis Industrial Market Report (20)
Recently uploaded
Recently uploaded (20)
2019 Q3 Colliers St. Louis Industrial Market Report
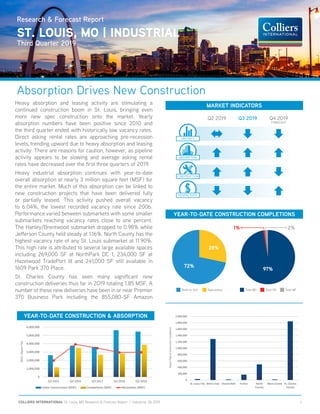
- 1. 1COLLIERS INTERNATIONAL St. Louis, MO Research & Forecast Report | Industrial 3Q 2019 Research & Forecast Report ST. LOUIS, MO | INDUSTRIAL Third Quarter 2019 Absorption Drives New Construction Heavy absorption and leasing activity are stimulating a continued construction boom in St. Louis, bringing even more new spec construction onto the market. Yearly absorption numbers have been positive since 2010 and the third quarter ended with historically low vacancy rates. Direct asking rental rates are approaching pre-recession levels, trending upward due to heavy absorption and leasing activity. There are reasons for caution, however, as pipeline activity appears to be slowing and average asking rental rates have decreased over the first three quarters of 2019. Heavy industrial absorption continues with year-to-date overall absorption at nearly 3 million square feet (MSF) for the entire market. Much of this absorption can be linked to new construction projects that have been delivered fully or partially leased. This activity pushed overall vacancy to 6.04%, the lowest recorded vacancy rate since 2006. Performance varied between submarkets with some smaller submarkets reaching vacancy rates close to one percent. The Hanley/Brentwood submarket dropped to 0.98% while Jefferson County held steady at 1.16%. North County has the highest vacancy rate of any St. Louis submarket at 11.90%. This high rate is attributed to several large available spaces including 269,000 SF at NorthPark DC 1, 234,000 SF at Hazelwood TradePort III and 241,000 SF still available in 1609 Park 370 Place. St. Charles County has seen many significant new construction deliveries thus far in 2019 totaling 1.85 MSF. A number of these new deliveries have been in or near Premier 370 Business Park including the 855,080-SF Amazon YEAR-TO-DATE CONSTRUCTION & ABSORPTION YEAR-TO-DATE CONSTRUCTION COMPLETIONS MARKET INDICATORS ABSORPTION RENTAL RATE CONSTRUCTION VACANCY Q2 2019 Q4 2019 FORECAST Q3 2019 Build-to-Suit Speculative 28% 72% Total WD Total OS Total MF 97% 1% 2%
- 2. 2COLLIERS INTERNATIONAL St. Louis, MO Research & Forecast Report | Industrial 3Q 2019 HISTORIC SALES & LEASING ACTIVITY fulfillment center, Duke Realty’s 375,000-SF Premier 1001 spec building and FedEx’s 490,000-SF distribution facility. The largest delivery in the entire St. Louis industrial market was TriStar’s delivery of the first 1-MSF distribution facility of World Wide Technology’s 2-MSF campus in Gateway Commerce Center East. As more speculative construction is delivered through the end of 2019 and into 2020, vacancy rates are expected to increase. Spec buildings make up 61% of current construction activity. Of this space, 89% is still available for lease. Absorption is expected to remain positive for the foreseeable future but at potentially slower rates. The St. Louis market has seen positive absorption every year since 2012 with some recent years over 4 MSF. The average asking rental rate is currently $4.29 per square foot (PSF) which, although higher than the five-year average of $4.19 PSF, is down from $4.86 in Q1 of this year. This could be due to the rate reductions by landlords competing with tax abatement and the introduction of several new 500,000 SF to 770,000 SF spec warehouses of in the Metro East with asking rates below $4.00 PSF. Although the market generally appears to be slowing, third quarter saw notable new deal activity in the 300,000-SF to 400,000-SF range. The economy still appears strong as we approach the end of 2019 but with some caution related to tariffs and a potential trade deal with China. According to the Federal Reserve, the St. Louis unemployment rate dropped to 3.3% in August from 3.6% earlier this year. The local rate is below the national unemployment rate of 3.7%. The U.S. Bureau of Labor Statistics reported that nonfarm employment grew 1.9% for the St. Louis region from August 2018 to August 2019. This growth rate is tied with Nashville and higher than Kansas City (1.8%), Chicago (1.0%), and the nation as a whole (1.4%). However, a slowdown in U.S. Gross Domestic Product (GDP) growth is expected per the monthly national economic forecast conducted by The Wall Street Journal. The forecasted rate for 2019 is 2.2% with economists predicting 1.7% growth for 2020 and 1.9% in 2021. The Federal Reserve Bank cut interest rates in both July and September of this year as a preemptive move to hold off a potential UNDER CONSTRUCTION BY BUILDING TYPE RECORD LEVELS UNDER CONSTRUCTION market downturn. An additional cut may be imminent. The Commerce Department reported that durable goods orders dropped by 1.1% in September after another large drop of 2.3% occurred in May. Market experts are cautious about the national economy in 2020, but continuing eCommerce and 3PL leasing activity across the U.S. will help buoy the St. Louis market into the coming new year. UNDER CONSTRUCTION BY SUBMARKET Build-to-Suit Speculative 60% 40% 5.4 MSF OF CONSTRUCTION IS EQUAL TO 3.65 Busch Stadiums St. Charles County Airport Earth City Westport St. Louis City Hanley Metro East North County Fenton 43.4% 18.6% 12.3% 8.6% 6.8% 4.6% 3.7% 0.3% 1.7%
- 3. 3COLLIERS INTERNATIONAL St. Louis, MO Research & Forecast Report | Industrial 3Q 2019 INDUSTRIAL MARKET BY SUBMARKET SUBMARKET NUMBER OF BUILDINGS EXISTING INVENTORY (SF) OVERALL VACANT SPACE (SF) OVERALL VACANCY RATE YTD NET ABSORPTION (SF) UNDER CONSTRUCTION (SF) YTD DELIVERIES QUOTED RATES Airport 211 18,981,001 1,067,193 5.62% (105,552) 1,014,019 0 $4.23 Earth City 289 24,476,622 2,132,999 8.71% (191,165) 250,000 0 $4.30 Westport 419 16,859,614 1,038,099 6.16% 240,870 92,450 0 $5.00 St. Louis City 859 62,315,733 2,695,936 4.33% (52,385) 201,337 33,000 $4.35 Metro East 249 34,041,211 2,461,334 7.23% 1,495,692 2,371,992 1,292,410 $4.08 Mid-County 464 19,836,017 823,281 4.15% (48,883) 0 0 $5.09 Chesterfield 129 4,572,323 297,182 6.50% (66,698) 0 20,000 $7.41 Hanley/Brentwood 188 5,458,269 53,751 0.98% 117,939 15,958 0 $7.73 Fenton 314 14,449,710 1,192,496 8.25% 143,884 372,750 169,000 $7.08 South County 195 8,180,583 390,136 4.77% (62,083) 0 0 $8.20 North County 67 6,280,968 747,301 11.90% 655,937 472,552 493,000 $4.39 West County 37 2,101,957 45,713 2.17% 17,360 0 20,000 $9.00 Jefferson County 69 2,516,667 29,186 1.16% 0 0 0 $2.25 St. Charles County 439 23,826,516 1,758,440 7.38% 841,168 673,200 1,847,851 $4.88 MARKET TOTALS 3,929 243,897,191 14,733,047 6.04% 2,986,084 5,464,258 3,875,261 $4.29 Q3 2019 Submarket Snapshot SUBMARKET COMPARISONOVERALL VACANCY RATE & DIRECT AVG. RENTS INDUSTRIAL MARKET BY PROPERTY TYPE PROPERTY TYPE NUMBER OF BUILDINGS EXISTING INVENTORY (SF) OVERALL VACANT SPACE (SF) OVERALL VACANCY RATE YTD NET ABSORPTION (SF) UNDER CONSTRUCTION (SF) YTD DELIVERIES QUOTED RATES Warehouse/Distribution (WD) 211 18,981,001 1,067,193 5.62% (105,552) 1,014,019 0 $4.23 Office Service (OS) 289 24,476,622 2,132,999 8.71% (191,165) 250,000 0 $4.30 Manufacturing (MF) 419 16,859,614 1,038,099 6.16% 240,870 92,450 0 $5.00
- 4. 4COLLIERS INTERNATIONAL St. Louis, MO Research & Forecast Report | Industrial 3Q 2019 NOTABLE SALES TRANSACTIONS PROPERTY SUBMARKET PRICE SF PRICE SF TYPE 21-27 Gateway Commerce Center Dr W Metro East $48,500,000 1,056,948 $45.89 WD 7100 Hazelwood Ave Airport $6,100,000 316,665 $19.26 WD 13333 Lakefront Dr Earth City $12,200,000 189,555 $64.36 OS 5531 Phantom Dr Airport $5,400,000 129,000 $41.86 WD 11100 Linpage Pl Mid-County $4,125,000 118,000 $34.96 WD NOTABLE LEASE TRANSACTIONS TENANT SUBMARKET PROPERTY RSF TYPE TRANSACTION World Wide Technology Metro East Gateway Commerce Center 1,000,000 WD New Lease World Wide Technology Metro East 3965 Lakeview Corporate Dr 540,000 WD Renewal* Medline Industries, Inc. Metro East 1659 Sauget Business Blvd 300,481 WD Renewal* Amcor Rigid Plastics Airport 5801 N Lindbergh Blvd 222,563 WD Renewal* Legacy Pharmaceuticals Earth City 13333 Lakefront Dr 189,555 WD New Lease *Renewals not included in leasing activity TOP UNDER CONSTRUCTION PROJECTS BUILDING NAME ADDRESS SUBMARKET TYPE CONSTRUCTION SF DELIVERY WWT Facility 2 Gateway Commerce Center Metro East WD BTS 1,000,000 Q4 2019 Medline BTS Premier 370 - Lot 38 St. Charles County WD BTS 811,300 2020 Exeter - Building A Gateway Commerce Center 1 100 Inner Park Dr Metro East WD Spec 674,752 Q4 2019 Gateway Tradeport-Building 1 5106 State Route 111 Metro East WD Spec 543,740 Q4 2019 Aviator 9 6201-6243 Aviator Dr Airport WD Spec 415,439 Q4 2019 TOP CONSTRUCTION COMPLETIONS BUILDING NAME ADDRESS SUBMARKET TYPE CONSTRUCTION SF SF AVAILABLE WWT Facility - 1 Gateway Commerce Center Metro East WD BTS 1,000,000 0 Premier 4000 Amazon Fulfillment 4000 Premier Pkwy St. Charles County WD BTS 855,080 0 Hazelwood Trade Port Building III 1601 Tradeport Dr North County WD Spec 493,000 368,000 FedEx Distribution Premier 370 10000 Elm Point Rd St. Charles County WD BTS 490,000 0 Premier 1001 1001 Premier Pkwy St. Charles County WD Spec 375,200 375,200
- 5. 5COLLIERS INTERNATIONAL St. Louis, MO Research & Forecast Report | Industrial 3Q 2019 270 170 70 64 44 55 55 255 270 AIRPORT NORTH COUNTY EARTH CITY MID COUNTY HANLEY FENTON SOUTH COUNTY Greater St. Louis Region SUBMARKET MAP N JEFFERSON COUNTY ST. CHARLES COUNTY ST. LOUIS CITY CHESTERFIELD WEST COUNTY WESTPORT METRO EAST
- 6. MARKET CONTACT C. Kevin Gallagher, CCIM, SIOR Executive Vice President and Managing Director | St. Louis REGIONAL AUTHORS Allison Gray | Senior Director of Marketing & Research Molly Mastin | Director of Marketing Colliers International | St. Louis 101 South Hanley Road, Suite 1400 St. Louis, MO | USA +1 314 863 4447 Copyright © 2019 Colliers International. The information contained herein has been obtained from sources deemed reliable. While every reasonable effort has been made to ensure its accuracy, we cannot guarantee it. No responsibility is assumed for any inaccuracies. Readers are encouraged to consult their professional advisors prior to acting on any of the material contained in this report. About Colliers International Colliers International Group Inc. (NASDAQ and TSX: CIGI) is an industry leading global real estate services company with 15,000 skilled professionals operating in 68 countries. With an enterprising culture and significant employee ownership, Colliers professionals provide a full range of services to real estate occupiers, owners and investors worldwide. Services include strategic advice and execution for property sales, leasing and finance; global corporate solutions; property, facility and project management; workplace solutions; appraisal, valuation and tax consulting; customized research; and thought leadership consulting. Colliers professionals think differently, share great ideas and offer thoughtful and innovative advice that help clients accelerate their success. Colliers has been ranked among the top 100 global outsourcing firms by the International Association of Outsourcing Professionals’ for 12 consecutive years, more than any other real estate services firm. colliers.com/stlouis $2.7 billion in annual revenue 69 countries 2.0 billion square feet under management 15,400 professionals and staff 68,000 lease/sale transactions $116 billion total transaction volume