1. Economic and housing
market overview
House prices are up by 5.3% across the UK
according to Nationwide, slightly down from
the 5.6% increase seen in August.
RESIDENTIAL RESEARCH
UK RESIDENTIAL
MARKET UPDATE
“The need for more
housing in areas of high
demand across the UK
continues to be a hot
topic for policymakers
and housebuilders.”
Follow Gráinne at @ggilmorekf
For the latest news, views and analysis
on the world of prime property, visit
Global Briefing or @kfglobalbrief
GRÁINNE GILMORE
Head of UK Residential Research
LOCALISED MARKET
Average UK house price growth slipped a little in September, but the
annual rate of growth remains above 5%. However, this masks key
regional differences in market performance, with higher growth in and
around UK cities, including many London boroughs in zones 2-6.
Key facts
October 2016
The annual rise in UK house prices
was 5.3% in September, down
from 5.6% in August, according to
Nationwide data
Prices in prime central London are
down 2.1% on the year, after a 0.4%
decline in September
House price sentiment eased slightly
in October, but remains well above the
post-Brexit vote low
Prime Scottish house prices fell by
0.3% in Q3, taking the annual decline
to 0.2%
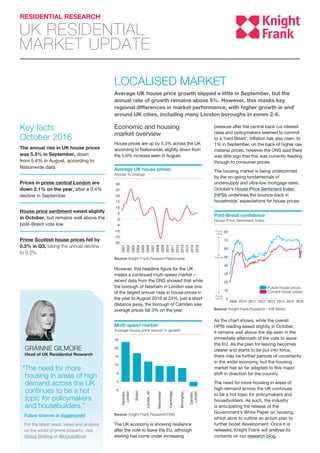
However, this headline figure for the UK
masks a continued multi-speed market –
recent data from the ONS showed that while
the borough of Newham in London saw one
of the largest annual rises in house prices in
the year to August 2016 at 23%, just a short
distance away, the borough of Camden saw
average prices fall 3% on the year.
Average UK house prices
Annual % change
Source: Knight Frank Research/Nationwide
Multi-speed market
Average house price annual % growth
Source: Knight Frank Research/ONS
-5
0
5
10
15
20
25
Camden,
London
Birminghan
Cambridge
Manchester
London,All
Bristol
Newham,
London
Post-Brexit confidence
House Price Sentiment Index
Source: Knight Frank Research / IHS Markit
0
10
20
30
40
50
60
70
80
20162015201420132012201120102009
Prices
rising
Prices
falling
No
change
Future house prices
Current house prices
-20
-15
-10
-5
0
5
10
15
20
25
30
2003
2002
2001
2004
2005
2006
2007
2009
2008
2010
2011
2013
2012
2014
2015
2016
The UK economy is showing resilience
after the vote to leave the EU, although
sterling has come under increasing
pressure after the central bank cut interest
rates and policymakers seemed to commit
to a ‘hard Brexit’. Inflation has also risen, to
1% in September, on the back of higher raw
material prices, however the ONS said there
was little sign that this was currently feeding
through to consumer prices.
The housing market is being underpinned
by the on-going fundamentals of
undersupply and ultra-low mortgage rates.
October’s House Price Sentiment Index
(HPSI) underlines the bounce-back in
households’ expectations for house prices.
As the chart shows, while the overall
HPSI reading eased slightly in October,
it remains well above the dip seen in the
immediate aftermath of the vote to leave
the EU. As the plan for leaving becomes
clearer and starts to be put into force,
there may be further periods of uncertainty
in the wider economy, but the housing
market has so far adapted to this major
shift in direction for the country.
The need for more housing in areas of
high demand across the UK continues
to be a hot topic for policymakers and
housebuilders. As such, the industry
is anticipating the release of the
Government’s White Paper on housing,
which aims to outline an action plan to
further boost development. Once it is
released, Knight Frank will analyse its
contents on our research blog.