
Recommended
Recommended
More Related Content
What's hot
What's hot (20)
Similar to Replacing Subway Service with On-Demand Ridesharing
Similar to Replacing Subway Service with On-Demand Ridesharing (20)
Recently uploaded
Recently uploaded (20)
Replacing Subway Service with On-Demand Ridesharing
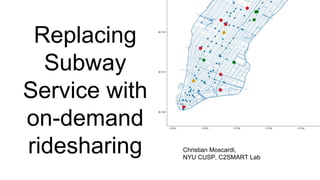
- 1. Replacing Subway Service with on-demand ridesharing Christian Moscardi, NYU CUSP, C2SMART Lab
- 2. Motivation ● Repairing the subway while running: $$$ ● BUT, NYC is the city that never sleeps Big question: to facilitate repairs, can we shut down Manhattan’s subway during times of minimal demand and replace it with alternative transportation?
- 3. Key Measures ● Number of vehicles required ● Passenger Level of Service (wait time, travel time) ● Ideal: repair cost vs. cost of running vehicles
- 4. How to answer? A simulation ● Set up a simulation of a station-to-station, on-demand ridesharing vehicle system ● Take subway trips and service them with an on-demand system ● Compare key metrics Parameters ● Number of vehicles ● Vehicle capacity ● Passenger tolerances to delay
- 5. Data ● Demands ○ NYMTC Travel Survey (O/D Only) ○ MTA Turnstile data (coming soon) ● Road Network ○ NYC LION Shapefile ○ MTA Subway Station Locations ○ Road Speeds: Taxi Data
- 6. Step 1: NYMTC Data ● Filter to trips between 12AM - 5AM ● Infer O/D stations from ‘TAZ’ + likely route ● 114 trips involving Manhattan between 12AM - 5AM ● Network setup much like Spiess & Florian (w/o hyperpaths) Origins
- 7. Step 1: NYMTC Data (final results) (Actual travel time) - (my guess) [in minutes]
- 8. Step 2: Road Network ● Need road network
- 9. Step 2: Road Network ● Need road speeds ● Road speeds: iterative algorithm, use taxi trips ● (Needs some work)
- 10. Step 3: Simulation ● How to efficiently run an on-demand ridesharing system? ● Alonso-Mora et. al.
- 11. Example What is the optimal route? travel(v, R) R=set of requests v= vehicle Returns: feasibility, minimum cost of having V pick up / drop off requests R Constraints: 1. max. waiting time 2. max. out-of-the-way time
- 12. Example
- 13. Example
- 14. Example 1 vehicle, 2 requests = ~16 1 vehicle, 4 requests = ~1776 possible combinations 1 vehicle, 10 requests = O(10^10) = O(110,000,000,000) possible combinations And what if we add more vehicles!?!?? We can scale with heuristic techniques
- 16. Example Result of applying step B) and generating RV graph. Red lines are request-vehicle pairings Blue line is request-request pairing
- 17. Example Result of applying step B) and generating RTV graph.
- 18. ILP Formulation
- 19. Example Result of solving ILP
- 20. (Immediate) Future Work ● Turn into a clock-based simulation ● Finish out some sort of demand generation (turnstile data? Poisson?) ● Implement ILP solver (currently using greedy heuristic)
- 21. Bigger-picture work Alonso-Mora et. al. ● Speed up travel(v, R) function - dynamic programming? ● Computation times still slow, parallelize / distribute? ● Simulation batches requests in 30s intervals -- need to determine user tolerance NYC Subway Shutdown ● What about weekends? Other off-peak hours? ● Can we better infer or estimate demand (hello, NYCT!) ● What are appropriate boundaries for train logistics?