Medical Instrument and Supply Manufacturing Industry Report
AGX-Final-Report
1. 1 University of Oregon Investment Group
Covering Analyst: Charles Pontrelli
cpp@uoregon.edu
February 12, 2016
IME
Investment Thesis
With oil prices falling significantly in the past couple months, investors have
overreacted. With a large cash balance and a huge contract backlog of $1.2
billion, Argan is poised for great top-line and bottom-line growth and is
currently at a steep discount
With technological advancements in fracking and an aging natural gas
production infrastructure, there is huge demand for the construction,
maintenance, and operation of natural gas-fired power plants, which Argan, Inc.
specializes in
Argan’s selective and opportunistic acquisitions, such as the recent acquisition of
The Roberts Company in December, will add synergies to its current operating
segments as well as diversify its revenue streams and assist in top-line growth
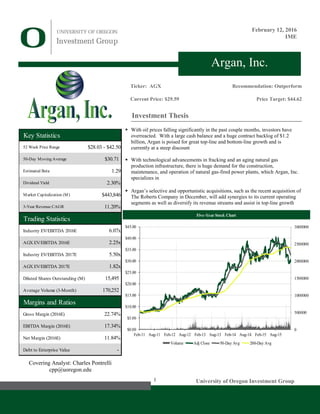
Argan, Inc.
Ticker: AGX
Current Price: $29.59
Recommendation: Outperform
Price Target: $44.62
Five-Year Stock Chart
0
500000
1000000
1500000
2000000
2500000
3000000
$0.00
$5.00
$10.00
$15.00
$20.00
$25.00
$30.00
$35.00
$40.00
$45.00
Feb-11 Aug-11 Feb-12 Aug-12 Feb-13 Aug-13 Feb-14 Aug-14 Feb-15 Aug-15
Volume Adj Close 50-Day Avg 200-Day Avg
Key Statistics
52 Week Price Range $28.03 - $42.50
50-Day Moving Average $30.71
Estimated Beta 1.29
Dividend Yield 2.30%
Market Capitalization (M) $443,846
3-Year Revenue CAGR 11.20%
Trading Statistics
Industry EV/EBITDA 2016E 6.07x
AGX EV/EBITDA 2016E 2.25x
Industry EV/EBITDA 2017E 5.50x
AGX EV/EBITDA 2017E 1.82x
Diluted Shares Outstanding (M) 15,495
Average Volume (3-Month) 170,252
Margins and Ratios
Gross Margin (2016E) 22.74%
EBITDA Margin (2016E) 17.34%
Net Margin (2016E) 11.84%
Debt to Enterprise Value -
2. UOIG 2
University of Oregon Investment Group February 12, 2016
Business Overview
Argan, Inc. (“Argan”) was incorporated in Delaware in May, 1961. They are a
holding company that conducts operations through its subsidiaries Gemma Power
Systems, LLC and affiliates (“GPS”) and Southern Maryland Cable, Inc. Argan
employees approximately 870 employees. They currently trade on the New York
Stock Exchange under the ticker AGX. Their headquarters are in Rockville, MD,
and conducts various projects across the United States. Management intends to
expand Argan through strategic acquisitions and/or investments in other
companies that work well with their current subsidiaries with great potential for
profitable growth.
Business Segments
Power Industry Services—98.32%
The majority of Argan’s business is composed of its Power Industry Services
segment. Gemma Power Systems, LLC (“GPS”) makes up almost all of this
segment, and is a full service engineering, procurement, and construction (“EPC”)
contractor which designs, builds, and commissions large-scale energy projects.
GPS has completed projects for more than 76 different facilities that represent
over 11,000 megawatts of power-generating capacity. The previously mentioned
projects include simple-cycle peaking plants, boiler plant construction and
renovation, and base-load combined-cycle facilities. Argan has also expanded into
the renewable energy industry by providing contracting services for biomass
plants, wind farms, and solar fields. Projects usually last between 1 and 3 years.
Additionally, Argan also procures materials for installation on their energy
projects.
In the past three years, Argan has completed six large energy projects, including
wind-energy farms in the states of Illinois and Pennsylvania, an 800 MW simple-
cycle quick start peaking power plant in Desert Hot Springs, CA, and two large
solar energy fields in Massachusetts including the installation of over 40,000
ground-mounted photovoltaic panels on capped and closed landfills. They also
completed a biomass-fired project for a 49.9 MW power plant in Woodville, TX
and currently have the contract for the operation and maintenance of the power
plant for 3 years.
Argan is currently working on two major projects in the Marcellus Shale region
of Pennsylvania and is building two natural gas-fired plants, each of which will
generate approximately 800 MW of power. Both are expected to complete around
the middle of 2016. Argan is also working on a natural gas-fired plant that began
in Late 2016 and is expected to finish in 2018. The plant will generate 1040 MW
of power on completion. They also have various other projects ongoing, many of
which will be finished in 2018. GPS receives revenues based on the percentage
completion of these projects, and then receives success fees when the projects are
completed. They currently have $1.2 billion of contract backlog.
Telecommunications Infrastructure Services—1.68%
Argan also conducts business through its subsidiary Southern Maryland Cable,
Inc. SMC provides technology wiring and utility construction solutions to
customers in the mid-Atlantic region. They perform structuring, cabling,
terminations, and connectivity for data, voice, video, and security networks inside
and outside plants.
Figure 3: Industry Market Share
Source: IBIS World
Figure 1: Argan Revenue Growth
Source: Argan 10-K and UOIG Spreads
0
200000
400000
600000
800000
1000000
1200000
2010A 2012A 2014A 2016E 2018E 2020E 2022E 2024E
Millions($)
Figure 2: US Industry Growth
Source: Yahoo Finance
Bechtel Group, Inc. 15.40%
URS Corp. 6.60%
Fluor Corp. 5.50%
Jacobs Engineering Group, Inc. 5.80%
Other 70.70%
3. UOIG 3
University of Oregon Investment Group February 12, 2016
For customers in need of services outside plants, SMC provides trench-less
directional boring and excavation for underground communication and power
networks, aerial cabling, services, and the installation of buried cables, electric
lines, and lighting systems. The range of inside plant and premises wiring services
include cable installation, AutoCAD design, equipment room buildout, data rack
installation, and cable system labelling and documentation.
In these telecommunications projects the customers supply most or all of the
materials required for the job while SMC provides the tools and personnel for the
services. Their contract backlog is currently valued at approximately $570,000.
Industry
Overview
Argan, Inc. operates in the Industrial, Materials, and Energy sector and the Heavy
Engineering Construction industry in the United States. Businesses in this
industry provide power plant construction, mass transit construction, marine
construction, tunnel construction, conservation and development construction,
harbor and port facilities construction, and other various development projects
and services. There are approximately 19,600 business in this industry. It is not
an enormous industry and competition is moderate. Currently, approximately a
quarter of the market share is held by 4 companies with Bechtel Group, Inc.
having 8.5%, URS Corp. holding 8.1%, Fluor Corp. 6.9%, and Jacobs
Engineering Group, Inc. with 5.8%. These companies operate both domestically
and internationally.
Competition is moderate in the industry due to much of the activity undertaken
by businesses being very complex. Competitive pressures are steady in the long
run due to many of the largest players in the space forming strategic alliances with
other businesses to complete projects on time within budgetary constraints,
procure the appropriate materials, and maintain a consistent share of the market.
Being able to complete a project within the time and budget constraints is of the
utmost importance, as contracts are usually awarded on the basis of a proven
reputation. Companies try to expand their market share through geographic
expansion, and acquisitions are very common in this space. Because most
competitors concentrate on very specialized segments, acquisitions are a very
common business strategy.
Market concentration in this industry is low due to how fragmented and
specialized the competition is. Many of these companies only have about 5
employees because they only focus on the repair and maintenance of facilities,
while larger operators secure the majority of construction projects. Many of these
larger operators use subcontractors to complete projects in different regions and
varying sizes. In the past couple years industry concentration has increased
slightly as the frequency of acquisitions has picked up in order to obtain market
share in high growth areas.
Capital intensity in the Heavy Engineering Construction industry is relatively low,
with it being estimated that for every $1.00 spent on wages $0.12 is spent on
capital investments. Even though the cost of purchases is high (industry average
is about 32% of revenue) most of these costs are largely related to materials,
components, and supplies that are used in the construction of facilities. Labor
costs make up on average 34.9% of revenue in the industry.
Figure 4: Industry Structure
Source: IBIS World
Figure 5: Sector vs. Industry Costs
Source: IBIS World
Life Cycle Stage Mature
Revenue Volatility Medium
Capital Intensity Low
Industry Assistance Low
Concentration Level Low
Regulation Level Heavy
Technology Change High
Barriers to Entry High
Industry Globalization Low
Competition Level Medium
22%
7%
3%
4%
32%
35%
35%
44%
2%
4%
1% 1%
4%
5%
0%
10%
20%
30%
40%
50%
60%
70%
80%
90%
100%
Sector Industry
Other Rent & Utilities Wages Purchases
Depreciation Marketing Profit
4. UOIG 4
University of Oregon Investment Group February 12, 2016
The Heavy Engineering Construction industry is subject to a high amount of
technological change because of the evolving technologies in downstream
markets, such as petrochemical manufacturing and electricity generation.
Downstream operators are constantly looking to maximize the efficiency of their
production through research and development, and much of these efficiency
improvements come from having newer infrastructure. To remain successful in
the industry, players try to obtain a good reputation for a specialized segment of
the market and try to stay up to date with the rapid technological changes.
However, many of these changes are generated in downstream markets and not
the Heavy Engineering Construction industry. Technological advancements in
the materials and the components used in construction projects make a large
impact on the ease of construction and how quick these projects can be completed,
so many companies try to stay as up to date as possible with the components they
use.
Regulation in this space is very high and is expected to stay high in the near future.
Regulation is very complex and involves many different levels of government.
There are many planning guidelines and construction standards that guide
construction activity. Compliance with state licensing, building codes, pollution
controls, and occupational health and safety regulations can add many costs, but
these are usually insignificant in the long run compared to litigation costs
associated with not following said regulations.
Macro factors
United States Economic Growth
US economic growth plays a huge factor in this industry as many businesses only
hire construction companies and undertake large projects when they know there
will be future growth in their operations. Many indicators, such as unemployment
rates, corporate profits, and private and public spending reflect economic health.
Currently, many people are uncertain on global economic health, but the US is
currently doing well and is expected to maintain its health, which is very good for
Argan who does almost all of their business in the US.
Natural Gas Demand
While Argan completes many different projects, they have a large exposure to
natural gas prices as many of their projects pertain to the construction and
procurement of natural gas-fired plants. Natural gas prices have declined in the
past year due to an overall fall in prices across the broad energy market. However,
more and more electric utilities are turning to natural gas for fuel, and exports
have picked up as investments in export terminals and shipping infrastructure has
increased. Additionally, many natural gas-fired plants are quite old, and many
need to be replaced or renovated, which provides ample opportunity for Argan.
Similarly, many coal-fired facilities are being retired because of their inefficiency
and are being replaced with new gas-fired facilities. This, coupled with new
standards under the Clean Power Plan which require reduced carbon emission
power generation options (which natural gas is one), we should see increased
demand going forward, which would be very beneficial for Argan.
US Electrical Energy Consumption
US electrical energy consumption plays an important role in Argan’s operations.
Electricity demand can drive a lot of the contract supply. When the recession
occurred, energy consumption retreated, but has been steadily climbing since
2012. Energy consumption is expected to steadily climb as the economy expands
and manufacturers and industrial producers increase the productivity of their
Figure 6: Industry Segmentation
Source: IBIS World
Figure 7: US Natural Gas Consumption
Source: US Energy Information Administration
25.3%
22.0%
16.4%
10.5%
10.4%
8.7%
6.7%
Mass Transit Construction Power Plant Construction
Marine Construction Other
Tunnel Construction Conservation and Development Construction
Harbor and Port Facilities Construction
1000000
1500000
2000000
2500000
3000000
Jan-01 Jan-03 Jan-05 Jan-07 Jan-09 Jan-11 Jan-13 Jan-15
U.S. Natural Gas Total Consumption (MMcf)
Figure 8: Business Concentration Heat Map
Source: IBIS World
5. UOIG 5
University of Oregon Investment Group February 12, 2016
operations. Additionally, households are starting to relax their restrictions on
energy usage as consumers become more confident in the overall economic
conditions in the US.
Competition
As mentioned above, competition in the Heavy Engineering Construction industry
is relatively moderate due to the fragmentation of the industry. Even though
Argan faces some large competitors, there is a large room for specialization in the
industry and many successful players depend on joint ventures to maintain market
share. Most of the competitors in Argan’s space are much larger than Argan.
However, Argan and its competitors can both provide services to the same client
due to the different services that are required by customers. If Argan is going to
be successful, they must win long term contracts that not only entail the
construction of the energy production plants, but also the operation and
maintenance of the plants when the construction projects are finished.
The companies that are able to succeed in the space either specialize in a certain
area of the industry, or are highly adaptable and scalable. These companies must
be able to complete their projects on time and within the budget constraints given
to them in the contracts, as reputation plays a huge part in successfully obtaining
contracts. They must also have highly skilled engineers and contractors in order
to plan the complex projects and make sure they are carried out efficiently.
Argan faces stiff competition in both of its segments. In its power industry
services segment, GPS faces competes with many large and well capitalized firms,
such as Bechtel Corp., Fluor Corp., SNC-Lavalin Group Inc., Chicago Bridge &
Iron Company N.V., Skanska AB, and Kiewet Corp. Argan is able to compete
with these companies because of its cost-effective choice for the design, build and
commissioning of natural gas-fired and alternative power energy systems. With
extensive experience, efficiency, and robust product offerings make it extremely
successful in the space, regardless of competition. The same can be said for
Argan’s telecommunications infrastructure segment, which has a proven track
record, great customer retention, and a highly-motivated workforce. Additionally,
Argan invests annually in new vehicles and equipment.
Strategic Positioning
Over the past couple years, Argan has been focusing on developing its power
industry services business through aggressively pursuing new contracts and
projects. Additionally, they have been acquiring smaller companies that either
provide synergies and fill gaps in its current business operations or provide strong
standalone investments. Additionally, they have been divesting from its business
operations that do not fall in line with their business plan (i.e. the divestiture from
its vitamin supplement segment a few years earlier). Argan has also been
diversifying its geographical locations through various acquisitions, such as its
recent acquisition of The Roberts Company which is based in Ireland and should
provide some synergies to its GPS subsidiary. Even with the large amount of
growth they have realized in the past few years, Argan has been able to keep its
margins high and reduce costs through its management’s effective leadership.
Argan has seen the shift in the energy markets to a greater utilization of natural
gas-fired power plants instead of coal, and is quickly demonstrating they can be a
competitive player in the space. However, they have also been expanding into
alternative energy plant construction with the recent push for a greater percentage
of energy come from renewable sources. Argan is uniquely positioned in the
Figure 9: Natural Gas Spot Prices
Source: US Energy Information Administration
Figure 10: Cost of Revenues
Source: Argan 10-K and UOIG Spreads
1
1.5
2
2.5
3
3.5
2/9/2015 4/9/2015 6/9/2015 8/9/2015 10/9/2015 12/9/2015
Natural Gas SpotPrices
$0.00
$100,000.00
$200,000.00
$300,000.00
$400,000.00
$500,000.00
$600,000.00
$700,000.00
$800,000.00
$900,000.00
2010A 2012A 2014A 2016E 2018E 2020E 2022E 2024E
Millions($)
Figure 11: Argan, Inc. Subsidiaries
Source: Argan Website
6. UOIG 6
University of Oregon Investment Group February 12, 2016
space as a specialist in the construction of natural gas-fired plants, is large enough
to outbid its competitors, and still small enough that it can achieve large growth.
Because of its proven track record of completing projects on time, staying at or
below its budget constraints, and providing high quality work, Argan has
established a large and very loyal customer base. Because of its relationship with
local governments, Argan is able to fully comply with all regulations without
delays. Additionally, its positive reputation has allowed it to secure many
contracts recently. Argan currently has $1.2 billion in backlog, which solidifies
many future revenue streams for Argan and proves its ability to win significant
contracts.
Business Growth Strategies
Being a holding company, one of Argan’s main growth strategies is acquiring
businesses that either add to their current business operations and help improve
the business or act as good standalone investments. For example, Argan’s recent
acquisition of The Roberts Company, which is a fabricator and construction
company, will diversify Argan’s current portfolio and add some synergies to its
GPS subsidiary. Management is committed to making strategic and opportunistic
acquisitions every couple years in order to progress the business. On top of that,
their enormous cash balance gives them the purchasing power of a large firm even
though they are a small-cap company.
Argan’s power industry services is poised for huge growth in the next couple years
with its expansion from the east coast into other areas of the US and its backlog
of $1.2 billion. This is perfect since two of Argan’s major projects will be
wrapping up in the next couple months. With new projects consisting of not only
natural gas-fired plants, but all so biomass-fired plants, Argan is diversifying its
operations and reducing risk. With the increase of energy consumption, aging
coal and nuclear power plants, and the movement to cleaner energy alternatives.
Argan has set itself up for success in the next few years to come.
Additionally, Argan’s expansion into other areas of the US, and the possibility
that they will expand their international work, would be extremely beneficial in
driving revenue growth. Argan will be able to capitalize on the long-term
relationships they have established throughout the industry to aggressively build
their backlog of projects in the US, as well as around the globe.
Management and Employee Relations
Rainer Bosselmann – Chairman and CEO
Rainer Bosselmann is the current Chairman and CEO of Argan, Inc. Mr.
Bosselmann has been the Chairman since May 2009 and CEO since October 2003.
Previously, Mr. Bosselmann served as the Chairman and CEO of Arguss
Communications, Inc. from 1996 through 2002. From 1991 through 1995, Mr.
Bosselmann was Vice Chairman and President of Jupiter National, Inc.
David Watson—CFO and Senior Vice President
David Watson is the current CFO and Senior Vice President of Argan, Inc. Mr.
Watson was most recently the CFO and Treasurer of Gladstone Investment
Corporation and Gladstone Capital Corporation. Mr. Watson received his MBA
from the University of Maryland Robert H. Smith School of Business and is also
Figure 12: Capital Expenditures Projections
Source: Argan 10-K and UOIG Spreads
Figure 13: EBITDA Projections
Source: Argan 10-K and UOIG Spreads
0
1000
2000
3000
4000
5000
6000
7000
8000
9000
10000
2010A 2012A 2014A 2016E 2018E 2020E 2022E 2024E
CapitalExpenditures
-50%
0%
50%
100%
150%
200%
0
20000
40000
60000
80000
100000
120000
140000
160000
2010A 2012A 2014A 2016E 2018E 2020E 2022E 2024E
EBITDA EBITDA Growth
0
100,000
200,000
300,000
400,000
500,000
600,000
700,000
800,000
900,000
2010A 2011A 2012A 2013A 2014A 2015A
Thousands($)
Figure 14: Historical Gemma Backlog
Source: Argan 10-K and UOIG Spreads
7. UOIG 7
University of Oregon Investment Group February 12, 2016
a CPA. He has held many senior financial positions within public and private
companies for over 15 years.
Management Guidance
Management does not provide any guidance on their future financial performance.
They do provide current contractual backlog at the end of each financial period.
Portfolio Strategy
Argan is not currently held in any of the University of Oregon Investment Group’s
portfolios. At the moment, the Tall Firs portfolio is extremely underweight in
IME and in-line for small cap. While we are in-line small cap, Tall Firs currently
holds a lot of cash, which would be best deployed by adding Argan to its holdings.
The DADCO portfolio currently has a considerable amount of energy exposure
with its holdings of MasTec, Alcoa, and SolarCity, but all of these have been
performing very poorly on the year. Argan’s large undervaluation would provide
the positive return the portfolio so desperately needs. Finally, the Alumni
portfolio only has two holdings, which make up 8% of the portfolio with the rest
being cash/tracker. Because the Alumni portfolio is looking for small-cap
companies that are highly undervalued, Argan would be a great addition with its
high future revenue growth, its huge cash balance, and the current undervaluation
from the overall market decline.
Recent News
Argan, Inc. Reports Third Quarter Results – Business Wire–
December 10, 2015
Argan recently reported third quarter results for their fiscal year ending January
31, 2016. They posted revenues of $114 million, implying a growth of 17% from
the previous quarter. Gross profit decreased $2.2 million to $26.3 million
compared to the second quarter mostly due to lower margins on the four new GPS
projects. Management also announced a backlog of $1.2 billion.
Catalysts
Upside
Increased demand for cleaner energy production plants will lead to a
greater number of plant construction projects, driving Argan’s revenue
growth and contractual backlog levels.
An aging United States energy production infrastructure will call for the
renovation or phasing out of current energy production plants, which will
lead to many new and consistent project opportunities for the company
and its subsidiaries.
Argan will be able to continue its market position in the Marcellus Shale
Region and receive large revenue streams through the maintenance and
operation of finished projects, as well as the construction and
procurement of new facilities.
As oil and natural gas prices begin to rebound in the first half of the year
Argan will see a huge improvement in their already strong revenue
streams.
Figure 15: AGX One-Year Stock Chart
Source: Yahoo Finance
Figure 17: MYRG One-Year Stock Chart
Source: Yahoo Finance
One-Year Stock Chart
0
100000
200000
300000
400000
500000
600000
700000
800000
900000
$0.00
$5.00
$10.00
$15.00
$20.00
$25.00
$30.00
$35.00
$40.00
$45.00
Feb-15 Apr-15 Jun-15 Aug-15 Oct-15 Dec-15 Feb-16
Volume Adj Close 50-Day Avg 200-Day Avg
One-Year Stock Chart
0
500000
1000000
1500000
2000000
2500000
3000000
$0.00
$5.00
$10.00
$15.00
$20.00
$25.00
$30.00
$35.00
Feb-15 Apr-15 Jun-15 Aug-15 Oct-15 Dec-15
Volume Adj Close 50-Day Avg 200-Day Avg
Figure 16: Competitive Landscape
Source: Argan Website
8. UOIG 8
University of Oregon Investment Group February 12, 2016
Downside
If Argan is unable to secure the necessary contracts in the near future to
sustain its revenue levels it could prove to be extremely detrimental.
With very few projects making up the majority of Argan’s revenue,
Argan is in a very sensitive predicament.
If oil and gas prices fall even more, energy production companies may
not be able to afford the capital expenditures to fund these construction
projects, lowering Argan’s overall revenues significantly.
Lower-than-expected electrical energy demand throughout the United
States may cause some deterioration of Argan’s future financial
performance.
Increases in environment and/or construction regulations could hinder
Argan’s business operations and slow project development.
If future acquisitions or investments do not prove to be successful this
could limit Argan’s future business growth, as this is one of their main
growth strategies.
Comparable Analysis—25%
In order to find Argan’s relative value a comparable universe was constructed in
order to capture Argan’s high growth and large margins. Various heavy
construction and general contracting companies within the industrial goods sector
were screened for size, growth rates, operating segments, and margins that were
similar to those of Argan. Ultimately, seven companies were chosen and
weighted using a weighted average of metric similarity and importance.
The metrics that were used in order to determine weightings included the
companies’ operating segments, revenue growth, gross margins, EBITDA
growth, EBITDA margins, EPS growth, net margin, capital structure, and market
cap. Because of Argan’s unique positioning with high revenue growth and wide
margins, multiple metrics had to be used to accurately find its valuation in the
space. Forward comparable analysis was done for the fiscal years ending January
31, 2016 and January 31, 2017, where 2016 comparables 75% and 2017
comparables were weighted 25%. Using the EV/EBITDA for each year, a final
price target of $45.99 was achieved, suggesting the market is currently
undervaluing the company by 55.43%.
MYR Group, Inc. (MYRG)—26.01% and 24.78%
“MYR Group Inc., incorporated on January 15, 1982, is a holding company. The
Company through its subsidiaries provides specialty electrical construction
services. The Company performs construction services in two business segments:
Transmission and Distribution (T&D), and Commercial and Industrial (C&I).
T&D segment provides solutions to customers in the electric utility industry and
the renewable energy industry. The Company also provides C&I electrical
contracting services to property owners and general contractors in the western
United States”—Google Finance
Qualitatively, MYR Group Inc. specializes in a different area of construction and
contracting. While Argan specializes in building energy production plants, MYR
Group focuses on the transmission and distribution of energy as well as
Figure 20: Argan Gross Margin Projection
Source: UOIG Spreads
Figure 19: AEGN One-Year Stock Chart
Source: Yahoo Finance
One-Year Stock Chart
0
500000
1000000
1500000
2000000
2500000
3000000
$0.00
$5.00
$10.00
$15.00
$20.00
$25.00
$30.00
$35.00
Feb-15 Apr-15 Jun-15 Aug-15 Oct-15 Dec-15
Volume Adj Close 50-Day Avg 200-Day Avg
0%
5%
10%
15%
20%
25%
30%
35%
40%
2010A 2012A 2014A 2016E 2018E 2020E 2022E 2024E
Multiple Implied Price Weight
EV/Revenue 2016E $29.54 0.00%
EV/Gross Profit 2016E $39.44 0.00%
EV/EBIT 2016E $67.91 0.00%
EV/EBITDA 2016E $46.54 100.00%
EV/(EBITDA-Capex) 2016E $59.57 0.00%
Market Cap/Net Income = P/E 2016E $38.49 0.00%
Price Target $46.54
Current Price 29.59
Undervalued 57.27%
Figure 18: 2016 Multiples
Source: UOIG Spreads
9. UOIG 9
University of Oregon Investment Group February 12, 2016
commercial and industrial wiring. However, it is a holding company like Argan
and operates through its multiple subsidiaries.
Quantitatively, MYRG is of a similar size, has zero debt like Argan, and has
similar 2016 revenue expected growth rates. However, it has lower margins than
Argan. Still, it is the most comparable to Argan by the metric weightings, so it
was weighted 26.01% and 24.78% for 2016 and 2017, respectively.
Aegion Corp. (AEGN)—17.78% and 17.49%
“Aegion Corporation (Aegion), incorporated on August 17, 2011, is engaged in
providing infrastructure protection and maintenance. The Company operates
through three segments: Infrastructure Solutions, Corrosion Protection and
Energy Services. The Company is engaged in providing technologies and services
to protect against the corrosion of industrial pipelines; rehabilitate and strengthen
water, wastewater, energy and mining piping systems and buildings, bridges,
tunnels and waterfront structures, and utilize integrated professional services in
engineering, procurement, construction, maintenance, and turnaround services for
a range of energy related industries. The Company's business activities include
manufacturing, distribution, maintenance, construction, installation, coating and
insulation, cathodic protection, research and development and licensing.”—
Google Finance
Qualitatively, Aegion has an energy services segment that is very similar to
Argan’s power industry services segment, but Aegion’s operations only make up
about a third of their total revenue. Additionally, it operates in the same industry
as Argan and primarily operates in the United States, much like Argan.
Quantitatively, Aegion has similar gross margins, similar market cap, as well as
an almost identical beta. However, it has a much higher D/E ratio than Argan,
and has lower expected revenue growth. Still, because of its growth levels,
margins, and business operations, it was weighted 17.78% and 17.49% for 2016
and 2017, respectively, based on the metric weightings.
EMCOR Group, Inc. (EME)—14.33% and 13.67%
“EMCOR Group, Inc. (EMCOR), incorporated on March 31, 1987, is an electrical
and mechanical construction and facilities services firm in the United States. The
Company provides a number of building services and industrial services. Its
services are provided to a range of commercial, industrial, utility and institutional
customers through approximately 70 operating subsidiaries and joint venture
entities. It specializes in providing construction services relating to electrical and
mechanical systems in all types of non-residential and certain residential facilities
and in providing various services relating to the operation, maintenance and
management of facilities, including refineries and petrochemical plants. The
Company operates in segments: United States electrical construction and facilities
services; United States mechanical construction and facilities services; United
States building services; United States industrial services, and United Kingdom
building services.”—Google Finance
EMCOR Group, Inc. (EME) was chosen as a comparable to Argan because of its
gross margin size, a relatively similar beta, and similar net income growth.
However, it has more exposure the distribution and transmission of electrical
power instead of the generation of power. However, they also have exposure to
the procurement of lighting systems, much like Argan’s telecommunications
segment run by SMC. The majority of their business occurs in the United States.
They used to have operations within the United Kingdom, but recently withdrew
Figure 22: EME One-Year Stock Chart
Source: Yahoo Finance
One-Year Stock Chart
0
200000
400000
600000
800000
1000000
1200000
$0.00
$10.00
$20.00
$30.00
$40.00
$50.00
$60.00
Feb-15 Apr-15 Jun-15 Aug-15 Oct-15 Dec-15
Volume Adj Close 50-Day Avg 200-Day Avg
Figure 23: CBI One-Year Stock Chart
One-Year Stock Chart
0
2000000
4000000
6000000
8000000
10000000
12000000
$0.00
$10.00
$20.00
$30.00
$40.00
$50.00
$60.00
$70.00
Feb-15 Apr-15 Jun-15 Aug-15 Oct-15 Dec-15
Volume Adj Close 50-Day Avg 200-Day Avg
Source: Yahoo Finance
Multiple Implied Price Discounted Price Weight
EV/Revenue 2017E $33.90 $30.08 0.00%
EV/Gross Profit 2017E $44.02 $39.05 0.00%
EV/EBIT 2017E $56.87 $50.46 0.00%
EV/EBITDA 2017E $50.00 $44.36 100.00%
EV/(EBITDA-Capex) 2017E $58.68 $52.06 0.00%
Market Cap/Net Income = P/E 2017E $46.01 $40.82 0.00%
Price Target $44.36
Current Price 29.59
Undervalued 49.92%
Figure 21: 2017 Multiples
Source: UOIG Spreads
10. UOIG 10
University of Oregon Investment Group February 12, 2016
from the area due to poor profitability. Because of the above reasons, EMCOR
Group, Inc. was weighted 14.33% and 13.67% based on the metric weightings.
Chicago Bridge & Iron Co. (CBI)—12.96% and 10.57%
Chicago Bridge & Iron Company N.V. (CB&I), incorporated in 1889, provides a
range of services to customers in the energy infrastructure market across the
world. The Company provides various services, such as conceptual design,
technology, engineering, procurement, fabrication, modularization, construction,
commissioning, maintenance, program management and environmental services,
and also various Government services. The Company operates through four
segments: Engineering, Construction and Maintenance, which provides
engineering, procurement and construction (EPC) services for energy
infrastructure facilities, as well as integrated maintenance services; Fabrication
Services, Technology, and Environmental Solutions.”—Google Finance
Chicago Bridge & Iron Co. (CBI) was added as a comparable company because
it is one of Argan’s largest competitors. Additionally, about 50% of its business
is made up of the planning, engineering, and construction of nuclear, fossil, and
renewable energy plant project services. Like Argan, they also do the
maintenance and operation of the plants once the project is done. However, their
margins are about half of those of Argan’s, and it has negative growth rates in
2017. Finally, it has a D/E of .41, which is much higher than Argan’s D/E of 0.
Therefore, from the metric weightings Chicago Bridge & Iron Co. was given
weightings of 12.96% and 10.57% for 2016 and 2017, respectively.
Tutor Perini Corp. (TPC)—12.07% and 10.61%
“Tutor Perini Corporation, incorporated on January 5, 1918, is a construction
company engaged in providing general contracting, construction management and
design-build services to private customers and public agencies around the world.
The Company offers general contracting, pre-construction planning and project
management services, including the planning and scheduling of the manpower,
equipment, materials and subcontractors required for a project. It also offers self-
performed construction services, including site work, concrete forming and
placement, steel erection, electrical, mechanical, plumbing, and heating,
ventilation and air conditioning (HVAC). The Company operates through three
segments: Civil, Building, and Specialty Contractors.”—Google Finance
Tutor Perini Corp. (TPC) was added from the comparable universe because of its
similar market cap and revenue growth, as well as it being in the same industry as
Argan. However, it has a very high level of debt with a D/E ratio of .63, and its
beta is about 21% larger than Argan’s estimated beta. Additionally, it primarily
focuses on the construction and engineering of roads, bridges, and water treatment
facilities. Much of their work comes from government contracts. Because of this,
Tutor Perini Corp. was given a weighting of 12.07% and 10.61%.
MasTec, Inc. (MTZ)—8.83% and 13.16%
“The Company builds infrastructure projects for customers across a range of
industries. It specializes in building natural gas, crude oil and refined product
transport pipelines; underground and overhead distribution systems, including
trenches, conduits, cable and power lines, which provide wireless and wireline
communications; electrical power generation, transmission and distribution
systems; renewable energy infrastructure, including wind and solar farms, and
Figure 25: TPC One-Year Stock Chart
Source: Yahoo Finance
One-Year Stock Chart
0
500000
1000000
1500000
2000000
2500000
$0.00
$5.00
$10.00
$15.00
$20.00
$25.00
$30.00
Feb-15 Apr-15 Jun-15 Aug-15 Oct-15 Dec-15
Volume Adj Close 50-Day Avg 200-Day Avg
Figure 26: MTZ One-Year Stock Chart
Source: Yahoo Finance
One-Year Stock Chart
0
1000000
2000000
3000000
4000000
5000000
6000000
7000000
8000000
$0.00
$5.00
$10.00
$15.00
$20.00
$25.00
Feb-15 Apr-15 Jun-15 Aug-15 Oct-15 Dec-15
Volume Adj Close 50-Day Avg 200-Day Avg
Comparables Analysis Implied Price Weight
2016 Comparables 46.54 75.00%
2017 Comparables 44.36 25.00%
Price Target $45.99
Current Price 29.59
Undervalued 55.43%
Figure 24: Comparable Analysis Implied Price
Source: UOIG Spreads
11. UOIG 11
University of Oregon Investment Group February 12, 2016
compressor and pump stations and treatment plants and heavy industrial plants.
The Company installs buried and aerial fiber optic cables, coaxial cables, copper
lines, electrical and other energy distribution systems, transmission systems and
satellite dishes in a variety of environments for its customers. In connection with
its installation work, it deploys and manages network connections that involve its
customers’ hardware, software and network equipment.”—Google Finance
MasTec, Inc. (MTZ) was used as a comparable to Argan primarily to reflect the
combined exposure to oil and natural gas as well as telecommunications.
However, most of their exposure comes from the construct of oil and gas pipelines
instead of power generation. While it has somewhat similar gross margins, it has
much low er EBIT, EBITDA, and net margins. Additionally, it has much lower
growth rates for 2016E because of the fall in gas prices. Finally, it has a large
debt level and a much higher beta. From the metric weightings, MasTec was
given weightings of 8.83% and 13.16% for 2016 and 2017, respectively.
Fluor Corp. (FLR)—8.02% and 9.73%
“Fluor Corporation (Fluor), incorporated on September 11, 2000, is a holding
company. The Company, through its subsidiaries, provides professional services.
The Company provides engineering, procurement, construction, fabrication and
modularization, commissioning and maintenance, as well as project management
services. The Company is an integrated solutions provider for various industries,
including oil and gas, chemicals and petrochemicals, transportation, mining and
metals, power, life sciences and manufacturing. The Company is also a service
provider to the United States Federal Government, and it performs operations and
maintenance activities around the world for its industrial clients. The Company
operates its business in five segments: Oil & Gas, Industrial & Infrastructure,
Government, Global Services and Power.”—Google Finance
Qualitatively, Fluor Corp. was used because it is another of Argan’s main
competitors, it is in the same industry, and about 50% of its revenue comes from
oil and gas construction and maintenance services. Quantitatively, it has a similar
beta, but it has different growth rates, lower margins, and a D/E ratio of .18.
Additionally, it is much larger than Argan. For this and the reasons stated above,
Fluor Corp. was given a weighting of 8.02% and 9.73%.
Discounted Cash Flow Analysis—75%
Revenue Model
Argan, Inc. breaks their revenue out into their two segments, Power Industry
Services and Telecommunications Infrastructure. Much of their historical revenue
is very sporadic due to the contractual nature of their business operations. Argan
does not provide any color on their future operations, but does provide the current
backlog at the end of each financial term for their Power Industry Services
segment. This provides a little help on how to project their revenue streams. The
fourth quarter of 2016E was based off of the performance of the prior three
quarters, as well as some analyst expectations. 2017E was based off of the huge
backlog that Argan currently has, as well as the expected completion of two of
Argan’s major projects in the first half of 2017E, as well as the initiation of
Figure 28: Beta Table
Source: UOIG Spreads
Figure 27: FLR One-Year Stock Chart
Source: UOIG Spreads
One-Year Stock Chart
0
1000000
2000000
3000000
4000000
5000000
6000000
$0.00
$10.00
$20.00
$30.00
$40.00
$50.00
$60.00
$70.00
Feb-15 Apr-15 Jun-15 Aug-15 Oct-15 Dec-15
Volume Adj Close 50-Day Avg 200-Day Avg
Beta SE Weighting
1-Year Daily 0.89 0.13 0.00%
3-Year Daily 1.11 0.10 50.00%
5-Year Daily 1.46 0.07 50.00%
3 Year Weekly 1.18 0.19 0.00%
5 Year Weekly 1.17 0.15 0.00%
3 Year Monthly 1.04 0.57 0.00%
5 Year Monthly 1.27 0.36 0.00%
Vasicek - Comps 0.70 0.00%
Vasicek - ETF 0.57 0.00%
Hamada - Comps 0.48 0.00%
Hamada - ETF 0.37 0.00%
Argan, Inc. Beta 1.29
ImpliedPrice Undervalued/(Overvalued)
Terminal Growth Rate Terminal Growth Rate
44 2.3% 2.8% 3.3% 3.8% 4.3%
1.25 43.99 44.69 45.47 46.32 47.26
1.27 43.57 44.25 45.00 45.82 46.74
1.29 43.17 43.82 44.55 45.34 46.22
1.31 42.77 43.40 44.10 44.87 45.72
1.33 42.38 42.99 43.67 44.41 45.23
AdjustedBeta
Figure 29: Beta Sensitivity Table
Source: UOIG Spreads
12. UOIG 12
University of Oregon Investment Group February 12, 2016
multiple new projects. From there, revenue growth is expected to drop down to
15%, then 10%, then smooth down to 3% growth in the terminal year. The
revenue was smoothed out instead of projected in a cyclical fashion because it is
very difficult to project contract wins. Factors that will influence revenue growth
in the future will be strategic acquisitions, geographical expansion within the
United States and globally, and an increased demand for natural gas-fired plants.
The earlier forecasted years are based on the expected completion of projects and
current backlog.
Cost of Revenues Model
Cost of revenue is made up of the tools and labor needed in the engineering and
construction of the power industry services projects as well as the materials for
the telecommunications services projects. Most of the materials used in the
projects that Argan conducts are provided by the customer, however in some cases
Argan will provide the materials. Cost of revenue is divided into power industry
services and telecommunications services. Each of these segments of the cost of
revenue were projected as a percentage of their respective revenue segments. The
specific percentages used were smoothed out through terminal year, where a value
slightly higher than historical averages was used. As power plants become more
efficient and technologically advanced, Argan’s projects will become more
expensive and will require more experienced workers and better tools. Therefore,
it is fair to expect that the cost of revenues will increase slowly to historical levels.
Beta
Argan’s beta calculations provided a strong collection of values that had low
standard errors. All of the weighting for the beta fell on the three and five year
daily beta calculations because they had the lowest standard errors. Therefore, a
final beta calculation of 1.29 used.
Depreciation and Amortization and PP&E
Seen from historical values, PP&E has stayed at relatively constant levels, so
PP&E purchases were projected to trend towards historical averages. D&A was
projected off a percentage of revenue instead of beginning PP&E because of the
large increases in capital expenditures and acquisitions going into the terminal
year would cause a huge increase in D&A if projected off of beginning PP&E.
Net Working Capital
Almost all current assets and liabilities were trended towards historical averages
through days outstanding. Costs and Estimated Earnings in Excess of Billings
was projected as a percentage of revenue towards historical averages, as were
Prepaid Expenses, and Accrued Expenses. Accounts payable were trended down,
as seen by recent historical trends. Billings in Excess of Costs and Estimated
Earnings was trended down to historical averages.
Capital Expenditures and Acquisitions
Capital expenditures were projected as a percentage of revenue towards historical
averages, while being able to support the growth that is currently projected.
Acquisitions were projected as a percentage of revenue. The company expects to
make strategic and opportunistic acquisitions every three years, however
acquisitions were smoothed into the terminal year to prevent large disruptions in
the cash flows as many of the costs associated with acquisitions are spread across
0%
1%
2%
3%
4%
5%
6%
7%
8%
9%
0
10000
20000
30000
40000
50000
60000
70000
2010A 2012A 2014A 2016E 2018E 2020E 2022E 2024E
$inThousands
Selling, General, and Administrative % of Revenue
Figure 30: SG&A Expense
Source: UOIG Spreads
0
200
400
600
800
1,000
1,200
2010A 2011A 2012A 2013A 2014A 2015A
Thousands($)
Depreciation Amortization
Figure 31: Historical D&A
Source: Argan 10-K
ImpliedPrice Undervalued/(Overvalued)
Terminal Growth Rate Terminal Growth Rate
44 2.0% 2.5% 3.0% 3.5% 4.0%
5.45% 47.24 48.12 49.09 50.17 51.38
5.95% 44.92 45.66 46.47 47.37 48.37
6.45% 42.85 43.47 44.16 44.92 45.75
6.95% 40.99 41.52 42.11 42.75 43.45
7.45% 39.31 39.77 40.27 40.81 41.41
MarketRisk
Premium
Figure 32: Market Risk Premium Sensitivity Table
Source: UOIG Spreads
13. UOIG 13
University of Oregon Investment Group February 12, 2016
multiple years. Argan is very experienced with strategic acquisitions and has a
large cash balance to allow them to make these without taking out debt.
Recommendation
Based upon the future demand natural gas, the phasing out of dated coal and
nuclear plants, and the expansion of renewable energies, Argan will continue to
expand their industrial and energy production construction across the United
States. With their proven management team, Argan will continue to make
strategic acquisitions that offer complimentary services to its current business
operations and provide great standalone investments to boost topline revenue.
Finally, with a consistent annual dividend, a huge cash balance, and great future
revenue growth, Argan is currently at a steep discount. Weighting the discounted
cash flow analysis 75% and the comparable analysis 25%, a final price target of
$44.62 was reached and a strong BUY is recommended for all portfolios.
Figure 33: Final Implied Price Target
Source: UOIG Spreads
Source Implied Price Weighting
Discounted Cash Flow Analysis $44.16 75%
Comparable Analysis 45.99 25%
Weighted Implied Price $44.62
Current Price $29.59
Undervalued 50.79%
25. UOIG 25
University of Oregon Investment Group February 12, 2016
Appendix 11 - Sources
Argan 10-K
Argan 10-K
Argan Q3 2016 Earnings Presentation
Argan Investor Relations
Argan Website
Business Wire
FactSet
Financial Visualizations Website
Google Finance
IBIS World
Morningstar
Seeking Alpha
US Energy Information Administration
United States Census Bureau
Wall Street Journal
Yahoo Finance