The annual report discusses Alstom's performance in fiscal year 2012-2013. Key points include:
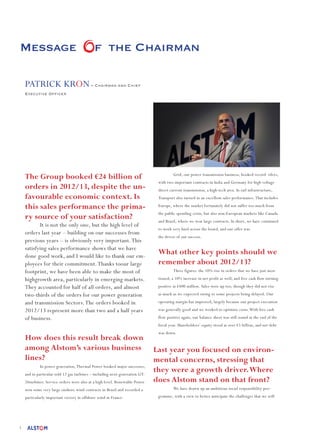
- Alstom booked €24 billion in orders despite an unfavorable economic context. Half of all orders and almost two-thirds of power generation orders came from emerging markets.
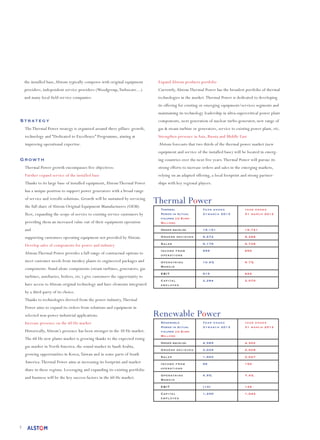
- All of Alstom's business lines (power generation, grid, rail infrastructure) performed well with record orders. Thermal power sold 12 gas turbines and renewable/grid won major contracts.
- Key figures for the year include a 10% rise in orders, 10% increase in net profit, and free cash flow turning positive at €400 million. Alstom is well positioned for future growth.