
Recommended
Recommended
More Related Content
Similar to Pr. 12-6Problem 12-6 represents an incorrect N answer =COUNTIF(A.docx
Similar to Pr. 12-6Problem 12-6 represents an incorrect N answer =COUNTIF(A.docx (19)
More from ChantellPantoja184
More from ChantellPantoja184 (20)
Recently uploaded
Recently uploaded (20)
Pr. 12-6Problem 12-6 represents an incorrect N answer =COUNTIF(A.docx
- 1. Pr. 12-6Problem 12-6* represents an incorrect N answer =COUNTIF(A14:H27,"~*")Name:0Section:" " represents an unanswered N box - counts as an incorrect. =COUNTIF(A14:H27," ")34Score:0%" " represents a correct blank answer or N answer =COUNTIF(A14:H27," ")0Key Code:2Total SUM(AV13:AV15)Instructions 34Answers are entered in the cells with gray backgrounds.Percentage =AD6/AD8Cells with non-gray backgrounds are protected and cannot be edited.0%A red asterisk (*) will appear beside, above or below an incorrect answer.Notes:" " represents an unanswered N box - counts as an incorrect." " represents a correct blank answer or N answer1.Total number of answers = sum of aboveEthyleneButaneEsterConditional formatting might be used but wasn't here, to hide some of the error check return symbols. If A1 = "~*", then font = red, if something else, then font = background color.Selling priceSteps:Variable conversion cost per unit Highland Community College: Enter all costs as positive values. Highland Community College: Enter all costs as positive values. Highland Community College: Enter all costs as positive values.Open this sheet and macro sheetDirect materials cost per unitOpen old templated, then change color palet to this sheet'sTotal cost per unitInsert new header - change problem number and reformatContribution margin per unitCopy these formulas (column AD) to new sheet.Update to new edition's names and numbersCopy new error check formulas. For N- boxes2.=IF(sol.!$C$5="OFF","",IF(AC25="","
- 2. ",IF(AC25<>sol.!AC25,"*"," ")))EthyleneButaneEsterContribution margin per unitReactor (bottleneck) hours per unit¸For B-BoxesContribution margin per reactor hour=IF(sol.!$C$5="OFF","",IF(AC30<>sol.!AC30,"*"," "))Copy Score formula from this template to new sheet.=IF(sol.!$C$5="OFF","","Score:")=IF(sol.!$C$5="OFF"," ",AD10)Which product is the most profitable?Ethylene delivers the most contribution margin per bottleneck hour.Explain:Butane delivers the most contribution margin per bottleneck hour.=IF(sol.!$C$5="OFF","","*Since some answer boxes are correct when left blank, the beginning score is greater than 0%.")Ester delivers the most contribution margin per bottleneck hour.3.One way to revise the pricing would be to increase the price to the point where all three products produce profitability equal to the highest profit product. This would be determined as follows:Revised Price of Ethylene:Unit Contribution Margin per Reactor Hour for EsterRevised Price of Ethylene-Unit Variable Cost of Ethylene=Reactor Hours of Ethylene per UnitRevised Price of Ethylene-==Revised Price of Ethylene(Price required of Ethylene to deliver the same contribution margin per bottleneck hour as doesester.)Revised price of Ester:Unit Contribution Margin per Reactor Hour for EsterRevised Price of Butane-Unit Variable Cost of Butane=Reactor Hours of Butane per UnitRevised Price of Butane-==Revised price of Butane(Price required of Butane to deliver the same contribution margin per bottleneck hour as doesester.)The manager has used differential cost instead of full unit cost in the analysis.The manager has used full unit cost instead of differential cost in the analysis.The fixed costs must be included in the decision analysis. sol.Problem 12-6* represents an incorrect N answer =COUNTIF(A14:H27,"~*")Name:SOLUTION0Section:" " represents an unanswered N box - counts as an incorrect. =COUNTIF(A14:H27," ")Score:See student sheet for student's
- 3. score0Scoring:ON" " represents a correct blank answer or N answer =COUNTIF(A14:H27," ")8Total SUM(AV13:AV15)Instructions 8Answers are entered in the cells with gray backgrounds.Percentage =AD6/AD8Cells with non-gray backgrounds are protected and cannot be edited.100%A red asterisk (*) will appear beside, above or below an incorrect answer.Notes:" " represents an unanswered N box - counts as an incorrect." " represents a correct blank answer or N answer1.Total number of answers = sum of aboveEthyleneButaneEsterConditional formatting might be used but wasn't here, to hide some of the error check return symbols. If A1 = "~*", then font = red, if something else, then font = background color.Selling price$ 400$ 350$ 250Steps:Variable conversion cost per unit$ 120 Highland Community College: Enter all costs as positive values.$ 120 Highland Community College: Enter all costs as positive values.$ 80 Highland Community College: Enter all costs as positive values.Open this sheet and macro sheetDirect materials cost per unit18013090Insert new header - change problem number and reformatTotal cost per unit$ 300$ 250$ 170Copy these formulas (column AD) to new sheet.Contribution margin per unit$ 100$ 100$ 802.EthyleneButaneEsterContribution margin per unit$ 100$ 100$ 80Reactor (bottleneck) hours per unit¸1.00.80.5Contribution margin per reactor hour$ 100$ 125$ 160Which product is the most profitable?EsterEthylene delivers the most contribution margin per bottleneck hour.Copy Score formula from this template to new sheet.Explain:Butane
- 4. delivers the most contribution margin per bottleneck hour.=IF(sol.!$C$5="OFF","","Score:")=IF(sol.!$C$5="OFF","" ,AD10)Ester delivers the most contribution margin per bottleneck hour.Ester delivers the most contribution margin per bottleneck hour.=IF(sol.!$C$5="OFF","","*Since some answer boxes are correct when left blank, the beginning score is greater than 0%.")3.One way to revise the pricing would be to increase the price to the point where all three products produce profitability equal to the highest profit product. This would be determined as follows:Revised Price of Ethylene:Unit Contribution Margin per Reactor Hour for EsterRevised Price of Ethylene-Unit Variable Cost of Ethylene=Reactor Hours of Ethylene per UnitRevised Price of Ethylene-$300$160=1.0$460=Revised Price of Ethylene(Price required of Ethylene to deliver the same contribution margin per bottleneck hour as doesester.)Revised Price of Butane:Unit Contribution Margin per Reactor Hour for EsterRevised Price of Butane-Unit Variable Cost of Butane=Reactor Hours of Butane per UnitRevised Price of Butane-$250$160=0.8$378=Revised price of Ester(Price required of Ester to deliver the same contribution margin per bottleneck hour as doesester.)The manager has used differential cost instead of full unit cost in the analysis.The manager has used full unit cost instead of differential cost in the analysis.The fixed costs must be included in the decision analysis. Introduction The research proposal explores through various areas of the research to be conducted on customer service in the hotel service. The importance of the research will be to evaluate the core values which are normally followed in the customer service in the hotels. Customer service in the hotels is very pertinent in
- 5. the hospitality field since it is what determines the outcome and productivity in the hotels. Good customer service in the hotels includes a wide range of services. Good customer service is the key to successful hotel business and that is why this research proposal will be of great importance I helping the researchers to establish the key secrets of building customer loyalty through provision of true customer service. Effective customer service in the hotel service creates a very rewarding customer satisfaction since it provides important information such as reservations, contact information as well as services (Creswell, 2003). The structure that I have written this research proposal has sections such as introduction, research questions, the research methodology, research time frame, achievement after research as well as the reference section. This research proposal structure directed me in the research so as to achieve my goal of carrying out the intended research. Research questions 1. Does customer care service have an effect on customer satisfaction and does customer care service determine whether the needs of customers are met? 2. Does quality customer service plays a role in the retention of customers and attracting of new customers? 3. Are the customer care services offered in hotels in the current day and era satisfactory as far as customer satisfaction is concerned? 4. Does the employee training program offered enhance better delivery of services to customers? Research methodology Research methodology is the procedure which can be applied by a researcher to facilitate the collection of data and information required form one to carry out the research. These are the techniques applied by the researcher to underpin the methods to be used in the collection of data for purposes of
- 6. generating the hypothesis of the research. The sampling site I have selected is Quest Caroline Springs. This is the guest satisfaction hotel that I have used to enable me to conduct my research. It will therefore be my sample site (Creswell, 2003). The research methodologies used in my research includes the following; 1) Sampling approach Sampling method of research method where the researcher takes a sample of what he intends to research on to be the basis of his research. The researcher then carries out an investigation on this sample in a bid to establish whether the sample has the key things he wants to find out. In application of this method, a sample of one of Quest Caroline Springs was useful. Through investigation of the customer services in the sample, the quality of customer services was identified. Some of the questions that can help in carrying out this investigation included questions on whether the customer services offered to guest in Quest Caroline Springs meets customer satisfaction. The sampling method provided information concerning this question since the sample included some of the customers at Quest Caroline Springs and inquired about the quality of services they got from the customer service department of the hotel. Sampling some of the hotel customer service employees and guests found out whether they feel that the kind of services they offered to customers are meeting customer satisfaction or whether the customers have submitted any complaints as far as the customer service of the hotel is concerned is important too. The advantage of using the sampling method is that it provided the researcher with quality first-hand information from hotel customers as well as some of the employees in the customer service department. 2) Interviews This is a research method where there is a face to face
- 7. discussion between the researcher and respondent. It was a very effective method in acquiring information from a number of customer service employees of a selected hotel. For instance, Quest Caroline springs customer service help desk. This interview helped in the collection of data on how the hotel customer services are administered and whether the hotel customer services meets customer satisfaction through the customer services they offer (Howell, 2013). This method was very successful as simple and short-structured questions were used. This is because structured questions require direct and straight to the point answers. A mixture of open ended questions and closed questions was very useful and beneficial in this research. The interviewees, in this case some customers of the hotel and a number of employees from the customer service department of the hotel (Creswell, 2003). The benefit of this research methodology was that it provided me with immediate feedback and was less time consuming. The information collected using this method was reliable since the method provided an opportunity for collection of first hand data which I was able to gauge access to the credibility of the information given by the interviewees. 3) Questionnaires The use of questionnaires was effective strategy and method of acquiring information about customer service. Through questionnaires, first-hand information on this issue was acquired. The structuring of questionnaires in order to collect as much information as possible would be of great essence. The questionnaires were used to enquire information through phone calls of employees from hotel directories helped acquiring valuable information regarding hotel service. Using phone calls, the respondent gave answers to questions that would be well structured, short and precise (Howell, 2013). The use or application of questionnaires as a method or strategy of acquiring information about service delivery would be done through email service. Sending guest satisfaction survey to guest would help acquire reliable information on hotel services.
- 8. Emails of guest’s would be acquired from various directories and records in the hotel. For the use of emails to be effective in acquiring this information, the emails should be have direct answer questionnaires and have short and precise questions that use simple and easy to understand language. Long and complicated questions are likely to be boring to the respondent and even make them avoid giving responses to the questionnaires (Howell, 2013). In the use of questionnaires as a method of acquiring information, the adoption of the best strategies in this method should be done in order to ensure that the respondents to the questionnaires give adequate information. In using questionnaires, the respondents should be individuals whose information and feedback cannot be questioned and more importantly, the respondents must have been in the hotel industry and the questionnaires will be sent to the guest who has stayed in the hotel. Intended Eventual Cause Target Audience Corporate Leisure Corporate Leisure NA Sample Size 150-200 150 Guest refuses to give their email address Location Quest Caroline Springs Quest Caroline Springs NA
- 9. Research Instruments Guest Survey Interview 150 sent, 37 received 2 interview with staff NA Research Time Frame In conducting the research, each strategy will have its own time frame. The whole research should be conducted in a time period of approximately two months. If time is managed well and respondents are quick in their responses, the research will take much less time than expected (Howell, 2013). Achievement after research This section should be comprised of expected outcomes form conducting the research. Before any research is conducted, there are the hypotheses which are generated. This hypothesis is proved after the actual conducting of the research. There are numerous achievements expected after this research. For example, after the research the hotel should be aware that the qualities of customer services they offer to the customers contribute to attraction of new customers as well as the retention of the existing customers. There should be a direct connection between the training programs in the hotel industry and the quality of services offered by the customer service to customers. To achieve customer satisfaction, Quest Caroline Springs ought to improve the quality of customer services offered in the hotel. The hotel should benefit from the research by being in a position to get a response concerning the quality of services it offers to its customers through the research and might also give information to improve the customer service from guest’s feedback. (Creswell, 2003).
- 10. Literature review Introduction In accordance to Kandampully (1997), within the present day’s competitive environment, customer’s perceptions, as well as, expectations demand that the service leaders have to distinguish themselves from the emerging main competitors by ensuring that their customers are not only satisfied but also delighted by the quality of services which they offer. Researchers such as (Kandampully, 1997; Lee, Barker, & Kandampully, 2003) suggest that service and customer loyalty is actually a two-way relationship. This is due to the fact that as service firms make attempts to gain client’s loyalty; on the other hand, the clients seek the firm’s service loyalty. Nevertheless, recently done studies (Bowen & Chen, 2001) indicate that there exist additional reasons why service providers should satisfy customers other than service loyalty. Service Quality According to (Lovelock, C. & Wirtz, J., 2004), a service is the term given to an economic activity which not only creates value but also provides benefits for clients at certain times, as well as, places by ensuring that it brings about the desired change in the service recipient. Even though the process is sometimes tied to certain physical products, the performance is considered to be transitory, naturally intangible and does not usually result in the possession of any of the production factors. Nonetheless, being in the position of satisfying specific needs tends to reflect the quality or value of the service to the clients, inclusive of the economic value, reliability, safety, in addition to maintainability. In that regard, the customer’s service quality evaluations along with the resultant satisfaction levels are considered to have
- 11. impact on the fundamental business success measures. To others, service quality can be described as the variance between the clients’ service encounter expectations and the actual views about the services received. In respect to Suman M. along with Garg, R. (2012), it is thereby forecasted that clients will most likely consider quality as ‘low’ or ‘poorest’ in the event that performance fails to meet their anticipations, whereas quality will be considered as ‘high’ or ‘best’ once performance is way above the expectations. Customer Loyalty In respect to the views of Kumar, R.S., & Advani, J.Y. (2009); customer loyalty is the term used in describing the repeat customers’ behavior together with those of the customers who give good testimonials, ratings or reviews. It does not simply involve the issue of customers doing a certain company favor by talking good about it publicly concerning it services or products or telling family members or friends about the company’s excellent services but also, it is the program or process which is aimed at keeping clients happy so that they can provide more business. Iddrisu, A.M (2011) specified that loyalty is basically developed over a certain time period from constituent meeting records, and in some situations even surpassing the customer expectations. Therefore, it is outright that customer loyalty can successfully be realized in certain cases by offering quality products/services with an affirmed guarantee or via free offers, discounted prices, coupons, rebates along with other rewards or incentive programs. The ultimate objective of the aforementioned strategies is to manage to develop satisfied and happy clients who will not only become repeat customers but also lure others to utilize that firm’s services/products. In respect to Kotler, P. & Gartner, D. (1996), such measures enable a firm to cut costs greatly thus increasing its profitability by maintaining its customers other than attempting to attract new ones. In addition, it makes the firm stakeholders happy (Mukherjee, 2009).
- 12. The customers who are considered as loyal are those who do not get swayed easily by the competitors’ price inducements and in most cases they make mote purchase when compared to the less loyal ones. Nevertheless, it is of great essence to note that there are numerous factors which contribute towards making such customers loyal. Geronikolas (2012) outlined five factors which have the potential of driving customers away within the hotel industry. Some of the said factors include lack of observing cleanliness within the hotel surroundings (particularly within the hotel restaurants or rooms); poorly trained or perceived rude employees; the customers’ “need for change” probably in pricing, affordability, as well as, value for money. Basically, hotel foods together with beverage standards turn out to be the most vital in hotel tangibles. Besides, they tend to be increasingly becoming momentous not only in the creation of satisfied customers but also in the driving away of the dissatisfied customers. Other factors which appear recurrently as elements which drive business away include the state of the hotel facilities such as availability of heating facilities or air conditioners; issues regarding the hotel’s reliability (in delivery of promised services in an accurate and consistent manner), bad service, managerial behavior towards unique needs, as well as, situations which may arise, the nature of the other guests (the ambience within the hotel created by other customers) in addition to the noise within not only the hotel but also its surroundings. Attracting the right customers and keeping them in touch through various means is simply customer loyalty. Customer who is loyal to a particular brand/product or buy it repeatedly without a second thought determines the customer loyalty. However, Quest Caroline springs has been able to maintain its customer loyalty because it has been providing customers with lots of benefits. Because mostly businesspeople seek services from Quest Caroline Springs, it is quite obvious that the
- 13. customer is loyal to its services provided. Quest Caroline Springs also rewards the customers with various benefits for choosing them over their competitors. Service Quality/Customer Loyalty Relationship Diverse studies have reviewed the relation between service qualities along with customer preference loyalty. For instance, by making the repurchase intentions the measure of loyalty, researchers such as Cronin, J. Jr together with Taylor, S.A in their 1994 study made the observation that service quality has no significant (positive) impact on repurchase intentions (which contrasts the significant positive effect of satisfaction on the repurchase intention). Nonetheless other researchers such as Boulding et.al (1993) by making the repurchasing elements together with the readiness to make a recommendation the customer loyalty measures, established relations between service qualities along with repurchase intentions together with wiliness to recommend. However, it should be noted that certain customers may maintain loyalty as a result of high switching barriers or even the absence of real substitutes, whereas others will continue being loyal as a result of finding satisfaction in the provided services. In that regard, it is necessary for the service providers to have being complacent given that customers repeat customers are not always the satisfied ones and still not all the satisfied customers can always be successfully retained. Research has revealed that perceived service quality in most cases affects the customer loyalty positively. This is basically due to the fact that it has been found that service quality relates to behavioral outcomes, mostly within the form of complaint, word-of-mouth, as well as, recommendation together with switching. Customer Loyalty and Satisfaction Customers are considered as satisfied due to the positive feelings which they have that result from the process of examining what in reality has been received against the
- 14. expected, inclusive of the purchase decision themselves and the needs along with wants related to the purchase. Other researchers state that there exists a momentous positive relation between customer loyalty and customer satisfaction. The aforementioned relation is strengthened further as the customers become “delighted” or even “tremendously satisfied”. Wong, C.B (2005) mentioned that Clarke (2001) stated that customer satisfaction, that has turned to be nothing special but the entry price to a certain category is this the beginning point of establishing customer loyalty. Nonetheless, customer satisfaction by itself fails to guarantee loyalty as in certain cases a certain percentage of customers defect to seek the services of the competitors whereas they still confess that they still found satisfaction in the deserted service or product. In that regard, so as to make certain that customers are not defecting to the competitors, it was correct for Bowen, T.A along with Brown, S.W (2001) to point out that customers should be extremely satisfied. However, sometimes customers change providers due to issues related to pricing or because new opportunities have been offered by the competitors, or just because the customers need some variation. That notwithstanding, so as to make satisfaction turn out as effective, it should be in the position of creating loyalty amongst clients because establishing customer loyalty within businesses can no longer be considered as a choice. In the actual sense, it is simply the only strategy which greatly assists in establishing sustainable competitive advantage. Nevertheless, not every loyal customer is necessarily satisfied as it has been found that the service quality level plays a certain significant role. Customer Relationship Management The concept of putting in place measures of ensuring customer loyalty, as well as, satisfaction is termed as customer relationship management. However, it should be noted that
- 15. within the hotel industry, CRM (Customer relationship management) does not simply involve the practice of obtaining guest-centric data. It is actually the art of utilizing historical, private, as well as, experiential information in personalizing a client’s stay while establishing incremental revenue opportunities. For example, making the observation that a certain guest had a memorable experience with your hotel offers one the chance of winning them back for another visit. On the basis of the latest CRM offerings, hoteliers are in the position of developing comprehensive customer profiles from the reservation information. The obtained information can be utilized in restructuring service delivery such that the guests’ needs can be satisfactorily met. In spite of the verity that CRM brings about lasting benefits to business entities in general, some of them manage to profit more than others because of putting in place the appropriate correct measures. It has been established that CRM may brings benefits to the business entities which obtain detailed information about their customers. Besides, in accordance to Gronroos (2004), within the service business entities such as hotels, their intrinsic productions, as well as, consumption characteristics are inseparable elements vital in building relations with customers. Moreover, CRM is considered as suited ideally to the hotel sector, specifically once it is implemented not only successfully but also effectively putting into consideration that hotels are better placed in obtaining comprehensive data concerning their customers. The hoteliers are therefore expected to transform the acquired data into valuable knowledge about them. It is also vital to realize that CRM is made up of diverse dimensions. The dimensions are such as key customer focus, knowledge management, CRM organizations in addition to technology- based CRM. Basically, it is of great essence that each of the aforementioned dimensions works systematically within the business entity so as to be in the position of realizing improved
- 16. performance. Conclusion On the basis of the reviewed works concerning the impact of customer service on the hotel industry, it is outright that service providers have to be complacent putting into consideration that customers repeat customers are not always the satisfied ones and still not all the satisfied customers can always be successfully retained. In addition, research has revealed that perceived service quality in most cases affects the customer loyalty positively. This is basically due to the fact that it has been found that service quality relates to behavioral outcomes, mostly within the form of complaint, word-of-mouth, as well as, recommendation together with switching. All in all, for one to succeed within the hotel industry, he or she should focus much on customer relationship management which will assist in winning the loyalty of customers as they will always be contented with the services offered which in turn impacts positively on the accrued revenue. After all, the objective of every business entity is to accrue the maximum revenue possible. Data Collection Explanation: Explanation:
- 22. Explanation: Explanation: + Reference Creswell, J. (2003). Research Design: Qualitative, Quantitative,
- 23. and Mixed Methods Approaches. California: Sage Publications. Howell, K. (2013). Introduction to the Philosophy of Methodology. London: Sage Publications. Boulding, W., Kalra, A., Staelin, R. &Zeithaml, V.A. (1993). A Dynamic Process Model of Service Quality: From Expectations to Behavioral Intentions. Journal of Marketing Research. (30),7- 27. Bowen, T.A. & Brown, S.W. (2001). Advances in Services Marketing and Management. Greenwich, CT: JAI Press. Cronin, J. Jr. and Taylor, S. A. (1994). SERVPERF versus SERVQUAL; Reconciling Performance-Based and Perception- Minus-Expectations. Measurement of Service Quality. Journal of Marketing,(58)1,125-31. Geronikolas, N. (2012). Customer Defects in the Hotel Industry: The Five (5) Most Common Factors Driving Business Away. Hub Pages Inc. Gronroos, C. (2004), The relationship marketing process: communication, interaction, dialogue, value. Journal of Business and Industrial Marketing,19(2),99-113. Iddrisu, A. M. (2011). Service Quality and Customer Loyalty: The Case of the Mobile Telecommunication Industy in Ghana. KNUST Space. Institutional Repository for KNUST. Kandampully, J. (1997). Firms should give loyalty before they can expect it from customers. Managing Service Quality, 7(2), 92-94. Kotler, P. & Gertner, D. (2002). Country as Brand, Product and Beyond: A Place Marketing and Brand Management Perspective. Journal of Brand Management. 4(13), 249-261. Kumar, R. S. & Advani J.Y. (2009). Factors Affecting Branding Loyalty: A study in an Emerging Market on Fast Moving Consumer Goods. Indian Institute of Management Bangalore. Lee, S. C., Barker, S., & Kandampully, J. (2003). Technology, service quality, and customer loyalty in hotels: Australian managerial perspectives. Managing Service Quality, 13(5), 423- 432.
- 24. Lovelock, C. & Wirtz, J. (2004). Services Marketing-People, Technology, Strategy. Prentice Hall. Mukherjee, P. (2009). Budget Speech 2009-10. Suman, M. & Garg, R. (2012). Consumer Perception Towards Quality of Financial Services. Urban vs. Rural Perspective. Wong, C. B. (2005). The Influence of Customer Satisfaction and Switching Cost on Customer Retention: A Survey of Retail Internet Banking Users in Hong Kong. University of South Australia. - 32 - Chart1BusinessLeisureConferenceRelocationVisiting Friends and relativesOthers 2.What was the Purpose of your trip 2.What was the Purpose of your trip 15 10 3 1 2 6 Sheet12.What was the Purpose of your tripBusiness15Leisure10Conference3Relocation1Visiting Friends and relatives2Others6To resize chart data range, drag lower right corner of range. 76800502450123456789Quest WebsiteTravel AgentCorporate …Word of MouthPrint AdPrevious StayPassing byGoogleOnline Travel …Others 3.How did you hear about us Quest WebsiteTravel AgentCorporate Travel ManagementWord of MouthPrint AdPrevious StayPassing byGoogleOnline Travel AgentOthers Chart1Quest WebsiteTravel AgentCorporate Travel ManagementWord of MouthPrint AdPrevious StayPassing byGoogleOnline Travel AgentOthers
- 25. 3.How did you hear about us 7 6 8 0 0 5 0 2 4 5 Sheet13.How did you hear about usQuest Website7Travel Agent6Corporate Travel Management8Word of Mouth0Print Ad0Previous Stay5Passing by0Google2Online Travel Agent4Others5 Travel Agent, 4 Corporate Travel Manager, 8Direct at Quest Location, 7Quest Website, 7Questt Customer Contact Center, 2Online, 9Other, 0 4.How did you make reservation Chart1Travel AgentCorporate Travel ManagerDirect at Quest LocationQuest WebsiteQuestt Customer Contact CenterOnlineOther 4.How did you make reservation 4 8 7 7 2 9 0 Sheet14.How did you make reservationTravel Agent4Corporate Travel Manager8Direct at Quest Location7Quest Website7Questt Customer Contact Center2Online9Other0 1093411024681012ExcellentGoodFairPoorFair 5. How would you rate the Quality of the kitchen
- 26. ExcellentGoodFairPoorFair Chart1ExcellentGoodFairPoorFair 5. How would you rate the Quality of the kitchen 10 9 3 4 11 Sheet15. How would you rate the Quality of the kitchenExcellent10Good9Fair3Poor4Fair11To resize chart data range, drag lower right corner of range. 9156250246810121416ExcellentGoodFairPoorUncertain 7. How would you rate the Quality of the Bathroom ExcellentGoodFairPoorUncertain Chart1ExcellentGoodFairPoorUncertain 7. How would you rate the Quality of the Bathroom 9 15 6 2 5 Sheet17. How would you rate the Quality of the BathroomExcellent9Good15Fair6Poor2Uncertain5To resize chart data range, drag lower right corner of range. 2093500510152025ExcellentGoodFairPoorUncertain 8. How would you rate the Quality of the bedroom ExcellentGoodFairPoorUncertain Chart1ExcellentGoodFairPoorUncertain 8. How would you rate the Quality of the bedroom 20 9 3 5 0 Sheet18. How would you rate the Quality of the bedroomExcellent20Good9Fair3Poor5Uncertain0To resize chart
- 27. data range, drag lower right corner of range. 15128200246810121416ExcellentGoodFairPoorUncertain 9. How would you rate the Quality of the living room ExcellentGoodFairPoorUncertain Chart1ExcellentGoodFairPoorUncertain 9. How would you rate the Quality of the living room 15 12 8 2 0 Sheet19. How would you rate the Quality of the living roomExcellent15Good12Fair8Poor2Uncertain0To resize chart data range, drag lower right corner of range. Strongly Agree, 6Agree, 19Disagree, 5Strongly Disagree, 2Uncertain, 5 10. The Apartment was comfortable Strongly AgreeAgreeDisagreeStrongly DisagreeUncertain Chart1Strongly AgreeAgreeDisagreeStrongly DisagreeUncertain 10. The Apartment was comfortable 6 19 5 2 5 Sheet110. The Apartment was comfortableStrongly Agree6Agree19Disagree5Strongly Disagree2Uncertain5To resize chart data range, drag lower right corner of range. Strongly Agree , 0Agree, 6Disagree, 5Strongly Disagree, 6Uncertain/Did not use, 20 11. I was satisfied with the in-room internet Strongly Agree AgreeDisagreeStrongly DisagreeUncertain/Did not use Chart1Strongly AgreeAgreeDisagreeStrongly DisagreeUncertain/Did not use 11. I was satisfied with the in-room internet
- 28. 0 6 5 6 20 Sheet111. I was satisfied with the in-room internetStrongly Agree0Agree6Disagree5Strongly Disagree6Uncertain/Did not use20To resize chart data range, drag lower right corner of range. Strongly Agree, 0Agree, 10Disagree, 8Strongly Disagree, 2Uncertain/Did not use, 18 12. I was Satisfied with Breakfast option Strongly AgreeAgreeDisagreeStrongly DisagreeUncertain/Did not use Chart1Strongly AgreeAgreeDisagreeStrongly DisagreeUncertain/Did not use 12. I was Satisfied with Breakfast option 0 10 8 2 18 Sheet112. I was Satisfied with Breakfast optionStrongly Agree0Agree10Disagree8Strongly Disagree2Uncertain/Did not use18To resize chart data range, drag lower right corner of range. Agree, 2Disagree, 0Uncertain/Did not use, 35 13. I was satisfied with Pantry Shopping Service AgreeDisagreeUncertain/Did not use Chart1AgreeDisagreeUncertain/Did not use 13. I was satisfied with Panty Shopping Service 13. I was satisfied with Pantry Shopping Service 2 0 35 Sheet113. I was satisfied with Panty Shopping
- 29. ServiceAgree2Disagree0Uncertain/Did not use35To resize chart data range, drag lower right corner of range. Strongly Agree, 18Agree, 12Disagree, 0Strongly Disagree, 0Uncertain/Did not use, 7 14. I was satisfired with resturant charege back option Strongly AgreeAgreeDisagreeStrongly DisagreeUncertain/Did not use Chart1Strongly AgreeAgreeDisagreeStrongly DisagreeUncertain/Did not use 14. I was satisfired with resturant charege back option 18 12 0 0 7 Sheet114. I was satisfired with resturant charege back optionStrongly Agree18Agree12Disagree0Strongly Disagree0Uncertain/Did not use7To resize chart data range, drag lower right corner of range. 181054002468101214161820 15.Reception Staff were professional and provided excellent customer service Strongly AgreeAgreeDisagreeStrongly DisagreeUncertain/Did not use Chart1Strongly AgreeAgreeDisagreeStrongly DisagreeUncertain/Did not use Reception Staff were professional and provided excellent customer service 15.Reception Staff were professional and provided excellent customer service 18 10 5 4 0 Sheet1Reception Staff were professional and provided excellent
- 30. customer serviceStrongly Agree18Agree10Disagree5Strongly Disagree4Uncertain/Did not use0To resize chart data range, drag lower right corner of range. 161281005101520Strongly AgreeAgreeDisagreeStrongly DisagreeUncertain/Did not use 16. Housekeeping Staff were professional and provided excellent customer service Strongly AgreeAgreeDisagreeStrongly DisagreeUncertain/Did not use Chart1Strongly AgreeAgreeDisagreeStrongly DisagreeUncertain/Did not use 16. Housekeeping Staff were professional and provided excellent customer service 16 12 8 1 0 Sheet116. Housekeeping Staff were professional and provided excellent customer serviceStrongly Agree16Agree12Disagree8Strongly Disagree1Uncertain/Did not use0To resize chart data range, drag lower right corner of range. 15454270246810121416YunishAzraGraceAmolChrisNA 17.Any Particular Quest Employee who contributed to your stay being more comfortable and memorable YunishAzraGraceAmolChrisNA Chart1YunishAzraGraceAmolChrisNA Any Particular Quest Employee who contributed to your stay being more comfortable and memorable 17.Any Particular Quest Employee who contributed to your stay being more comfortable and memorable 15 4 5 4
- 31. 2 7 Sheet1Any Particular Quest Employee who contributed to your stay being more comfortable and memorableYunish15Azra4Grace5Amol4Chris2NA7To resize chart data range, drag lower right corner of range. Strongly Agree 27% Agree43%Disagree14%Strongly Disagree11%NA5% 18.My recent stay met my expectations Strongly AgreeAgreeDisagreeStrongly DisagreeNA Chart1Strongly AgreeAgreeDisagreeStrongly DisagreeNA My recent stay met my expectations 18.My recent stay met my expectations 10 16 5 4 2 Sheet1My recent stay met my expectationsStrongly Agree10Agree16Disagree5Strongly Disagree4NA2To resize chart data range, drag lower right corner of range. Strongly Agree, 16Agree, 10Disagree, 5Strongly Disagree, 5Uncertain/Did not use, 1 19.I would return to the property Strongly AgreeAgreeDisagreeStrongly DisagreeUncertain/Did not use Chart1Strongly AgreeAgreeDisagreeStrongly DisagreeUncertain/Did not use I would return to the property 19.I would return to the property 16 10 5 5 1
- 32. Sheet1I would return to the propertyStrongly Agree16Agree10Disagree5Strongly Disagree5Uncertain/Did not use1To resize chart data range, drag lower right corner of range. Strongly Agree, 16Agree, 9Disagree, 5Strongly Disagree, 6Uncertain/Did not use, 1 20. I would recommend this property to others Strongly AgreeAgreeDisagreeStrongly DisagreeUncertain/Did not use Chart1Strongly AgreeAgreeDisagreeStrongly DisagreeUncertain/Did not use 20. I would recommend this property to others 16 9 5 6 1 Sheet120. I would recommend this property to othersStrongly Agree16Agree9Disagree5Strongly Disagree6Uncertain/Did not use1To resize chart data range, drag lower right corner of range. 168751024681012141618 21. I would consider and recommennd the Quest Brand in thhe future Strongly AgreeAgreeDisagreeStrongly DisagreeUncertain/Did not use Chart1Strongly AgreeAgreeDisagreeStrongly DisagreeUncertain/Did not use 21. I would consider and recommennd the Quest Brand in thhe future 16 8 7 5 1 Sheet121. I would consider and recommennd the Quest Brand in thhe futureStrongly Agree16Agree8Disagree7Strongly Disagree5Uncertain/Did not use1To resize chart data range,
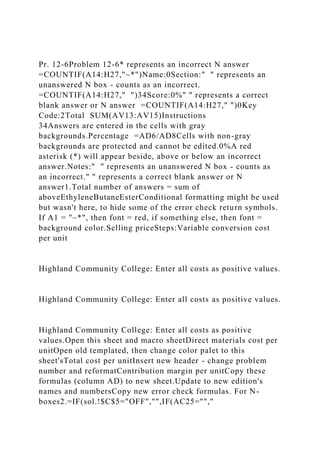
- 33. drag lower right corner of range. 1. Is this your First Stay at Quest Caroline Springs Yes, 20 No, 17 Yes No Chart1YesNo 1. Is this your First Stay at Quest Caroline Springs 20 17 Sheet11. Is this your First Stay at Quest Caroline SpringsYes20No17To resize chart data range, drag lower right corner of range. 2.What was the Purpose of your trip 15 10 3 1 2 6 0 2 4 6 8 10 12 14 16 Business Leisure Conference Relocation Visiting Friends and rela... Others
- 34. 2.What was the Purpose of your trip ✓ 1. Ethylene contribution margin per unit, $100 Palomar Chemical Company produces three products: ethylene, butane, and ester. Each of these products has high demand in the market, and Palomar Chemical is able to sell as much as it can produce of all three. The reaction operation is a bottleneck in the process and is running at 100% of capacity. Palomar Chemical wants to improve chemical operation profitability. The variable conversion cost is $20 per process hour. The fixed cost is $550,000. In addition, the cost analyst was able to determine the following information about the three products: Ethylene Butane Ester Budgeted units produced 15,000 15,000 15,000 Total process hours per unit 6 6 4 Reactor hours per unit 1.0 0.8 0.5 Unit selling price $400 $350 $250 Direct materials cost per unit $180 $130 $90 The reaction operation is part of the total process for each of these three products. Thus, for example, 1.0 of the 6 hours required to process ethylene are associated with the reactor. Instructions 1. Determine the unit contribution margin for each of the three products. 2. Provide an analysis to determine the relative product profitability’s, assuming that the reactor is a bottleneck. 3. Assume that management wishes to improve profitability by increasing prices on selected products. At what price would ethylene and butane need to be offered in order to produce the same relative profitability as ester? Pr. 12-1Problem 12-1* represents an incorrect N answer =COUNTIF(A14:H27,"~*")Name:0Section:" " represents an
- 35. unanswered N box - counts as an incorrect. =COUNTIF(A14:H27," ")13Score:0%" " represents a correct blank answer or N answer =COUNTIF(A14:H27," ")0Key Code:2Total SUM(AV13:AV15)Instructions 13Answers are entered in the cells with gray backgrounds.Percentage =AD6/AD8Cells with non-gray backgrounds are protected and cannot be edited.0%A red asterisk (*) will appear in the row immediately to the right of an incorrect answer.Notes:" " represents an unanswered N box - counts as an incorrect." " represents a correct blank answer or N answer1.Proposal to Operate WarehouseTotal number of answers = sum of aboveNovember 7, 2012Conditional formatting might be used but wasn't here, to hide some of the error check return symbols. If A1 = "~*", then font = red, if something else, then font = background color.Differential revenue from alternatives:Revenue from operating warehouseRevenue from investment in bondsSteps:Differential revenue from operating warehouseOpen this sheet and macro sheetDifferential cost of alternatives:Open old templated, then change color palet to this sheet'sCosts to operate warehouseInsert new header - change problem number and reformatCost of equipment less residual valueCopy these formulas (column AD) to new sheet.Differential cost of operating warehouseUpdate to new edition's names and numbersDifferential income from operating warehouseCopy new error check formulas. For N- boxes=IF(sol.!$C$5="OFF","",IF(AC25=""," ",IF(AC25<>sol.!AC25,"*"," ")))2.Should the proposal to operate the warehouse be accepted?The differential revenue from processing further to Decaf Columbian is more than the differential cost of processing further.For B- Boxes=IF(sol.!$C$5="OFF","",IF(AC30<>sol.!AC30,"*"," "))3.Total estimated revenue from operating warehouseCopy Score formula from this template to new sheet.Total estimated expenses to operate warehouse:=IF(sol.!$C$5="OFF","","Score:")=IF(sol.!$C$5="O
- 36. FF","",AD10)Costs to operate warehouse, excluding depreciation Highland Community College: Enter all costs as positive values. Highland Community College: Enter all costs as positive amounts.Cost of warehouse equipment less residual value=IF(sol.!$C$5="OFF","","*Since some answer boxes are correct when left blank, the beginning score is greater than 0%.")Total estimated income from operating warehouse Peggy Hussey: This amount could also be determined by adding the differential income from operating the warehouse to the investment income forgone. sol.Problem 12-1* represents an incorrect N answer =COUNTIF(A14:H27,"~*")Name:SOLUTION0Section:" " represents an unanswered N box - counts as an incorrect. =COUNTIF(A14:H27," ")Score:See student sheet for student's score0Scoring:ON" " represents a correct blank answer or N answer =COUNTIF(A14:H27," ")0Total SUM(AV13:AV15)Instructions 0Answers are entered in the cells with gray backgrounds.Percentage =AD6/AD8Cells with non-gray backgrounds are protected and cannot be edited.ERROR:#DIV/0!A red asterisk (*) will appear in the row immediately to the right of an incorrect answer.Notes:" " represents an unanswered N box - counts as an incorrect." " represents a correct blank answer or N answer1.Proposal to Operate WarehouseTotal number of answers = sum of aboveNovember 7, 2012Conditional formatting might be used but wasn't here, to hide some of the error check return symbols. If A1 = "~*", then font = red, if something else, then font =
- 37. background color.Differential revenue from alternatives:Revenue from operating warehouse$ 4,800,000Revenue from investment in bonds540,000Steps:Differential revenue from operating warehouse$ 4,260,000Open this sheet and macro sheetDifferential cost of alternatives:Insert new header - change problem number and reformatCosts to operate warehouse$ 2,625,000 Highland Community College: Enter all costs as positive amounts.Copy these formulas (column AD) to new sheet.Cost of equipment less residual value800,000Differential cost of operating warehouse3,425,000Differential income from operating warehouse$ 835,0002.Should the proposal to operate the warehouse be accepted?YesThe differential revenue from processing further to Decaf Columbian is more than the differential cost of processing further.Copy Score formula from this template to new sheet.=IF(sol.!$C$5="OFF","","Score:")=IF(sol.!$C$5="OFF"," ",AD10)3.Total estimated revenue from operating warehouse$ 4,800,000=IF(sol.!$C$5="OFF","","*Since some answer boxes are correct when left blank, the beginning score is greater than 0%.")Total estimated expenses to operate warehouse:Costs to operate warehouse, excluding depreciation$ 2,625,000 Highland Community College: Enter all costs as positive values. Highland Community College: Enter all costs as positive amounts.Cost of warehouse equipment less residual value800,0003,425,000Total estimated income from operating warehouse$ 1,375,000
- 38. Peggy Hussey: This amount could also be determined by adding the differential income from operating the warehouse to the investment income forgone. On November 7, Five Star is considering leasing a building and buying the necessary equipment to operate a public warehouse. Alternatively, the company could use the funds to invest in $900,000 of 4% U.S. Treasury bonds that mature in 15 years. The bonds could be purchased at face value. The following data have been assembled: Cost of equipment $900,000 Life of equipment 15 years Estimated residual value of equipment $100,000 Yearly costs to operate the warehouse, excluding depreciation of equipment $175,000 Yearly expected revenues, Years 1–7 $400,000 Yearly expected revenues years 8–15 $250,000 Instructions 1. Prepare a report as of November 7, 2012, presenting a differential analysis of the proposed operation of the warehouse for the 15 years as compared with present conditions. 2. Based on the results disclosed by the differential analysis, should the proposal be accepted? 3. If the proposal is accepted, what is the total estimated income from operations Ex. 11-7Exercise 11-7* represents an incorrect N answer =COUNTIF(A14:H27,"~*")Name:0Section:" " represents an unanswered N box - counts as an incorrect.
- 39. =COUNTIF(A14:H27," ")13Score:0%" " represents a correct blank answer or N answer =COUNTIF(A14:H27," ")0Key Code:2Total SUM(AV13:AV15)Instructions 13Answers are entered in the cells with gray backgrounds.Percentage =AD6/AD8Cells with non-gray backgrounds are protected and cannot be edited.0%A red asterisk (*) will appear below or immediately to the right of an incorrect answer.Notes:" " represents an unanswered N box - counts as an incorrect.Revenue per AccountCost at low pointOpen old templated, then change color palet to this sheet'sa.Cost at high pointCost at high pointInsert new header - change problem number and reformatVariable Cost per Unit=-=- =per unit.Units produced at high pointUnits produced at high pointCopy these formulas (column AD) to new sheet.--Units produced at low pointUnits produced at low pointUpdate to new edition's names and numbersCopy new error check formulas. For N-boxesTotal Fixed Costs= cpence: Calculate the total variable costs for either the high or the low point, and then subtract them from the total costs at that point.=IF(sol.!$C$5="OFF","",IF(AC25=""," ",IF(AC25<>sol.!AC25,"*"," ")))b.Total variable cost= cpence: Varibale cost per unit x the number of units.For B- BoxesFixed cost= cpence: Calculated above.=IF(sol.!$C$5="OFF","",IF(AC30<>sol.!AC30,"*"," "))Total cost=Copy Score formula from this template to new sheet.=IF(sol.!$C$5="OFF","","Score:")=IF(sol.!$C$5="OFF"," ",AD10)=IF(sol.!$C$5="OFF","","*Since some answer boxes are correct when left blank, the beginning score is greater than 0%.")
- 40. sol.Exercise 11-7* represents an incorrect N answer =COUNTIF(A14:H27,"~*")Name:SOLUTION0Section:" " represents an unanswered N box - counts as an incorrect. =COUNTIF(A14:H27," ")Score:See student sheet for student's score0Scoring:ON" " represents a correct blank answer or N answer =COUNTIF(A14:H27," ")4Total SUM(AV13:AV15)Instructions 4Answers are entered in the cells with gray backgrounds.Percentage =AD6/AD8Cells with non-gray backgrounds are protected and cannot be edited.100%A red asterisk (*) will appear below or immediately to the right of an incorrect answer.Notes:" " represents an unanswered N box - counts as an incorrect.Revenue per AccountCost at low pointOpen old templated, then change color palet to this sheet'sa.Cost at high pointCost at high pointInsert new header - change problem number and reformatVariable Cost per Unit=Cost at high point-Cost at low point=$2,110,000- $1,535,000=$ 23.00per unit.Units produced at high pointUnits produced at high pointCopy these formulas (column AD) to new sheet.Units produced at high point-Units produced at low point70,000-45,000Units produced at low pointUnits produced at low pointUpdate to new edition's names and numbersCopy new error check formulas. For N-boxesTotal Fixed Costs=$500,000 cpence: Calculate the total variable costs for either the high or the low point, and then subtract them from the total costs at that point.=IF(sol.!$C$5="OFF","",IF(AC25=""," ",IF(AC25<>sol.!AC25,"*"," ")))b.Total variable cost=$ 1,380,000 cpence: Varibale cost per unit x the number of units.For B- BoxesFixed cost=500,000
- 41. cpence: Calculated above.=IF(sol.!$C$5="OFF","",IF(AC30<>sol.!AC30,"*"," "))Total cost=$ 1,880,000Copy Score formula from this template to new sheet.=IF(sol.!$C$5="OFF","","Score:")=IF(sol.!$C$5="OFF"," ",AD10)=IF(sol.!$C$5="OFF","","*Since some answer boxes are correct when left blank, the beginning score is greater than 0%.") ✓ a. $23 per unit Zeta Inc. has decided to use the high-low method to estimate the total cost and the fixed and variable cost components of the total cost. The data for various levels of production are as follows: Units Produced Total Costs 45,000 $1,535,000 50,000 1,650,000 70,000 2,110,000 a. Determine the variable cost per unit and the fixed cost. b. Based on part (a), estimate the total cost for 60,000 units of production. (Warren 463) Warren, Carl S. Survey of Accounting, 6th Edition. Cengage Learning, 02/2012. VitalBook file. Pr. 11-6Problem 11-6* represents an incorrect N answer =COUNTIF(A14:H27,"~*")Name:0Section:" " represents an unanswered N box - counts as an incorrect. =COUNTIF(A14:H27," ")28Score:0%" " represents a correct blank answer or N answer =COUNTIF(A14:H27," ")0Key Code:2Total SUM(AV13:AV15)Instructions 28Answers are entered in the cells with gray backgrounds.Percentage =AD6/AD8Cells with non-gray backgrounds are protected and cannot be edited.0%A red
- 42. asterisk (*) will appear beside, above, or immediately below an incorrect answer.Notes:" " represents an unanswered N box - counts as an incorrect." " represents a correct blank answer or N answer1.Total number of answers = sum of aboveORGANIC HEALTH CARE PRODUCTS INC.Conditional formatting might be used but wasn't here, to hide some of the error check return symbols. If A1 = "~*", then font = red, if something else, then font = background color.Estimated Income StatementFor the Year Ending December 31, 2012Steps:SalesOpen this sheet and macro sheetCost of goods sold:Open old templated, then change color palet to this sheet'sDirect materialsInsert new header - change problem number and reformatDirect laborCopy these formulas (column AD) to new sheet.Factory overheadUpdate to new edition's names and numbersCost of goods soldCopy new error check formulas. For N-boxesGross profit=IF(sol.!$C$5="OFF","",IF(AC25=""," ",IF(AC25<>sol.!AC25,"*"," ")))Operating expenses:Selling expenses:Advertising Peggy Hussey: Enter all expenses as positive values. Sales salaries and commissionsFor B- BoxesTravel=IF(sol.!$C$5="OFF","",IF(AC30<>sol.!AC30,"*", " "))Miscellaneous selling expenseTotal selling expenses cpence: Enter a positive value.Copy Score formula from this template to new sheet.Administrative expenses:=IF(sol.!$C$5="OFF","","Score:")=IF(sol.!$C$5="OF F","",AD10)Office and officers' salaries cpence: Enter all expenses as positive values.Supplies=IF(sol.!$C$5="OFF","","*Since some answer boxes are correct when left blank, the beginning score is greater than 0%.")Miscellaneous administrative expenseTotal
- 43. administrative expenses cpence: Enter a positive value.Total expensesIncome from operations2.Contribution margin ratio = Peggy Hussey: Sales-= Craig Pence: The answer will appear when the correct amounts are entered into the formula. Peggy Hussey: Sales Peggy Hussey: Variable costs. Craig Pence: The answer will appear when the correct amounts are entered into the formula.3.Break-even sales (units) = = Craig Pence: The answer will appear when the correct amounts are entered into the formula. Craig Pence: Contribution margin per unit. Craig Pence: The answer will appear when the correct amounts are entered into the formula.Break-even sales (dollars) = = Craig Pence: The answer will appear when the correct amounts
- 44. are entered into the formula.sales Craig Pence: Contribution margin ratio.4.Use the Autoshapes line feature to construct a cost-volume-profit chart indicating the break-even point.Click and drag either of the lines to sketch the total revenue and total cost functions on the graph.This requirement is not automatically scored.$15,000,000$12,500,000$10,000,000$7,500,000$5,000,0 00$2,500,000$00100,000200,000300,000400,000500,000600,00 05.Margin of safety:Expected sales (in dollars)Break-even point (in dollars)Margin of safety (in dollars)orMargin of safety (in percent) = Peggy Hussey: Margin of safety (from above). Craig Pence: The answer will appear when the correct amounts are entered into the formula.= Craig Pence: The answer will appear when the correct amounts are entered into the formula. Peggy Hussey: Expected sales level. Craig Pence: The answer will appear when the correct amounts are entered into the formula. cpence: Enter all expenses as positive values.6.Operating leverage =
- 45. Peggy Hussey: Contribution margin = Craig Pence: The answer will appear when the correct amounts are entered into the formula. Peggy Hussey: Income from operations Craig Pence: The answer will appear when the correct amounts are entered into the formula. sol.Problem 11-6* represents an incorrect N answer =COUNTIF(A14:H27,"~*")Name:SOLUTION0Section:" " represents an unanswered N box - counts as an incorrect. =COUNTIF(A14:H27," ")Score:See student sheet for student's score0Scoring:ON" " represents a correct blank answer or N answer =COUNTIF(A14:H27," ")8Total SUM(AV13:AV15)Instructions 8Answers are entered in the cells with gray backgrounds.Percentage =AD6/AD8Cells with non-gray backgrounds are protected and cannot be edited.100%A red asterisk (*) will appear beside, above, or immediately below an incorrect answer.Notes:" " represents an unanswered N box - counts as an incorrect." " represents a correct blank answer or N answer1.Total number of answers = sum of aboveORGANIC HEALTH CARE PRODUCTS INC.Conditional formatting might be used but wasn't here, to hide some of the error check return symbols. If A1 = "~*", then font = red, if something else, then font = background color.Estimated Income StatementFor the Year Ending December 31, 2012Steps:Sales$ 10,000,000Open this sheet and macro sheetCost of goods sold:Open old
- 46. templated, then change color palet to this sheet'sDirect materials$3,200,000 cpence: Enter all expenses as positive values.Insert new header - change problem number and reformatDirect labor1,200,000Copy these formulas (column AD) to new sheet.Factory overhead800,000Update to new edition's names and numbersCost of goods sold5,200,000Copy new error check formulas. For N-boxesGross profit$ 4,800,000=IF(sol.!$C$5="OFF","",IF(AC25=""," ",IF(AC25<>sol.!AC25,"*"," ")))Operating expenses:Selling expenses:Sales salaries and commissions$1,450,000 Peggy Hussey: Enter all expenses as positive values. Advertising833,000For B- BoxesTravel340,000=IF(sol.!$C$5="OFF","",IF(AC30<>sol.!A C30,"*"," "))Miscellaneous selling expense42,000Total selling expenses$2,665,000 cpence: Enter a positive value.Copy Score formula from this template to new sheet.Administrative expenses:=IF(sol.!$C$5="OFF","","Score:")=IF(sol.!$C$5="OF F","",AD10)Office and officers' salaries$300,000 cpence: Enter all expenses as positive values.Supplies210,000=IF(sol.!$C$5="OFF","","*Since some answer boxes are correct when left blank, the beginning score is greater than 0%.")Miscellaneous administrative expense25,000Total administrative expenses535,000 cpence: Enter a positive value.Total expenses3,200,000Income
- 47. from operations$ 1,600,0002.Contribution margin ratio = $10,000,000 Peggy Hussey: Sales-$6,000,000 Peggy Hussey: Variable costs.=40.0% Craig Pence: The answer will appear when the correct amounts are entered into the formula.$10,000,000 Peggy Hussey: Sales Peggy Hussey: Variable costs. Craig Pence: The answer will appear when the correct amounts are entered into the formula.3.Break-even sales (units) = $2,400,000=240,000 Craig Pence: The answer will appear when the correct amounts are entered into the formula.units$10 Craig Pence: Contribution margin per unit. Craig Pence: The answer will appear when the correct amounts are entered into the formula.Break-even sales (dollars) = $2,400,000=$ 6,000,000
- 48. Craig Pence: The answer will appear when the correct amounts are entered into the formula.sales40% Craig Pence: Contribution margin ratio.4.Use the Autoshapes feature on the menu bar at the bottom of the screen to construct a cost-volume-profit chart indicating the break-even point.Click on "AutoShapes," then select the "lines" option. Use the straight line function to sketch the total revenue and total cost functions.$15,000,000$12,500,000Operating Profit Area$10,000,000Break-Even Point$7,500,000$5,000,000$2,500,000Operating Loss area$00100,000200,000300,000400,000500,000600,0005.Margi n of safety:Expected sales (in dollars)$ 10,000,000Break-even point (in dollars)6,000,000Margin of safety (in dollars)$ 4,000,000orMargin of safety (in percent) =$4,000,000 Peggy Hussey: Margin of safety (from above). Craig Pence: The answer will appear when the correct amounts are entered into the formula.=40.0% Craig Pence: The answer will appear when the correct amounts are entered into the formula.$10,000,000 Peggy Hussey: Expected sales level. Craig Pence: The answer will appear when the correct amounts are entered into the formula.
- 49. cpence: Enter all expenses as positive values.6.Operating leverage =$4,000,000 Peggy Hussey: Contribution margin =2.5 Craig Pence: The answer will appear when the correct amounts are entered into the formula.$1,600,000 Peggy Hussey: Income from operations Craig Pence: The answer will appear when the correct amounts are entered into the formula. leverage Organic Health Care Products Inc. expects to maintain the same inventories at the end of 2012 as at the beginning of the year. The total of all production costs for the year is therefore assumed to be equal to the cost of goods sold. With this in mind, the various department heads were asked to submit estimates of the costs for their departments during 2012. A summary report of these estimates is as follows: It is expected that 400,000 units will be sold at a price of $25 a unit. Maximum sales within the relevant range are 500,000 units. Instructions 1. Prepare an estimated income statement for 2012. 2. What is the expected contribution margin ratio?
- 50. 3. Determine the break-even sales in units. 4. Construct a cost-volume-profit chart indicating the break- even sales. 5. What is the expected margin of safety in dollars and as a percentage of sales? 6. Determine the operating leverage. (Warren 472) Warren, Carl S. Survey of Accounting, 6th Edition. Cengage Learning, 02/2012. VitalBook file.