
Recommended
More Related Content
What's hot
What's hot (20)
Similar to HDAVID2016_UCLEADS
Similar to HDAVID2016_UCLEADS (20)
HDAVID2016_UCLEADS
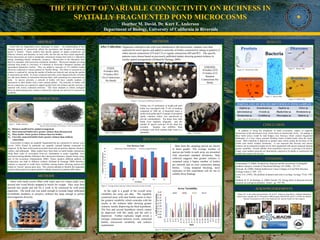
- 1. THE EFFECT OF VARIABLE CONNECTIVITY ON RICHNESS IN SPATIALLY FRAGMENTED POND MICROCOSMS Heather M. David, Dr. Kurt E. Anderson Department of Biology, University of California in Riverside ABSTRACT INTRODUCTION Food webs are fragmented across landscapes in nature. An understanding of how changing patterns of connectivity affects the persistence and dynamics of interacting species is limited. Theory predicts that specific patterns of spatial connectivity can influence richness and dynamics in food webs, but this has not been tested empirically. Protist microcosms are used to manipulate connections among food webs in a laboratory setting, simulating natural community dynamics. Microcosms in the laboratory have shown to reproduce wild ecosystem community dynamics. Microcosm samples are being collected from ponds in University of California at Riverside’s Botanical Gardens and Agricultural Operations Facility. They are added to networks of 175 milliliter bottles which are connected in various patterns by flexible tubing. The effect of connectivity on richness is explored by varying the number of bottles per network and varying the number of connections per bottle. In evenly connected networks, circle shaped networks of bottles have the same number of connections between them, each containing two connections per bottle. In uneven networks, a network of bottles will have variable numbers of connections to other bottles with a more random pattern. The networks of bottles with uneven connections are expected to support greater food web richness and the converse is expected with evenly connected networks. This study attempts to inform ecological theory by demonstrating how richness is affected by network size and level of connectivity variability. Figure 2: The protist Tetrahymena hunts E. coli in this photo illustration, which features a microscope image of Tetrahymena. Credit: University at Buffalo METHODS RESULTS ACKNOWLEDGEMENTS “Thank you” to the entities pictured below, Dr. Kurt E. Anderson, Sean Hayes, Ashkaan Fahimipour, Maria Franco-Aguilar, the UC Riverside CAMP program, HSI-STEM, and UC LEADS, the Student Veterans Association as well as the Anderson Lab and my Family for their support. CITATIONS Organisms collected in the wild were transferred to lab microcosms, samples were then analyzed for novel species and added to networks of bottles connected by tubing in patterns of either uneven connections (U9 and U5) or regular connections (R9 and R5). The specific patterns were chosen based on previously published studies showing greatest richness in similar spatial arrangements (Holland & Hastings 2008). EVEN: •9 bottles (R9) •5 bottles (R5) Two Connections Per Bottle UNEVEN: •9 bottles (U9) •5 bottles (U5) Random Connections Per Bottle Ecosystems in nature are spatially fragmented but are connected in various ways (Levin 1992). Ponds in particular are spatially isolated habitats connected by dispersal. At the base of the pond ecosystem food web are protists, diatoms, bacteria, rotifers, and arthropods. Many studies have been done on multi-trophic interactions using these types of ecosystems however, information is scarce regarding how movement among habitats influences their interaction dynamics, despite being a large part of the ecosystem (Amarasekare 2006). Theory predicts different patterns of connections can lead to different richness (Holland & Hastings 2008) therefore, richness is expected to result from variability among bottles, allowing species-rich bottles to “rescue” species-poor ones. This project attempts to identify the organisms living in these pond ecosystems and how habitat connectivity patterns affect them. Tubing was 14 centimeters in length and each bottle was inoculated with 75 mL of medium composed of 1400 mL of deionized water, a protist food pellet and 0.14 grams of powdered reptile vitamins which was autoclaved to prevent contamination. Ten drops from each bottle were regularly aliquoted and the number of species seen per 20 mL drop was recorded. Regular one milliliter fluid exchanges with fresh medium kept waste to a minimum. Levin, S.A. (1992). The problem of pattern and scale in ecology. Ecology 73 (6): 1943- 1976. Amarasekare, P. (2006). Productivity, dispersal and the coexistence of intraguild predators and prey. Journal of Theoretical Biology 243 (2006): 121-133. Holyoak, M. (2000). Habitat Subdivision Causes Changes in Food Web Structure. Ecology Letters 3: 509 - 515. Holland, M. D., & Hastings, A. (2008, October 19). Strong effect of dispersal network structure on ecological dynamics. Nature , pp. 792-794. METHODS RESULTS/DISCUSSION CONCLUSION In addition to being the foundation of pond ecosystems, studies of organism interactions at the microscopic level, mirror those at macroscopic levels. An analogy to these bottle arrays would be land bridges over freeways which connect fragmented landscapes, or a river whose seasonal flooding creates isolated ponds when the waters recede. Both contribute to dispersal at random times which sustain the diversity of life within each mostly isolated community. It was expected that diversity and species richness can be sustained at higher levels when augmented with species dispersal keeping greater variability. Overall stability from asynchrony however, is proving to be elusive. Larger, more random networks are theoretically expected to be harder to synchronize but initially this seems to be not true. PARTIAL LIST OF SPECIES IDENTIFIED IN POND SAMPLES Euglena sp. Scenedesmus sp. Euplotes sp. Volvox sp. Spirostomum sp. Urostyla sp. Blepharisma sp. Tetrahymena sp. Paramecium sp. Cyclidium sp. Pleurosigma sp. Halteria sp. Tubes with mesh covers filled with water and two wheat seeds were secured into wood blocks strapped to bricks for weight. They were then inserted into ponds and left for a week to be colonized by wild pond organisms. The mesh size was small enough to exclude larger arthropod invertebrate predators to preserve richness but large enough to permit microorganism diversity. Data from the sampling period are shown in these graphs. The average number of species per bottle in each array are presented with associated standard deviations. Data collected suggests that greater richness is sustained using a higher number of bottles per network and an even connection among bottles. Using temporal blocking, more replicates of this experiment will be run to solidify these findings. 0 2 4 6 8 10 12 14 16 18 20 C1 C2 U9 U5 R9 R5 NumberofObservedSpecies Treatment Time Richness Table Maximum Observed Richness Time-averaged Richness 0.00 0.05 0.10 0.15 0.20 0.25 0.30 0.35 0.40 0.45 J-31 A-3 A-4 A-5 A-6 A-7 A-10 A-11 A-12 A-14 A-17 A-19 A-20 A-21 A-24 A-26 A-28 S-4 S-9 S-11 S-16 CoefficientofVariation Date Array Variability R5 R9 U5 U9 Figure 9: Variability of each bottle over time. Figure 8: Average richness and max richness observed over time by bottle. Figure 5: Four arrays of differing connectivity. Figure 6: Prepping bottles. Figure 7: The arrays. Figure 3: Sample collection tubes. Figure 4: Sample collecting. At the right is a graph of the overall array variability per array, per date. The regularly connected array with nine bottles seems to have the greatest variability which coincides with the results in the richness table showing greater richness, mostly disproving the third hypothesis. The first and second hypothesis clearly cannot be disproved with this study and the null is disproved. Further replicates might reveal a stronger connection between evenly connected bottles, microcosm variability, and richness sustainment. Figure 10: Ciliate Protist 100x Figure 14: Rotifer 100xFigure 12: Cyclops 100x Figure 11: Diatom 100x Figure 13: Bacteria 400x Table 1: Species Identification List. Ho: Richness unaffected by spatial arrangement. H1: Interconnected bottles have greater richness than disconnected. H2: More bottles foster greater richness than less bottles. H3: Unevenly connected bottles foster greater richness than uniform connections. Figure 1: Sample collection.