SlideShare a Scribd company logo
1 of 1
Download to read offline
PREDICTING WARMING EFFECTS ON STREAM CARBON LOSS
USING LITTER BREAKDOWN RATES FROM THE COWEETA BASIN
Garrett Frandson1,2, Phillip Bumpers1, Amy Rosemond1, Seth Wenger1 , and Morgan Bettcher1
1Odum School of Ecology, University of Georgia, Athens, GA 30602
2Coweeta 2016 summer REU student, University of Central Arkansas, Conway, AR 72032
BACKGROUND
METHODS
ACKNOWLEDGEMENTS
DISCUSSION
REFERENCES
NSF Research Experience for Undergraduates awarded through
the Coweeta LTER program. Thanks to Kait Farrell, Chao Song,
and David Manning for aid in statistical analyses and
interpretations.
1. Wallace, J.B.; Eggert, S.L.; Meyer, J.L.; and Webster, J.R. (1997). Multiple
trophic levels of a forest stream linked to terrestrial litter inputs. Science. 277,
102-104.
2. Boyero et al. (2001). A global experiment suggests climate warming will not
accelerate litter decomposition in streams but might reduce carbon
sequestration. Ecology Letters. 14, 289-294.
3. Benstead, J.P. and Huryn, A.D. (2011). Extreme seasonality of litter
breakdown in an arctic spring-fed stream is driven by shredder phenology, not
temperature. Freshwater Biology. 56, 2034-2044.
4. Hieber, M. and Gessner, M.O. (2002). Contribution of stream detrivores, fungi,
and bacteria to leaf breakdown based on biomass estimates. Ecology. 83(4),
1026-1038.
5. Brown, J.H. et al. (2004). Toward a metabolic theory of ecology. Ecology.
85(7), 1771-1789.
6. Benfield, E.F. (2007). Decomposition of leaf material. Pp. 711-720. In: Hauer
and Lamberti (Ed.s) Methods in Stream Ecology, Academic Press.
RESULTS
STUDY SITE
HYPOTHESES
• The slope the log of breakdown rate as a function of inverse
temperature (1/kT where k is Boltzmann’s constant and T is in
Kelvin) should align with the activation energy’s range of values
(0.6-0.7 eV5) predicted by the MTE.
• Shredder breakdown rates will decrease with increasing water
temperature due to being cold-adapted and temperature-sensitive
organisms2.
• Microbial breakdown rates will increase with increasing water
temperatures as the additional heat drives faster enzymatic
activity5.
• Decomposition rates will be higher in Acer samples than in
Rhododendron samples due to Rhododendron leaves being of
tougher structure.
• Stream water temperatures are predicted to increase with
predicted trends in land use and air temperature increases.
• Headwater streams are crucial to aquatic ecosystems and the
global carbon cycle due to their processing of terrestrial carbon
inputs, primarily leaf litter, and their transport of foodweb-
supporting carbon to downstream systems1,2. Understanding the
effects of increasing stream water temperatures is thus crucial to
understanding large-scale ecosystem effects of climate change.
• The biological decomposition of leaf litter in streams is due to
shredding macroinvertebrates, fungi, and bacteria with the
macroinvertebrates and fungi contributing most3,4.
• The metabolic theory of ecology (MTE) may be used to make
predictions about the relationship between temperature and the
rates of many biological processes5, here specifically litter
breakdown.
• Examining leaf litter processing rates along a gradient of
temperature caused by seasonal progression and differences in
elevation, aspect, and shade should provide insight into expected
aquatic carbon processing responses to increasing stream water
temperatures.
Stream Mean Water Temperature (°C)
1: Albert Branch 15.81
2: Pinnacle Branch 15.84
3: Bee Branch 15.98
4: Big Hurricane Branch 16.28
5: Shope Branch 16.77
6: Copper Branch 16.41
7: Shope Fork (Forest) 17.22
8: Shope Fork (Gap) 17.24
9: Carpenter Branch 16.96
10: Sawmill Branch 17.99
11: Hugh White Creek 17.47
12: Upper Ball Creek 15.79
Athens: Tallassee Creek 23.09
Athens: Turkey Creek 23.07
Athens: Brooklyn Creek 22.16
Athens: Brickyard Creek 23.84
• Leaf packs consisting of 5.0 ± 0.1 grams of a fast-decaying (Acer
rubrum) or a slow-decaying (Rhododendron maximum) species
were deployed at 12 sites at the Coweeta Hydrologic Laboratory.
Two deployments were made, 4 replicate packs per site. Onset
HOBO Pendant water temperature and lux recorders were also
deployed with each leaf pack set on June 6, 2016. We contrasted
the response of breakdown with coarse mesh (including
invertebrates) and fine mesh (microbial breakdown only).
• The process was also conducted once with Acer leaves in four
streams in Athens, Georgia.
• Leaf packs were
retrieved approximately
six weeks after
deployment, and
recorders’ data were
downloaded. Packs
were kept on ice until
laboratory processing.
• Leaf packs were
processed and ash-free
• The expected negative relationship between temperature and
breakdown rate was at least suggested as a trend in all three
comparisons.
• The negative relationship and trends between 1/kT and
ln (breakdown rate) are equivalent to positive relationships and
trends between temperature and breakdown rate and
represented more than a doubling of breakdown rate across
Coweeta streams across a gradient of ~2oC.
• Rhododendron breakdown was slower than Acer but responses
to temperature were similar between the two species.
• There was a positive relationship between 1/kT and ln
(breakdown rate) for the coarse Acer leaves of deployment A but
not B. This was potentially due to the bags of deployment A
experiencing more burials which may lead to less colonization
and lower breakdown rates. Notably, three of the streams’ bags
with the lowest breakdown rates also had heavy burials.
Macroinvertebrate data was collected from only deployment A,
thus these burials confounded shredder response analysis.
Implications and next steps
• Steeper slopes in the relationships between breakdown and
temperature indicate greater effects on breakdown rates than
would predicted from MTE. Both our empirical data and MTE
predict faster losses of carbon via breakdown with increased
temperature.
• In our study, relatively high variability in breakdown rates resulted
in large confidence intervals; additional data (seasonal) will be
collected in the future to attempt to more accurately predict
temperature effects on breakdown.
• The contrast with streams in a more disturbed environment
(Athens, GA) gives insights into other aspects of temperature
effects. Slopes between breakdown and temperature were less
steep with inclusion of Athens data – indicating potentially
suppressed biological activity in disturbed streams.
• Future work may extend the duration of the study, increase the
number of bags in a deployment, capture and incorporate
dissolved nutrient and contaminant data, and deploy bags such
that depositional burials are less common.
Subset Slope
Figure
Intercept
Overall
Model’s
𝐑 𝟐
Figure
1
C. A.
-2.085
-3.673
0.363
C. R. -4.888
Figure
2
F. A.
-1.366
-4.315
0.459
F. R. -4.4842
Figure
3
C. A.
-0.512
-3.646
0.211
F. A. -4.096
Figure 2. The log of fine mesh breakdown rate against 1/kT
showed no significant relationship but a negative trend with
p=0.080. There was a significant effect of litter species on
breakdown rate. Slope is less steep (-1.37) than coarse mesh
but also steeper than MTE prediction; the 95% confidence
interval is large (-2.913 to 0.180).
Figure 3. We used sites in Athens, GA to extend the
temperature and in-stream condition range of our data. The log
of breakdown rate against 1/kT was statistically significant
(p=0.022); the slope (-0.51) was less steep than MTE prediction.
There was a significant effect of mesh size on breakdown rate.
Table 1 : Summary table of values for Figures 1-3. The
subsets are, respectively, coarse Acer, coarse
Rhododendron, fine Acer, fine Rhododendron, coarse
Acer, and fine Acer.
Figure 1. The log of coarse mesh breakdown rate plotted
against 1/kT showed no significant relationship but a trend
with p=0.077. There was a significant effect of litter species
on breakdown rate. Slope is steeper (-2.08) than MTE
prediction, (ca. -0.6); the 95% confidence interval is large
(-4.414 to 0.244).
dry mass calculations were done as per
standard methods6.
• Slopes between breakdown and temperature were compared to the
linear Arrhenius equation to assess whether empirical data matched
predictions from MTE.
Coweeta – Total breakdown Coweeta – Microbial breakdown
Coweeta – Athens
Total, microbial breakdown

More Related Content

What's hot

Beazer Mps Presentation Agency Support
Beazer Mps Presentation Agency SupportBeazer Mps Presentation Agency Support
Beazer Mps Presentation Agency SupportNeale Misquitta
 
Dr. Jack Morgan - Grazinglands and Global Climate Change: What is the Science...
Dr. Jack Morgan - Grazinglands and Global Climate Change: What is the Science...Dr. Jack Morgan - Grazinglands and Global Climate Change: What is the Science...
Dr. Jack Morgan - Grazinglands and Global Climate Change: What is the Science...John Blue
 
Biogeography Critique #1
Biogeography Critique #1Biogeography Critique #1
Biogeography Critique #1Matthew Highnam
 
Since the introduction of co2
Since the introduction of co2Since the introduction of co2
Since the introduction of co2Attili1996
 
11.[11 13]the length weight relationship of a riverine fish chela bacaila
11.[11 13]the length weight relationship of a riverine fish  chela bacaila11.[11 13]the length weight relationship of a riverine fish  chela bacaila
11.[11 13]the length weight relationship of a riverine fish chela bacailaAlexander Decker
 
11.[11 13]the length weight relationship of a riverine fish chela bacaila - ...
11.[11 13]the length weight relationship of a riverine fish  chela bacaila - ...11.[11 13]the length weight relationship of a riverine fish  chela bacaila - ...
11.[11 13]the length weight relationship of a riverine fish chela bacaila - ...Alexander Decker
 
The length weight relationship of a riverine fish chela bacaila
The length weight relationship of a riverine fish  chela bacailaThe length weight relationship of a riverine fish  chela bacaila
The length weight relationship of a riverine fish chela bacailaAlexander Decker
 
Ecology Arthropod Project FINAL
Ecology Arthropod Project FINALEcology Arthropod Project FINAL
Ecology Arthropod Project FINALemilykersting91
 
Uppgaard EWI 5_6_16final
Uppgaard EWI 5_6_16finalUppgaard EWI 5_6_16final
Uppgaard EWI 5_6_16finalAnders Uppgaard
 
Thesis_Presentation
Thesis_PresentationThesis_Presentation
Thesis_Presentationlelevrushali
 
Size Distribution of Swiss Cheese Features (SCFs) on Mars
Size Distribution of Swiss Cheese Features (SCFs) on MarsSize Distribution of Swiss Cheese Features (SCFs) on Mars
Size Distribution of Swiss Cheese Features (SCFs) on MarsÜlger Ahmet
 
Decadal variability in tree rings
Decadal variability in tree ringsDecadal variability in tree rings
Decadal variability in tree ringsScott St. George
 
Scour Sensor_CarlyRobbins_RACC
Scour Sensor_CarlyRobbins_RACCScour Sensor_CarlyRobbins_RACC
Scour Sensor_CarlyRobbins_RACCCarly Robbins
 
11.relation between some metrological parameters in ilorin,
11.relation between some metrological parameters in ilorin,11.relation between some metrological parameters in ilorin,
11.relation between some metrological parameters in ilorin,Alexander Decker
 
Cv100705
Cv100705Cv100705
Cv100705spears9
 
Guarding against false discovery in large-scale dendroclimatology
Guarding against false discovery in large-scale dendroclimatologyGuarding against false discovery in large-scale dendroclimatology
Guarding against false discovery in large-scale dendroclimatologyScott St. George
 

What's hot (20)

Beazer Mps Presentation Agency Support
Beazer Mps Presentation Agency SupportBeazer Mps Presentation Agency Support
Beazer Mps Presentation Agency Support
 
Dr. Jack Morgan - Grazinglands and Global Climate Change: What is the Science...
Dr. Jack Morgan - Grazinglands and Global Climate Change: What is the Science...Dr. Jack Morgan - Grazinglands and Global Climate Change: What is the Science...
Dr. Jack Morgan - Grazinglands and Global Climate Change: What is the Science...
 
Biogeography Critique #1
Biogeography Critique #1Biogeography Critique #1
Biogeography Critique #1
 
Since the introduction of co2
Since the introduction of co2Since the introduction of co2
Since the introduction of co2
 
11.[11 13]the length weight relationship of a riverine fish chela bacaila
11.[11 13]the length weight relationship of a riverine fish  chela bacaila11.[11 13]the length weight relationship of a riverine fish  chela bacaila
11.[11 13]the length weight relationship of a riverine fish chela bacaila
 
11.[11 13]the length weight relationship of a riverine fish chela bacaila - ...
11.[11 13]the length weight relationship of a riverine fish  chela bacaila - ...11.[11 13]the length weight relationship of a riverine fish  chela bacaila - ...
11.[11 13]the length weight relationship of a riverine fish chela bacaila - ...
 
The length weight relationship of a riverine fish chela bacaila
The length weight relationship of a riverine fish  chela bacailaThe length weight relationship of a riverine fish  chela bacaila
The length weight relationship of a riverine fish chela bacaila
 
Ecology Arthropod Project FINAL
Ecology Arthropod Project FINALEcology Arthropod Project FINAL
Ecology Arthropod Project FINAL
 
Uppgaard EWI 5_6_16final
Uppgaard EWI 5_6_16finalUppgaard EWI 5_6_16final
Uppgaard EWI 5_6_16final
 
Thesis_Presentation
Thesis_PresentationThesis_Presentation
Thesis_Presentation
 
Size Distribution of Swiss Cheese Features (SCFs) on Mars
Size Distribution of Swiss Cheese Features (SCFs) on MarsSize Distribution of Swiss Cheese Features (SCFs) on Mars
Size Distribution of Swiss Cheese Features (SCFs) on Mars
 
Decadal variability in tree rings
Decadal variability in tree ringsDecadal variability in tree rings
Decadal variability in tree rings
 
OzFlux presentation
OzFlux presentationOzFlux presentation
OzFlux presentation
 
Scour Sensor_CarlyRobbins_RACC
Scour Sensor_CarlyRobbins_RACCScour Sensor_CarlyRobbins_RACC
Scour Sensor_CarlyRobbins_RACC
 
11.relation between some metrological parameters in ilorin,
11.relation between some metrological parameters in ilorin,11.relation between some metrological parameters in ilorin,
11.relation between some metrological parameters in ilorin,
 
fall2016_symposium2
fall2016_symposium2fall2016_symposium2
fall2016_symposium2
 
Methane and natural_gas_exposure_limits.771
Methane and natural_gas_exposure_limits.771Methane and natural_gas_exposure_limits.771
Methane and natural_gas_exposure_limits.771
 
Cv100705
Cv100705Cv100705
Cv100705
 
poster final
poster finalposter final
poster final
 
Guarding against false discovery in large-scale dendroclimatology
Guarding against false discovery in large-scale dendroclimatologyGuarding against false discovery in large-scale dendroclimatology
Guarding against false discovery in large-scale dendroclimatology
 

Similar to Frandson Coweeta LTER Summer Symposium poster

2014-AGU_poster_ver9
2014-AGU_poster_ver92014-AGU_poster_ver9
2014-AGU_poster_ver9Shannan Sweet
 
2014-AGU_poster_ver9
2014-AGU_poster_ver92014-AGU_poster_ver9
2014-AGU_poster_ver9Shannan Sweet
 
Goldschmidt Conference Abstract 2010
Goldschmidt Conference Abstract 2010Goldschmidt Conference Abstract 2010
Goldschmidt Conference Abstract 2010Christine A. Waters
 
Hidrodinamica Cardoso&motta marques 2009aeco
Hidrodinamica Cardoso&motta marques 2009aecoHidrodinamica Cardoso&motta marques 2009aeco
Hidrodinamica Cardoso&motta marques 2009aecoCaline Gally
 
Historical biogeography and diversification in Sisyrinchium (Iridaceae)
Historical biogeography and diversification in Sisyrinchium (Iridaceae) Historical biogeography and diversification in Sisyrinchium (Iridaceae)
Historical biogeography and diversification in Sisyrinchium (Iridaceae) Verônica Thode
 
Peatnet - 2nd International Symposium Peatlands in the Global Carbon Cycle (2...
Peatnet - 2nd International Symposium Peatlands in the Global Carbon Cycle (2...Peatnet - 2nd International Symposium Peatlands in the Global Carbon Cycle (2...
Peatnet - 2nd International Symposium Peatlands in the Global Carbon Cycle (2...Courtney Miller
 
Science Publication: Many Risky Feedback Loops amplify the need for Climate A...
Science Publication: Many Risky Feedback Loops amplify the need for Climate A...Science Publication: Many Risky Feedback Loops amplify the need for Climate A...
Science Publication: Many Risky Feedback Loops amplify the need for Climate A...Energy for One World
 
impactos del cambio climatico en ecosistemas costeros
 impactos del cambio climatico en ecosistemas costeros impactos del cambio climatico en ecosistemas costeros
impactos del cambio climatico en ecosistemas costerosXin San
 
Transpiration_Adaptation_Time_Periods_.pdf
Transpiration_Adaptation_Time_Periods_.pdfTranspiration_Adaptation_Time_Periods_.pdf
Transpiration_Adaptation_Time_Periods_.pdfLeonid Ledata
 
Biomass partitioning, leaf area index, and canopy greenness: the Good, the BA...
Biomass partitioning, leaf area index, and canopy greenness: the Good, the BA...Biomass partitioning, leaf area index, and canopy greenness: the Good, the BA...
Biomass partitioning, leaf area index, and canopy greenness: the Good, the BA...remkoduursma
 
Undergraduate Research Poster
Undergraduate Research PosterUndergraduate Research Poster
Undergraduate Research PosterParker Malek
 
Investigation06 en
Investigation06 enInvestigation06 en
Investigation06 enmcnewbold
 
Primer-directed enzymatic amplification of DNA with a thermostable DNA polyme...
Primer-directed enzymatic amplification of DNA with a thermostable DNA polyme...Primer-directed enzymatic amplification of DNA with a thermostable DNA polyme...
Primer-directed enzymatic amplification of DNA with a thermostable DNA polyme...José Luis Moreno Garvayo
 
LAB NAME3Lab Number ____Your NameProfe.docx
LAB NAME3Lab Number ____Your NameProfe.docxLAB NAME3Lab Number ____Your NameProfe.docx
LAB NAME3Lab Number ____Your NameProfe.docxsmile790243
 

Similar to Frandson Coweeta LTER Summer Symposium poster (20)

2014-AGU_poster_ver9
2014-AGU_poster_ver92014-AGU_poster_ver9
2014-AGU_poster_ver9
 
2014-AGU_poster_ver9
2014-AGU_poster_ver92014-AGU_poster_ver9
2014-AGU_poster_ver9
 
#1
#1#1
#1
 
Mallick_et_al_HESS_2016
Mallick_et_al_HESS_2016Mallick_et_al_HESS_2016
Mallick_et_al_HESS_2016
 
Goldschmidt Conference Abstract 2010
Goldschmidt Conference Abstract 2010Goldschmidt Conference Abstract 2010
Goldschmidt Conference Abstract 2010
 
Hidrodinamica Cardoso&motta marques 2009aeco
Hidrodinamica Cardoso&motta marques 2009aecoHidrodinamica Cardoso&motta marques 2009aeco
Hidrodinamica Cardoso&motta marques 2009aeco
 
RPuta_UWP_PURF
RPuta_UWP_PURFRPuta_UWP_PURF
RPuta_UWP_PURF
 
Historical biogeography and diversification in Sisyrinchium (Iridaceae)
Historical biogeography and diversification in Sisyrinchium (Iridaceae) Historical biogeography and diversification in Sisyrinchium (Iridaceae)
Historical biogeography and diversification in Sisyrinchium (Iridaceae)
 
Riverine thermal regimes
Riverine thermal regimesRiverine thermal regimes
Riverine thermal regimes
 
Peatnet - 2nd International Symposium Peatlands in the Global Carbon Cycle (2...
Peatnet - 2nd International Symposium Peatlands in the Global Carbon Cycle (2...Peatnet - 2nd International Symposium Peatlands in the Global Carbon Cycle (2...
Peatnet - 2nd International Symposium Peatlands in the Global Carbon Cycle (2...
 
Science Publication: Many Risky Feedback Loops amplify the need for Climate A...
Science Publication: Many Risky Feedback Loops amplify the need for Climate A...Science Publication: Many Risky Feedback Loops amplify the need for Climate A...
Science Publication: Many Risky Feedback Loops amplify the need for Climate A...
 
SeniorThesis
SeniorThesisSeniorThesis
SeniorThesis
 
impactos del cambio climatico en ecosistemas costeros
 impactos del cambio climatico en ecosistemas costeros impactos del cambio climatico en ecosistemas costeros
impactos del cambio climatico en ecosistemas costeros
 
Transpiration_Adaptation_Time_Periods_.pdf
Transpiration_Adaptation_Time_Periods_.pdfTranspiration_Adaptation_Time_Periods_.pdf
Transpiration_Adaptation_Time_Periods_.pdf
 
Biomass partitioning, leaf area index, and canopy greenness: the Good, the BA...
Biomass partitioning, leaf area index, and canopy greenness: the Good, the BA...Biomass partitioning, leaf area index, and canopy greenness: the Good, the BA...
Biomass partitioning, leaf area index, and canopy greenness: the Good, the BA...
 
Undergraduate Research Poster
Undergraduate Research PosterUndergraduate Research Poster
Undergraduate Research Poster
 
Investigation06 en
Investigation06 enInvestigation06 en
Investigation06 en
 
Primer-directed enzymatic amplification of DNA with a thermostable DNA polyme...
Primer-directed enzymatic amplification of DNA with a thermostable DNA polyme...Primer-directed enzymatic amplification of DNA with a thermostable DNA polyme...
Primer-directed enzymatic amplification of DNA with a thermostable DNA polyme...
 
FrankeO final poster
FrankeO final posterFrankeO final poster
FrankeO final poster
 
LAB NAME3Lab Number ____Your NameProfe.docx
LAB NAME3Lab Number ____Your NameProfe.docxLAB NAME3Lab Number ____Your NameProfe.docx
LAB NAME3Lab Number ____Your NameProfe.docx
 

Frandson Coweeta LTER Summer Symposium poster

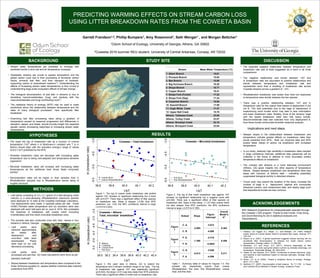
  • 1. PREDICTING WARMING EFFECTS ON STREAM CARBON LOSS USING LITTER BREAKDOWN RATES FROM THE COWEETA BASIN Garrett Frandson1,2, Phillip Bumpers1, Amy Rosemond1, Seth Wenger1 , and Morgan Bettcher1 1Odum School of Ecology, University of Georgia, Athens, GA 30602 2Coweeta 2016 summer REU student, University of Central Arkansas, Conway, AR 72032 BACKGROUND METHODS ACKNOWLEDGEMENTS DISCUSSION REFERENCES NSF Research Experience for Undergraduates awarded through the Coweeta LTER program. Thanks to Kait Farrell, Chao Song, and David Manning for aid in statistical analyses and interpretations. 1. Wallace, J.B.; Eggert, S.L.; Meyer, J.L.; and Webster, J.R. (1997). Multiple trophic levels of a forest stream linked to terrestrial litter inputs. Science. 277, 102-104. 2. Boyero et al. (2001). A global experiment suggests climate warming will not accelerate litter decomposition in streams but might reduce carbon sequestration. Ecology Letters. 14, 289-294. 3. Benstead, J.P. and Huryn, A.D. (2011). Extreme seasonality of litter breakdown in an arctic spring-fed stream is driven by shredder phenology, not temperature. Freshwater Biology. 56, 2034-2044. 4. Hieber, M. and Gessner, M.O. (2002). Contribution of stream detrivores, fungi, and bacteria to leaf breakdown based on biomass estimates. Ecology. 83(4), 1026-1038. 5. Brown, J.H. et al. (2004). Toward a metabolic theory of ecology. Ecology. 85(7), 1771-1789. 6. Benfield, E.F. (2007). Decomposition of leaf material. Pp. 711-720. In: Hauer and Lamberti (Ed.s) Methods in Stream Ecology, Academic Press. RESULTS STUDY SITE HYPOTHESES • The slope the log of breakdown rate as a function of inverse temperature (1/kT where k is Boltzmann’s constant and T is in Kelvin) should align with the activation energy’s range of values (0.6-0.7 eV5) predicted by the MTE. • Shredder breakdown rates will decrease with increasing water temperature due to being cold-adapted and temperature-sensitive organisms2. • Microbial breakdown rates will increase with increasing water temperatures as the additional heat drives faster enzymatic activity5. • Decomposition rates will be higher in Acer samples than in Rhododendron samples due to Rhododendron leaves being of tougher structure. • Stream water temperatures are predicted to increase with predicted trends in land use and air temperature increases. • Headwater streams are crucial to aquatic ecosystems and the global carbon cycle due to their processing of terrestrial carbon inputs, primarily leaf litter, and their transport of foodweb- supporting carbon to downstream systems1,2. Understanding the effects of increasing stream water temperatures is thus crucial to understanding large-scale ecosystem effects of climate change. • The biological decomposition of leaf litter in streams is due to shredding macroinvertebrates, fungi, and bacteria with the macroinvertebrates and fungi contributing most3,4. • The metabolic theory of ecology (MTE) may be used to make predictions about the relationship between temperature and the rates of many biological processes5, here specifically litter breakdown. • Examining leaf litter processing rates along a gradient of temperature caused by seasonal progression and differences in elevation, aspect, and shade should provide insight into expected aquatic carbon processing responses to increasing stream water temperatures. Stream Mean Water Temperature (°C) 1: Albert Branch 15.81 2: Pinnacle Branch 15.84 3: Bee Branch 15.98 4: Big Hurricane Branch 16.28 5: Shope Branch 16.77 6: Copper Branch 16.41 7: Shope Fork (Forest) 17.22 8: Shope Fork (Gap) 17.24 9: Carpenter Branch 16.96 10: Sawmill Branch 17.99 11: Hugh White Creek 17.47 12: Upper Ball Creek 15.79 Athens: Tallassee Creek 23.09 Athens: Turkey Creek 23.07 Athens: Brooklyn Creek 22.16 Athens: Brickyard Creek 23.84 • Leaf packs consisting of 5.0 ± 0.1 grams of a fast-decaying (Acer rubrum) or a slow-decaying (Rhododendron maximum) species were deployed at 12 sites at the Coweeta Hydrologic Laboratory. Two deployments were made, 4 replicate packs per site. Onset HOBO Pendant water temperature and lux recorders were also deployed with each leaf pack set on June 6, 2016. We contrasted the response of breakdown with coarse mesh (including invertebrates) and fine mesh (microbial breakdown only). • The process was also conducted once with Acer leaves in four streams in Athens, Georgia. • Leaf packs were retrieved approximately six weeks after deployment, and recorders’ data were downloaded. Packs were kept on ice until laboratory processing. • Leaf packs were processed and ash-free • The expected negative relationship between temperature and breakdown rate was at least suggested as a trend in all three comparisons. • The negative relationship and trends between 1/kT and ln (breakdown rate) are equivalent to positive relationships and trends between temperature and breakdown rate and represented more than a doubling of breakdown rate across Coweeta streams across a gradient of ~2oC. • Rhododendron breakdown was slower than Acer but responses to temperature were similar between the two species. • There was a positive relationship between 1/kT and ln (breakdown rate) for the coarse Acer leaves of deployment A but not B. This was potentially due to the bags of deployment A experiencing more burials which may lead to less colonization and lower breakdown rates. Notably, three of the streams’ bags with the lowest breakdown rates also had heavy burials. Macroinvertebrate data was collected from only deployment A, thus these burials confounded shredder response analysis. Implications and next steps • Steeper slopes in the relationships between breakdown and temperature indicate greater effects on breakdown rates than would predicted from MTE. Both our empirical data and MTE predict faster losses of carbon via breakdown with increased temperature. • In our study, relatively high variability in breakdown rates resulted in large confidence intervals; additional data (seasonal) will be collected in the future to attempt to more accurately predict temperature effects on breakdown. • The contrast with streams in a more disturbed environment (Athens, GA) gives insights into other aspects of temperature effects. Slopes between breakdown and temperature were less steep with inclusion of Athens data – indicating potentially suppressed biological activity in disturbed streams. • Future work may extend the duration of the study, increase the number of bags in a deployment, capture and incorporate dissolved nutrient and contaminant data, and deploy bags such that depositional burials are less common. Subset Slope Figure Intercept Overall Model’s 𝐑 𝟐 Figure 1 C. A. -2.085 -3.673 0.363 C. R. -4.888 Figure 2 F. A. -1.366 -4.315 0.459 F. R. -4.4842 Figure 3 C. A. -0.512 -3.646 0.211 F. A. -4.096 Figure 2. The log of fine mesh breakdown rate against 1/kT showed no significant relationship but a negative trend with p=0.080. There was a significant effect of litter species on breakdown rate. Slope is less steep (-1.37) than coarse mesh but also steeper than MTE prediction; the 95% confidence interval is large (-2.913 to 0.180). Figure 3. We used sites in Athens, GA to extend the temperature and in-stream condition range of our data. The log of breakdown rate against 1/kT was statistically significant (p=0.022); the slope (-0.51) was less steep than MTE prediction. There was a significant effect of mesh size on breakdown rate. Table 1 : Summary table of values for Figures 1-3. The subsets are, respectively, coarse Acer, coarse Rhododendron, fine Acer, fine Rhododendron, coarse Acer, and fine Acer. Figure 1. The log of coarse mesh breakdown rate plotted against 1/kT showed no significant relationship but a trend with p=0.077. There was a significant effect of litter species on breakdown rate. Slope is steeper (-2.08) than MTE prediction, (ca. -0.6); the 95% confidence interval is large (-4.414 to 0.244). dry mass calculations were done as per standard methods6. • Slopes between breakdown and temperature were compared to the linear Arrhenius equation to assess whether empirical data matched predictions from MTE. Coweeta – Total breakdown Coweeta – Microbial breakdown Coweeta – Athens Total, microbial breakdown