SlideShare a Scribd company logo
1 of 45
Download to read offline
Social Capital i
Social Capital and Grassroots Development
Celeste Visser
Jose Toasa
September 2, 2011
Social Capital ii
Table of Contents
Part I: Social Capital – Views and Definitions …………………………………………… 1
The Communitarian View …………………………………………………………. 2
The Networks View ………………………………………………………………… 3
The Institutional View ……………………………………………………………... 5
The Synergy View ………………………………………………………………….. 6
Part II: Defining Social Capital at the Inter-American Foundation ……………………. 6
Part III: Methodologies for Measuring Social Capital …………………………………... 8
Levels of Social Capital …………………………………………………………….. 9
How Social Capital Affects Welfare ……………………………………………… 12
The Creation of Social Capital ……………………………………………………. 24
Part IV: The Grassroots Development Framework …………………………………….. 34
Part V: Integrating the GDF and Measurements of Social Capital ……………………. 37
Social Capital 1
Social Capital and Grassroots Development
Major technical refinements have increased the capacity for analytical measurements of
growth since the end of the Second World War. However, these tools have not explained
variations in growth rates among countries with similar stocks of natural and physical capital, or
variations in project performance among similar communities. By the 1960s, the impact of human
capital on growth and development was recognized. It wasn’t until the 1980s, however, that the
role of social capital became accepted as a factor that affects development.
A comprehensive literature review of the major perspectives on social capital comprises the
first section of this paper. Key takeaways are that social capital is multidimensional, should be
considered at varying levels, and it is neither inherently good nor bad. The second part of this
paper will attempt to define social capital in terms of the grassroots development efforts that the
Inter-American Foundation (IAF) engages in. Next, I will outline methods that prominent scholars
have employed in the field to study important aspects of social capital. Such aspects include how
to measure levels of social capital, how social capital affects welfare, and the creation of social
capital. The IAF has developed a framework to measure the organizational capacity of its grantees
called the Grassroots Development Framework (GDF). Section four of this paper includes an
overview of the GDF. Finally, this paper will conclude with ideas regarding how the IAF might
apply the GDF so as to facilitate the measurement of social capital as it applies to grassroots
development.
Part I: Social Capital – Views and Definitions
Contemporary research by scholars Robert Putnam on civic traditions in modern Italy and
James Coleman on social capital’s effect on high school attrition rates catalyzed further research in
Social Capital 2
the field. Current conceptualizations of what constitutes social capital are divided between four
main camps: the communitarian, networks, institutional, and synthesis views.
The Communitarian View
The communitarian view of social capital emphasizes the value of civil ties. Researchers
Michael Woolcock and Deepa Narayan have argued that social capital is embodied in local
organizations such as clubs, associations, and civic groups. Proponents of this view believe that
social capital is inherently good, will always have a positive effect on a community’s welfare, and
that more is always better (p. 229).
In 1970, Italy engaged in an unprecedented process of decentralization. Putnam (2002)
recognized the events in Italy as an opportunity to explore the origins of effective government and
to research how institutions develop and adapt to their social environment. Nearly two and a half
decades later he concluded that social capital might be even more important than physical or
human capital for political stability, for government effectiveness, and for economic progress (p.
183).
According to Putnam (2002), civic activity improves the efficiency of society by
facilitating horizontal networks based on equality and cooperation, coordinated actions for mutual
benefit, and collective problem solving. It builds the trust, norms, and networks necessary to
enable rational individuals to overcome collective dilemmas1
and the opportunism that is generated
by these predicaments (p. 167).
While many positive externalities often arise as the result of strong civic ties, the
communitarian perspective fails to address the downside or costs that can also be associated with
social capital. For example, Portes and Sensenbrenner (1993) discussed how community ties often
1
Putnam discusses several well-known collective dilemmas, including the tragedy of the commons, the
provision of public goods, the logic of collective action, and the prisoner’s dilemma (p. 163).
Social Capital 3
place considerable financial and social constraints on Asian immigrants. It is not uncommon for
Asian immigrants to anglicize their names in order to divest themselves of these suppressing
associational ties. Other adverse consequences of social capital will be discussed in further detail
later.
Woolcock and Narayan (2000) criticized the communitarian view on the basis that it
assumes that communities are homogenous entities that include and benefit all members. In reality,
denigrating social constructs such as caste inequality, ethnic exclusion, and gender discrimination
often impede a successfully egalitarian distribution of benefits. Furthermore, these authors stated
that high levels of social solidarity or informal groups will not necessarily lead to prosperity if
such groups lack the resources and access to power that is necessary to succeed (p. 230).
The Networks View
The networks view attempts to account for both the upside and downside of social capital.
According to Woolcock and Narayan (2000), supporters of this perspective maintain that different
combinations of strong intra-community ties known as “bonding2
” and weak inter-community ties
commonly referred to as “bridging3
” are responsible for the range of outcomes that can be
attributed to social capital. For example, the dismal situation of community outcasts is thought of
as characterized by low levels of both bonding and bridging social capital. Successful members of
microfinance programs however, are depicted as individuals who are empowered through high
levels of bonding and bridging social capital (p. 231). Kozel and Parker theorized that often the
poor substitute a lack of bridging networks with additional bonding networks. These researchers
described the bonding networks of the poor as defensive in nature – they are used to survive, and
2
Grootaert et al (2004) defined bonding social capital as “ties to people who are similar in terms of their
demographic characteristics, such as family members, neighbors, close friends, and work colleagues” (p. 4).
3
Grootaert et al (2004) defined “bridging” social capital as “ties to people who do not share many of [the
characteristics of bonding social capital]” (p. 4).
Social Capital 4
the bridging networks of the non-poor as primarily offensive – such networks are used for
advancement of material interests (as cited in Woolcock and Narayan, 2000, p. 233).
In opposition to the communitarian view, a central tenet of the networks perspective is that
the manifestations of social capital can be both positive and negative. While members can accrue
the rewards of social capital through a range of services, negative consequences for group
members can also surface. Portes (1998) identified four negative consequences of social capital:
• The bounded solidarity and trust that comprises the core of a group’s economic advantage
may lead to the exclusion of outsiders.
• Inter-group relations may give rise to free-riding problems, thus imposing excess claims on
group members.
• Community and autonomy within a group creates demands for conformity and therefore
comes at the cost of reduced privacy and autonomy of individuals.
• Downward leveling norms may exist for communities with high levels of social capital;
individual success may undermine the cohesion of a group (p. 15-17).
Another key belief of the networks view is that in order to critically assess the desirability
of an outcome, the sources of social capital must be distinguished from the consequences derived
from them. This is because certain outcomes are suboptimal. Positive outcomes for one group may
come at the expense of another group, or at the price of significant costs tomorrow (Woolcock and
Narayan, 2000, p. 231).
The main criticism of the networks view is that it does not account for the capacity for
institutions at the societal level to shape and be shaped by local communities. The “public good”
nature of social capital is diminished. As such, it is believed that social capital cannot, or should
not be measured across larger social aggregates such as societies or nations. Individuals involved
Social Capital 5
in groups are regarded as the primary beneficiaries of benefits that may accrue from communal
activities (Woolcock and Narayan, 2000, p. 234).
The Institutional View
Supporters of the institutional view argue that social capital is largely a product of the
political, legal, and institutional environment. This hypothesis directly contrasts the networks
view, which argues that institutional and community environments emerge as a result of
contrasting levels of bonding and bridging social capital.
According to this view, reported Douglass North, the degree to which groups are able to
organize and act in their collective interest depends on the quality of the formal institutions under
which they reside (as cited in Woolcock and Narayan, 2000, p. 234). Indeed, Theda Skocpol
(1995, 1996), who is a proponent of the institutional view, concluded from his research that, “civil
society thrives to the extent that the state actively encourages it” (as cited in Woolcock and
Narayan, 2000, p. 234).
Promoters of the institutional view have provided broad statistical evidence for the
importance of social capital. For example, Knack and Keefer (1995, 1997) conducted a
quantitative cross-national study of the effects of government performance and social divisions on
economic performance. These researchers equate social capital with the quality of a society’s
political, legal, and economic institutions. Through their studies, Stephen Knack and Philip Keefer
have shown that many institutional items such as generalized trust, rule of law, civil liberties, and
bureaucratic quality are positively associated with economic growth (as cited in Woolcock and
Narayan, 2000, p. 234-235).
Social Capital 6
The Synergy View
The synergy view integrates the strengths of the networks and institutional perspectives.
Woolcock and Narayan (2000) outlined three major points of the synergy view regarding
developmental synergies4
that were presented in a 1996 issue of World Development:
• Governments, corporations, and civic groups are not inherently good or bad.
• Complementarities both within and across states, firms, and communities are essential for
the promotion of broad-based, sustainable development.
• The state is the final provider of public goods, is the authority of the law, and is the actor
best able to encourage enduring alliances across boundaries. As such, the state’s role in
facilitating positive developmental outcomes can be both the most important but also the
most problematic of these three different sectors (p. 236).
In addition to bonding and bridging social capital, Grootaert et al. (2004) discussed the
recent academic addition of the idea of linking social capital. They defined this dimension as
referring to one’s “ties to people in positions of authority, such as representatives of public (police,
political parties) and private (banks) institutions” (p. 4).
Part II: Defining Social Capital at the Inter-American Foundation
The definition of social capital that most closely aligns with and supports the philosophy
underlying the grassroots development approach taken by the Inter-American Foundation (IAF) is
the synergy view. The IAF views sources of growth and development as multidimensional in
nature. In the same light the IAF should recognize that both structural and cognitive community
conditions beget social capital. An important structural element of a society is what type of groups
and networks community members have access to. Researchers should consider whether such
4
Woolcok and Narayan (2000) defined developmental synergies as “dynamic professional alliances and relations
between and within state bureaucracies and various actors in civil society” (p. 236).
Social Capital 7
groups and networks are primarily bonding, bridging, or linking in nature. Of equal importance are
cognitive conditions such as individual perceptions of the trustworthiness of other people and key
institutions that shape peoples lives, as well as the norms of cooperation and reciprocity that
facilitate attempts to work together to solve problems.
A comprehensive definition of social capital needs to consider (a) the sources of social
capital; (b) the main channels through which it operates; and (c) the major areas of application or
outcomes. Grooetaert et al (2004) identified six dimensions of social capital as follows:
• Groups and networks – the nature and extent of a household member’s participation in
various types of social organizations and informal networks, and the range of contributions
that one gives and receives from them. Group diversity, leadership selection, and changes
in involvement over time.
• Trust and solidarity - trust towards family members, neighbors, key service providers, and
strangers, and how these perceptions change over time.
• Collective action and cooperation – whether/how joint projects are executed and/or
responses to crises are handled. The consequences of violating community expectations
regarding participation.
• Information and communication – ways and means by which poor receive information
regarding market conditions and public services, and the extent of their access to
communications infrastructure.
• Social cohesion and inclusion – nature and extent of various forms of division and
differences, mechanisms by which they are managed, which groups are excluded from key
public services, and forms of social interaction.
Social Capital 8
• Empowerment and political action – household members’ sense of happiness, personal
efficacy, and capacity to influence both local events and broader political outcomes (p. 5).
Consideration of these six facets can help the IAF to conceptualize social capital in terms of its
sources, channels, and outcomes. The sources of social capital, both structural and cognitive, are
depicted through the first two dimensions: groups and networks as well as trust and solidarity.
Collective action and cooperation, along with information and communication, constitute the main
ways in which social capital operates. Finally, the major applications or outcomes of social capital
manifest through social cohesion and inclusion, as well as empowerment and political action.
Part III: Methodologies for Measuring Social Capital
Numerous methods to measure social capital have been constructed and tested in the field.
Contemporary researchers have primarily attempted to devise methods to measure three differing
dimensions of the concept: existing levels of social capital, how social capital affects welfare, and
the creation of social capital. In the following three sub-sections examples will be given of case
studies in which methodologies have been employed to measure each of these dimensions.
Research conducted by Anirudh Krishna and Norman Uphoff (2002) will be disaggregated and
discussed in each of the corresponding sections. Methods to measure levels of social capital must
appear in most relevant studies in order to assess with any degree of validity how social capital
affects welfare, and its creation. To avoid redundancy, the study by Krishna and Uphoff is the only
study that we will disaggregate in order to independently analyze how levels of social capital were
measured. We will then look at three attempts to measure how social capital affects welfare.
Finally, four cases in which measures of the creation of social capital are constructed will be
discussed.
Social Capital 9
Levels of Social Capital
Example one.
Social capital in Rajasthan, India.
This section will look closely at a study that was conducted by researchers Krishna and
Uphoff (1999) concerning social capital in Rajasthan, India. While their research examines several
aspects of social capital, this section of the paper will focus on their attempts to map levels of
social capital through its structural and cognitive forms (p. 86).
To provide an empirical basis for evaluating whether or not social capital can be identified
and measured empirically, Krishna and Uphoff (1999) identified 64 villages in each of the four
districts of Rajasthan. At the time of the study, these villages had participated in a watershed
conservation and development program that had been receiving funding from the Indian
government and the World Bank since 1991 (p. 85). Examination of information available from
project reports allowed Krishna and Uphoff to determine whether prior performance in restoring
degraded or vulnerable common lands through collective action was high, medium, or low for each
village. The number of high, medium, and low performing villages was spread as evenly as
possible across the four districts. A database was constructed through 2,397 interviews with
individuals who were selected on the basis of simple random sampling, and 64 focus group
sessions with village leaders and elected representatives. In addition, relevant village and
household level data was obtained from official records (p. 90).
The first measure constructed by Krishna and Uphoff (1999) was named the Common
Land Development Index. It was based on six criteria of measured performance in watershed
development - quality of work, quality of protection, productivity, voluntary action, diversification
Social Capital 10
of activities, and support for local contribution - using factor analysis.5
The six measures proved to
be highly correlated, and all of the coefficients were significant at the 0.05 levels or better. The
following table shows the average component scores for villages categorized according to whether
their Common Land Development Index score was low, medium, or high (p. 92).
Table 1
Component scores for villages grouped by Common Land Development Index category
Component Low Common Land
Development Index
(less than 1.5)
n = 15
Medium Common
Land Development
Index (1.5-3.0)
n = 23
High Common Land
Development Index
(3.0 or more)
n = 26
Quantity of work 1.23 2.43 2.93
Quality of protection 0.50 0.78 1.80
Productivity 1.00 1.65 3.00
Voluntary action 0.23 0.61 2.00
Diversification of
activities
0.12 0.70 2.00
Support for local
contributions
0.31 0.65 1.40
Note. This table comes from p. 93 of Krishna, A., & N. Uphoff (1999). Mapping and measuring
social capital through assessment of collective action to conserve and develop watersheds in
Rajasthan, India. In H. Christiaan, & T. van Bastelaer (Eds.), The role of social capital in
development (pp. 85-124). Cambridge: Cambridge University Press.
Krishna and Uphoff concluded that there is a single common factor on which all six of
these elements load highly, but that several hypotheses could explain these variations in collective
action outcomes. Variables that have been identified in the social science literature on
development as factors that could account for variations in collective action include relative need
of communities, relative need of power holders, government staff support, modernization,
heterogeneity and stratification, and literacy. These hypotheses were tested by Krishna and Uphoff
through single variant as well as multivariate analysis. The only hypotheses with a significant
5
The index was constructed by first standardizing each item with the values rescaled so that each had a maximum
value of 1.0; each variable was given an equal weight within the index and the six scores were then summed. The
maximum score was thus 6.0 (Krishna and Uphoff, 1999, p. 92).
Social Capital 11
coefficient and correlation with the dependent variable in any of the models was literacy (p. 93-
98).
These results indicate that in order to account for the differences observed in the Common
Land Development Index other variables that were measured in the field studies needed to be
examined. To do so, Krishna and Uphoff set out to develop a broader measure of collective action
for development. First, Krishna and Uphoff attempted to test the robustness and breadth of the
dependent variable. The hope was to find out whether the Common Land Development Index
affects only one set of actions that translate into good performance within a certain sector, or
whether the Common Land Development Index corresponds more broadly to a general propensity
for collective action at the village level (p. 100). To do so, they developed three other indices that
reflect collective action in other areas that are related to development at the village level:
community projects, collective representation, and service satisfaction. According to their results,
villages with high Common Land Development Indices also had high scores on each of the other
three indices. This result supports the hypothesis that there is a single common factor that supports
mutually beneficial collective action across diverse areas of development activity (p. 101).
The search employed by Krishna and Uphoff for independent measures of social capita
relevant to the cultural and historical context in Rajasthan was exploratory in nature. Eventually,
these researchers developed and combined six questions to construct an index of social capital.
The questions are concerned with social relationships, networks, or the structure of social action,
cognitive phenomena regarding social relationships, specifically norms, values, or attitudes that
reflect a sense of solidarity and mutual trust (p. 105). Theoretically, this social capital index
combines structural and cognitive aspects of social capital, and should reflect the predisposition
and ability of people to cooperate for mutual benefit. The responses to the social capital index
Social Capital 12
questions were highly correlated and loaded commonly on a single factor.6
Table two displays the
correlations between the social capital index and other aspects of social capital.
Table 2
Correlations between the social capital index and other aspects of social capital
Indicator Correlation
Informal networking and mutual supports 0.771
Trust 0.645
Reciprocity 0.492
Solidarity 0.420
Expectations about future cooperation 0.612
Concern for future generations 0.392
Note. This table is adapted from p. 108 of Krishna, A., & N. Uphoff (1999). Mapping and
measuring social capital through assessment of collective action to conserve and develop
watersheds in Rajasthan, India. In H. Christiaan, & T. van Bastelaer (Eds.), The role of social
capital in development (pp. 85-124). Cambridge: Cambridge University Press.
a
All coefficients significant at the 0.01 level or better.
Villages that had high social capital index scores also scored well in terms of other
measures of trust and propensity to participate in associations. This supports the notion that
Krishna and Uphoff developed a generalized measure of social capital for Rajasthan, India.
How Social Capital Effects Welfare
Example one.
Social capital in Rajasthan, India.
Krishna and Uphoff (1999) continued their study of social capital and watershed
management that was introduced above by attempting to determine what relationship their social
capital index has with the two dependent variables, the Common Land Development Index and the
Development-Oriented Collective Action Index. Each index was adjusted to range from 0 to 100
(p. 109). Bivariate regressions of social capital on the Development-Oriented Collective Action
6
“The index score for each village was obtained by summing the six scores after dividing each variable by its range so
that each variable had a maximum score of 1.0. The index was rescaled so that values range from 0 to 100 in order to
facilitate interpretation of regression results” (Krishna and Uphoff, 1999, p. 107).
Social Capital 13
Index and on the Common Land Development Index both produced a positive coefficient for
social capital, significant at the 0.01 levels (p. 109).
However, Krishna and Uphoff stated that the association between the social capital index
and the other two indices was not sufficient to account for a major part of the variation in those
variables. Using their database, these researchers constructed three other indices representing
characteristics of village social life that might correlate with collective action and development
performance: divisions and factions within a village, attitudes and beliefs villagers have about the
honesty or dishonesty of fellow villagers, and the level of political competition in the village (p.
109).
Four separate regressions on development performance and on watershed performance
were conducted using ordinary least squares methodology. Literacy was the one variable from
before that was included in these regressions as it was the only alternative hypothesis tested earlier
that was associated with the two dependent variables in a statistically significant way (p. 109).
The results of these regressions are displayed in tables three and four.
Social Capital 14
Table 3
Ordinary least squares regressions on development performance (rescaled Development-Oriented
Collective Action Index)
Item Model 1 Model 2 Model 3 Model 4
Intercept -18.90
(24.68)
-34.3*
(18.04)
-44.239**
(17.627)
-40.93**
(16.89)
Independent
variables
Social capital
index
0.689**
(0.276)
0.691**
(0.272)
0.721**
(0.288)
0.703**
(0.261)
Divisive factors -0.001
(0.041)
Tolerance for
dishonesty
-0.051
(0.064)
Political
competition
0.42***
(0.121)
0.38**
(0.118)
0.376**
(0.120)
0.391***
(0.117)
Mechanization 0.205
(0.337)
Infrastructure -1.31
(0.884)
Literacy 0.732*
(0.355)
0.471
(0.321)
0.596*
(0.298)
Number of castes 0.123
(0.690)
Population size 0.005
(0.003)
0.002
(0.003)
n 64 64 62 64
R² 0.277 0.354 0.331 0.315
Adjusted R² 0.226 0.283 0.271 0.286
F-ratio 5.453 5.018 5.536 8.91
F-probability 0.0009 0.0004 0.0003 0.0001
Durbun-Watson
statistic
1.973 2.02 1.946 1.959
Notes: This table comes from p. 112 in Krishna, A., & N. Uphoff (1999). Mapping and measuring
social capital through assessment of collective action to conserve and develop watersheds in
Rajasthan, India. In H. Christiaan, & T. van Bastelaer (Eds.), The role of social capital in
development (pp. 85-124). Cambridge: Cambridge University Press.
a
Standard errors are in parentheses.
*p ≤ 0.1. **p ≤ 0.05. ***p ≤ 0.001.
Social Capital 15
Table 4
Ordinary least squares regressions on watershed performance (rescaled Common Land
Development Index)
Item Model 1 Model 2 Model 3 Model 4
Intercept -48.81*
(25.64)
-60.56**
(21.92)
-69.536**
(21.71)
-68.84**
(21.48)
Independent
Variables
Social capital
index
0.728**
(0.286)
0.762**
(0.262)
0.748**
(0.268)
0.781**
(0.263)
Divisive factors 0.026
(0.041)
Tolerance for
dishonesty
-0.001
(0.068)
Political
competition
.0513***
(0.128)
0.496**
(0.124)
0.472***
(0.125)
0.470***
(0.124)
Rain-fed land
ratio
0.029
(0.164)
Government staff
support
0.216*
(0.124)
0.210*
(0.122)
Infrastructure -1.43
(0.97)
Literacy 0.549*
(0.306)
0.566*
(0.332)
0.539*
(0.309)
Population -0.001
(0.004)
n 64 62 62 64
R² 0.320 0.406 0.370 0.368
Adjusted R² .0274 0.342 0.315 0.325
F-ratio 6.948 6.370 6.703 8.462
F-probability 0.0001 0.0001 0.0001 0.0001
Durbun-Watson
statistic
1.66 1.792 1.576 1.572
Notes: This table comes from p. 113 in Krishna, A., & N. Uphoff (1999). Mapping and measuring
social capital through assessment of collective action to conserve and develop watersheds in
Rajasthan, India. In H. Christiaan, & T. van Bastelaer (Eds.), The role of social capital in
development (pp. 85-124). Cambridge: Cambridge University Press.
a
Standard errors are in parentheses
*p ≤ 0.1. **p ≤ 0.05. ***p ≤ 0.001.
Social Capital 16
In all four of the regressions only two variables are consistently significant. The coefficient
for the social capital index ranges from 0.60-0.72, and indicates that an increase of 1 percentage
point in social capital is associated with on average an increase of 0.7 percentage points in
collective action for development. With a range of 0.38-.042, the coefficient for the political
competition index indicates that a change of 1 percentage point in political competition would be
associated with a 0.4 percent point change in collective action. In five out of six of the regressions
literacy was statistically significant at the 0.1 levels. These results provide evidence that increased
social capital is associated with more effective collective action for development, and that more
political competition is associated with greater levels of collective action (p. 114).
Example 2.
The effect of social capital on high school attrition rations.
Researcher James Coleman (1988) conducted a study on the role of social capital in the
creation of human capital. He wrote that social capital “comes about through changes in the
relations among persons that facilitate action … it exists in the relations among persons” (p. 101).
Coleman identified three forms of social capital: obligations and expectations, information
channels, and social norms. He maintained that all social relations and social structures facilitate
some of these forms of social capital. Closure of networks however, argued Coleman is especially
important in facilitating social capital in the forms of obligations and expectations, and social
norms.
To demonstrate his hypothesis Coleman conducted a multi-step examination of the effect
of social capital within the family and in the community outside the family on high school attrition
rates. First, he examined social capital in the family. Coleman argued that the “social capital within
the family that gives the child access to the adult’s human capital depends both on the physical
Social Capital 17
presence of adults in the family and on the attention given by the adults to the child” (p. 111). To
show the expected dropout rates for students in different types of families Coleman used a
weighted logistic model with a random sample of 4,000 students from public schools. Various
measures of social and human capital in the community were controlled for statistically.7
The
following table depicts the dropout rates of high school students between spring grade 10, and
spring grade 12 for students whose families differ in social capital indicators controlling for human
capital and financial capital in the family:
Table 5
Dropout rates between spring, grade 10, and spring, grade 12, for students whose families
differ in social capital, controlling for human capital and financial capital in the family
Percentage Dropping
Out
Difference in Percentage
Points
1. Parents’ presence:
Two parents 13.1 6.0
Single parent 19.1
2. Additional children:
One sibling 10.8 6.4
Four siblings 17.2
3. Parents and children:
Two parents, one sibling 10.1 12.5
One parent, four siblings 22.6
4. Mother’s expectation for child’s
education:
Expectation of college 11.6 8.6
No expectation of college 20.2
5. Three factors together:
Two parents, one sibling,
mother expects college
8.1 22.5
One parent, four siblings, no
college expectation
30.6
Note. This data in this table is adapted from p. 112 in Coleman, J. (1988). Social capital in the
creation of human capital. The American Journal of Sociology, 94, 95-120. Retrieved June 14,
2011, from JSTOR database (2780243).
7
The following variables were included in the model to measure the family’s financial, human, and social capital:
socioeconomic status (a single variable constructed of parents’ education, parents’ income, father’s occupational
status, and household possessions), race, Hispanic ethnicity, number of siblings, number of changes in school due to
family residential moves since fifth grade, whether mother worked before the child was in school, mother’s
expectation of child’s educational attainment, frequency of discussions with parents about personal matters, and
presence of both parents in the household.
Social Capital 18
Each indicator of adult attention in the family that was used in this regression was
associated with lower high school student attrition rates between spring of the sophomore year and
spring of the senior year. Coleman’s results indicate that social capital in the family is a resource
for the education of the family’s children (p. 113).
Coleman then analyzed social capital outside the family. He theorized that the examination
of outcomes for children whose parents differ in intergenerational closure would disclose the effect
of social capital outside the family on educational outcomes. As a proximate indicator of
intergenerational closure, Coleman considered the number of times the child changed schools
because the family moved (p. 113). According to the first logistic regression that he carried out and
that was discussed above, the dropout rate if the family had not moved was 11.8%, the dropout rate
was 16.7% if the family had moved once, and 23.1% if it had moved twice.
An additional indicator used by Coleman to determine the effect of social capital outside
the family on educational outcomes was that of variation among schools. He distinguished
between public high schools, religiously based private high schools, and non-religiously based
private high schools.8
Table 6
Dropout rates between spring, grade 10, and spring, grade 12, for students from schools with
differing amounts of social capital in the surrounding community
Public Catholic Other Private Schools
1. Raw dropout rates 14.4 3.4 11.9
2. Dropout rates
standardized to
average public school
sophomore
14.4 5.2 11.6
Note. This data in this table is adapted from p. 115 of Coleman, J. (1988). Social capital in the
creation of human capital. The American Journal of Sociology, 94, 95-120. Retrieved June 14,
2011, from JSTOR database (2780243).
8
Data was drawn from 893 public schools, 84 Catholic schools, and 27 other private schools.
Social Capital 19
The most significant result of these comparisons was the low dropout rate in Catholic
schools compared with public and other private schools. The differences, emphasized Coleman,
were not due to religion. He pointed out that the dropout rate for public school students who attend
Church was often 9.1%. Instead, he explained that religiously based high schools have very high
levels of intergenerational closure. A community based on the religious organization surrounds
these schools. Relations are multiplex as the adults are members of the same religious body and
parents of the children in the same school (p. 114). In addition to the previous results, which
indicate that social capital in the family is a resource for the education of the family’s children,
these subsequent results provide evidence of the importance of social capital outside the school in
the adult community surrounding it (p. 115).
Example three.
The impact of social capital on agricultural traders in Madagascar.
Researchers Marcel Fafchamps and Bart Minten (1999) studied the impact of social capital
on the success of the firm. Specifically, they attempted to illustrate the economic effect that social
capital has on the functioning and performance of agricultural traders in Madagascar. Fafchamps
and Minten argued that social capital influences economic exchange in two ways. They wrote that:
Trust and emotional attachment to a group, society, or association may improve public
sector efficiency or facilitate greater cooperation for services benefitting that group,
society, or association9
…benefits can also accrue directly to an individual or a firm as a
result of knowing people with whom it forms networks of interconnected agents (p. 125).
9
In essence, Fafchamps and Minten (1999) argued that social capital could help overcome obstacles in imperfect
markets that often arise in developing countries. They argued that trust and emotional attachment can help to
overcome the results of such poor market institution, which include a lack of formal credit, inadequate contract
enforcement, and formal insurance deficiencies, high search costs for both suppliers and customers, and imperfect or
asymmetric information on the market situation, on the credibility of suppliers and customers, and on products (pp.
125-126).
Social Capital 20
To test the quantitative impact of social capital on traders in Madagascar, and to identify
the channels through which it affects performance, Fafchamps and Minten used regression
analysis. They employed the following production function:
Q = f (L, K, H, S)
Where:
Q stands for output
L stands for labor
K stands for physical capital
H stands for human capital
S stands for social capital
They maintained that in theory, if S has any effect on performance then including it in the
production function would reduce the regression coefficients of the other variables (p. 140).
Fafchamps and Minten then ran a second specification of the production function to identify the
channels through which social capital might work:
Q = f (L, K, H, S:C)
Where:
C stands for different channels
In order to avoid simultaneous causation, instrumental variation was used10
. Additional
measures were taken to avoid covariate and idiosyncratic shocks, omitted variable bias, and the
concern that social capital could simply be a byproduct of economic success (p. 141).
Determinants of the five measures of social capital - output, labor, physical capital, human
capital, and social capital - used in this analysis included accumulation of social capital, returns to
social capital, and social capital and modes of transaction. The regression results in the following
table illustrate the process by which social capital, labor, and physical capital are accumulated (p.
143):
10
Instrumental variables on family background, business start-up experience, personal wealth and financial assets, and
access to telecommunication equipment were selected based on a data set of exogenous variables (Fafchamps &
Minten, 1999, p.141).
Social Capital 21
Table 7
Determinants of social capital, labor, and physical capital
Social Capital Labor Physical
Capital
Number
of
relatives
in trade
Number
of
people
who
can
help
Number
of
traders
known
Number
of
customers
known
personally
Number
of
suppliers
known
personally
Manpower
(ln in
man-
months)
Equipment
(ln in local
currency)
Variable
Years of
schooling of
owner/manager
0.0079 0.0075 0.0029 0.0116 0.0369 0.0387 0.1517
Age of
owner/manager
0.0078 0.0135 0.0330 0.0279 0.0427 0.0226 0.0601
(Age of owner/
manager) ²
-0.0001 -0.0002 -0.0004 -0.0003 -0.0004 -0.0001 -0.0003
Gender
(1=male)
-0.0198 -0.0012 -0.1315 -0.0522 -0.0844 -0.1618 -0.5267
Years of
experience in
agricultural
trade
0.0409 0.0785 0.3286 0.2299 0.1884 0.1238 0.5767
Dummy if full-
time trader
0.0080 0.0436 0.0017 -0.0023 0.0440 0.0469 -0.7342
Dummy if
trader all-year-
round
-0.0984 -0.0445 0.1250 0.1355 -0.1797 0.1360 -0.2846
In capital city -0.3420 0.1575 0.3152 0.5625 -0.6174 -0.0986 -1.3378
In another city 0.1608 0.0241 -0.1695 -0.2780 -0.2753 -0.0575 -0.1803
In
Vakinankaratra
region
-0.3816 -0.1924 0.3125 0.2212 -0.5748 -0.1196 -0.1443
In Fianarantsoa
(Hauts
Plateaux)
-0.4611 -0.1881 0.0081 -0.2882 -1.1810 0.0143 -2.5406
In Fianarantsoa
(Côte et
Falaise)
-0.4546 -0.0623 -0.0665 -0.3443 -1.1604 -0.1211 -3.0002
In Majunga
(plaines)
-0.6612 -0.2832 -0.0262 -0.7347 -1.6225 -0.6186 -4.0686
In Majunga
(plateau)
-0.6078 -0.2862 -0.2301 -0.6517 -1.6372 -0.5777 -5.0498
Intercept 0.6358 0.7666 0.6857 0.7378 0.9240 2.0824 3.7861
R² 0.088 0.094 0.192 0.265 0.317 0.349 0.495
Social Capital 22
Notes: This table was adapted from the table on p.142 in Fafchamps, M., & B. Minten (1999).
Social capital and the firm: Evidence from agricultural traders in Madagascar. In H. Christiaan, &
T. van Bastelaer (Eds.), The role of social capital in development (pp. 125-154). Cambridge:
Cambridge University Press.
a
n = 704
b
T-statistics are available in table 4.11 P. 142
Social capital increased with the number of years in trade for all variables except relatives
in trade. When regressed as dependent variables, labor and physical capital exhibited behavior
similar to social capital in response to business experience. Fafchamps and Minten theorized that
social capital might improve the access to credit that is needed to finance the long-term investment
necessary to accumulate physical capital. Overall, the results suggest that traders accumulate social
capital over time (p. 144).
To illustrate the effect of business experience three sets of variables were used to explain
traders’ performance: (a) human capital variables only; (b) labor and physical capital in addition to
human capital variables; and (c) human capital, labor, physical capital, and social capital (p. 144).
Relatives in agricultural trade were included in all of the specifications because Fafchamps and
Minten believed that this form of social capital is not accumulated over time. Experience proved to
be highly significant in the second specification that included social capital, human capital, and
labor.11
A doubling of the years of experience in trade increased sales by 50 percent and value
added by 60 percent. Sales dropped to 19 percent and value added to 25 percent in the
specification that controlled for physical capital and labor (p. 144). The significance of the effect
of experience in trade disappeared for sales and value added once social capital was controlled for.
11
Regression results for the second specification are included in table 4.12, which can be viewed
on pp. 146 – 147 of Fafchamps, M., & B. Minten (1999). Social capital and the firm: Evidence
from agricultural traders in Madagascar. In H. Christiaan, & T. van Bastelaer (Eds.), The role of
social capital in development (pp. 125-154). Cambridge: Cambridge University Press.
Social Capital 23
Based on these results, Fafchamps and Minten concluded that a large part of the effect of business
experience on performance comes from the accumulation of social capital over time (p. 145).
Finally, Fafchamps and Minten attempted to determine how different modes of reducing
transaction costs affect the efficiency of traders. They presented two regressions. Ordinary least
square estimates were used in the first regression, while the second regression corrected for
possible simultaneity bias in working capital, labor, and modes of transaction. According to the
coefficients of the first regression the use of customers and suppliers as the main source of price
information was associated with a 60 percent increase in gross margin, while utilization of
messengers lead to an increase of more than 100 percent. Not having to inspect the quality of
supplies at each purchase was significantly associated with higher margins for the value added
OLS specification. The coefficients regarding traders’ ability to sell on credit as a determinant of
performance were highly significant in both specifications. However, when the specification was
corrected for endogeneity the significance of the coefficients disappeared.
Fafchamps and Minten concluded that (a) traders with better relationships with other
traders, suppliers, and customers earn higher margins; (b) social capital has characteristics that
parallel other types of inputs such as physical capital and labor; (c) social capital is accumulated
over time and significantly improves economic performance; and (d) firms benefit from social
capital mainly through a reduction in the high transaction costs typical in agricultural commodity
markets. They suggested that scholars distinguish between three dimensions of social capital:
relationships with individuals, relationships with other traders, and family relationships.
Social Capital 24
The Creation of Social Capital
Example one.
Social capital in Rajasthan, India.
To conclude their study of social capital and watershed management researchers Krishna
and Uphoff (1999) attempted to identify factors that affect the formation of social capital. They
constructed social capital index scores for individuals based on responses to survey questions. A
comparison of the social capital index at the personal level with the social capital index at the
village level allowed the authors to identify what other individual-level attributes correlate with
variations in the social capital index. To account for differences in individual’s propensities for
collective action Krishna and Uphoff inferred causation from these correlations (p. 115).
Krishna and Uphoff tested various hypotheses that might affect individuals’ respective
endowments of social capital. They assumed that individual endowments of social capital
aggregate into village social capital. Standard demographic characteristics that were tested include
age, gender, family size, and length of residence in the village. None were statistically significant.
Wealth and status, as well as education were also statistically insignificant at the household level.
Variables with statistically significant coefficients include several measures of participation,
participation in decision-making, information, rulemaking and enforcement, and history. Krishna
and Uphoff concluded that the statistical significance of these variables indicates that investment
in such matters will help to build social capital, at least in rural Rajasthan (p. 116-119).
Example two.
The impact of development assistance on social capital in rural Kenya.
Mary Kay Gugerty and Michael Kremer (2000) conducted research concerning the
determinants of social capital. Specifically, they attempted to study the impact of development
Social Capital 25
assistance on social capital in rural Kenya. They posed questions such as “Is social capital
determined exclusively by long-run historical, cultural, and economic forces? Or can it be
influenced in the short run by policy? If so, how?” (p. 213).
Gugerty and Kremer pointed out that a problem that corrupts many studies of social capital
is the difficulty of inferring causation from correlation in retrospective data. In order to overcome
this problem and estimate causal impacts, they employed a randomized prospective evaluation of
three projects undertaken by Internationaal Christelijk Steunfonds (ICS), a Dutch NGO. Project
phase-in was random. This random order of the phase-in claimed Gugerty and Kremer, provided
natural treatment and comparison groups (pp. 213-214). We will look closely at Gugerty and
Kremer’s evaluation of the first project.
In 1995 the Ministry of Education selected 100 underfunded schools and to determine
which school would receive funding and when randomly divided them into four groups. Textbooks
were provided to primary schools in the first group in 1996 and 1997. Schools belonging to the
second group received a grant at the end of 1997. Groups three and four served as comparison
groups for the first few years of the project. In 1998 group three schools received grants, while
group four schools received grants in 2000 (p. 216).
Gugerty and Kremer identified social capital and parental and community participation as
key determinants of educational quality. They measured parental participation through attendance
at Parent-Teacher Association (PTA) and school committee meetings and by parental contributions
to school projects. Gugerty and Kremer tested the impacts of each form of assistance by regressing
the dependent variable of interest on a binary indicator variable that takes the value of one if a
school or group is participating in the program. Included in the regressions are controls for
Social Capital 26
geographic divisions in which the schools or groups are located. Tables eight and nine display the
regression results corresponding to PTA meetings and school committee meetings.
Table 8
PTA meetings, 1997
Number of meetings All school committee
members
School committee officers
Dependent
variable
Number of
meetings
in 1997
(1)
Change in
number of
meetings
1995-7 (2)
Attendance
rate
(3)
Average
number of
meetings
attended
per
member
(4)
Attendance
rate
(5)
Average
number of
meetings
attended
per officer
(6)
Textbook
schools
-1.03**
(0.43)
-1.65**
(0.70)
0.08
(0.07)
-0.16
(0.24)
0.07*
(0.04)
-0.21
(0.44)
Grant schools -0.66
(0.41)
-1.37**
(0.58)
-0.01
(0.06)
0.34
(0.22)
0.03
(0.04)
0.54
(0.36)
Observations 94 77 66 93 67 93
R2
0.18 0.15 0.21 0.14 0.13 0.10
Mean value of
dependent
variable in
comparison
schools
3.89 1.78 0.59 0.98 0.88 1.58
Note. This table is from p. 220 in Gugerty, M.K., & M Kremer (2000). The impact of development
assistance on social capital: Evidence from Kenya. In H. Christiaan, & T. van Bastelaer (Eds.), The
role of social capital in development (pp. 213-233). Cambridge: Cambridge University Press.
a
OLS regressions with robust standard errors in parentheses. All regressions include variables for
the geographic regions in which schools are located.
b
*p ≤ 0.1. **p ≤ 0.05. ***p ≤ 0.001.
Social Capital 27
Table 9
School committee meetings, 1997
Number of meetings All school committee
members
School committee officers
Dependent
variable
Number of
meetings
(1)
Change in
number of
meetings
1995-7 (2)
Attendance
rate
(3)
Average
number of
meetings
attended
per
member
(4)
Attendance
rate
(5)
Average
number of
meetings
attended
per officer
(6)
Textbook
schools
-0.70
(0.55)
-0.89
(0.82)
0.04
(0.03)
-0.23
(0.34)
0.03
(0.03)
-0.36
(0.51)
Grant schools -0.41
(0.56)
-0.83
(0.76)
0.02
(0.03)
0.07
(0.35)
0.01
(0.03)
0.06
(0.48)
Observations 91 73 87 92 96 92
R2
0.18 0.17 0.12 0.14 0.11 0.17
Mean value of
dependent
variable in
comparison
schools
4.19 0.98 0.56 2.01 0.91 3.18
Note. The table is from p. 221 in Gugerty, M.K., & M Kremer (2000). The impact of development
assistance on social capital: Evidence from Kenya. In H. Christiaan, & T. van Bastelaer (Eds.), The
role of social capital in development (pp. 213-233). Cambridge: Cambridge University Press.
a
OLS regressions with robust standard errors in parentheses. All regressions include variables for
the geographic regions in which schools are located.
b
*p ≤ 0.1. **p ≤ 0.05. ***p ≤ 0.001.
The regression results indicate that neither textbook nor grant schools saw significant
changes in the average number of meetings attended per committee member, attendance rates at
meetings, or in the number of school committees meetings held. Teachers’ participation in school
did increase in both programs. However, because the program impact on teacher effort seemed to
be direct, rather than mediated through the influence of parents, the authors concluded that
increased social capital in the form of parental participation was not the channel through which the
programs improved teacher effort (p. 222-223). The authors found no evidence of measurable
increases in social capital outcomes. Through this study and the two subsequent projects that
Social Capital 28
Gugerty and Kremer analyzed, the authors concluded that the effects of investment on social
capital are often minimal (p. 232).
Example three.
Social capital and federations of the rural poor in the Andes.
Anthony Bebbington and Thomas Carroll (2000) attempted to identify which federated
forms of organizations are able to bridge different interests of the rural poor in the Andes. These
researchers pointed out that while poor people’s organizations in the Andes embody essential
forms of structural capital that can play a pivotal role in poverty reduction, such organizations
widely vary in scale, role, effectiveness, and degree of inclusiveness and exclusiveness.
Bebbington and Carroll argued that the supra-communal, or second-order federation12
is
particularly important because such organizations link community-based groups around shared
economic, political, and cultural interests, they are relatively close to the grassroots and so better
able to be participatory and accountable, yet are still able to play a critical role in states, markets,
and distant national social movements. Bebbington and Carroll asserted that in order to be
effective this type of federation must be comprised of particular types of social relationships – a
form of structural social capital that they argued can be constructed through external intervention
(p. 234-235).
Through several case studies, Bebbington and Carroll were able to compose a list of what
they determined to be dimensions of social capital within a second-order organization in the
Andes:
12
Michael Woolcock defined second-order organizations as “social systems that have the capability to combine strong
intra-group ties with weak extra-group networks in a way that can develop positive synergies between the two types of
ties” (as cited in Bebbington & Carroll, 2000, p. 236). Bebbington and Carroll identified the capacity of the federation
to behave as such a second-order organization.
Social Capital 29
• Local and kin-based networks – Strong bonds of mutual help based on kinship, symbolic
patronage, and spatial propinquity that facilitate collective action and problem-solving, as
well as ritual and other social activities.
• Intercommunity linkages – Project groups within a second-order organization where
members from various and more heterogeneous communities participate
• Linkages to higher-level indigenous organizations – The building of relationships through
which higher organizations can effectively represent, respond to, and be accountable to the
second-order organization.
• Municipal and regional linkages – Territorially based sets of relations with state, civil
society, and market actors that build synergies for the local co-production of development.
• Inter-institutional linkages with support agencies – More dependent relationships with
donors and other external agencies that channel support to second-order organizations in
order to gain access to resources and/or to markets and decision-making fora (p. 242-243).
Bebbington and Carroll asserted that to act strategically on notions of organizational capacity
specific measures of the different dimensions of social capital and organizational capacity in
federations must be developed. They analyzed six case studies in order to determine: “(a) the
capacities of second-order organizations in terms of different dimensions of social capital and the
other assets available to the organizations; and (b) the relationship between capacity and forms of
external support to the second-order organization” (p. 249). Bebbington and Carroll also conducted
two larger surveys in collaboration with some other organizations. Comparators within the same
locality were not identified. Thus, while organizations were compared in ex post analysis, the
researchers were not able to control for all other conditions including regional agro-ecological and
political economic effects.
Social Capital 30
Bebbington and Carroll developed score-able indicators of the different forms of social
relations that constitute organizational capacity. Interestingly, these researchers mentioned the
framework developed by the IAF to measure the organizational development of its grantees as a
precursor to their method. Bebbington and Carroll pointed out that the variables identified by the
IAF could be used to measure the process of social capital accumulation itself, or the
embodiment/outcome of the accumulation of social capital by the membership of a group (p. 253).
Through inductive and deductive reasoning, Bebbington and Carroll decided to use three
instruments. The first instrument was meant to assess the quality of the federation’s social
relationships and certain assets. The second instrument assessed the quality of the federation’s
community relationships and community perceptions of the federation’s effectiveness. A data
sheet for basic quantitative information that was obtained from federation organization records and
other documents comprised the third instrument. These instruments aggregated 124 indicators,
which Bebbington and Carroll grouped into forty-four variables – half objective and half
subjective. The variables were organized according to seven dimensions of capacity: leadership,
participation, organizational culture, resource mobilization and use, sustainability, intermediation
and negotiation, and linkages/alliances. The results are displayed in the table 10.
Social Capital 31
Table 10
Organizational capacity indicators for fifteen federations in Ecuador
Variable High Mean Low Range of
difference
Participation 63 47 40 23
Management 56 52 27 29
Satisfaction of
members
73 60 40 33
Sustainability 55 45 30 25
Benefit
distribution
44 17 7 37
Self-initiative 69 33 10 59
Overall capacity 60 39 26 34
Note. This table is from p. 255 in Bebbington, A., & T. Carroll (2000). Induced social capital and
federations of the rural poor in the Andes. In H. Christiaan, & T. van Bastelaer (Eds.), The role of
social capital in development (pp. 234-278). Cambridge: Cambridge University Press.
Through qualitative analysis, Bebbington and Carroll linked the variation in the capacities
of second-order organizations in the Andes to the quality of the internal and external social
relationships of the organization. They argued that the greatest strength of the second-order
organizations and the context in which these federations operate is the quality of such
relationships. This suggests, maintained Bebbington and Carroll that these federations are sources
of important forms of social capital that can be built upon (p. 254).
Upon administering two surveys in Ecuador, and conducting in-depth qualitative studies of
twelve federations, each with different origins, Bebbington and Carroll concluded that the key to
inducing and reinforcing social capital for second-order institutions is the strengthening of the
internal capacity of these federations in combination with the forming of effective links with
external actors (p. 272-277).
Example four.
The integrated questionnaire for the measurement of social capital.
A framework that can be used in generating quantitative data on various dimensions of
social capital is called the Integrated Questionnaire for the Measurement of Social Capital (SC-
Social Capital 32
IQ). The designers of this questionnaire, Grootaert et al. (2004), stressed that the SC-IQ was
designed for incorporation into larger household surveys such as the Living Standards
Measurement Survey (LSMS). This mergence, maintained the authors, would enable researchers to
assess the impact of a project on social capital and/or to assess whether areas with high levels of
social capital have more successful project implementation (p. 2).
The questionnaire is based on the six dimensions of social capital that were defined in part
two of this paper - groups and networks, trust and solidarity, collective action and cooperation,
information and communication, social cohesion and inclusion, and empowerment and political
action (p. 5). The SC-IQ was specifically designed to measure household and individual level
social capital.13
The authors maintained that the micro-level data collected for the SC-IQ
corresponds with the focus of the LSMS, and that this correspondence makes it possible to
integrate the SC-IQ into the LSMS (p. 5). In order to direct questions to individuals household
surveys were employed (p. 6).
Grootaert et al suggested that researchers employ a two-step analysis to interpret data
collected by the SC-IQ. In order to begin to organize and extract meaning from the data it was
suggested that researchers first use tabular analysis centered on three basic sets of indicators of
social capital: (a) memberships in associations and networks (structural), (b) trust and adherence to
norms (cognitive), and (c) collective action (an output measure) (p. 9).
As there is a low limit to the number of variables that can be considered at one time using
tabular analysis, it was recommended that researchers complement tabular analysis with
econometric analysis. Grooetart et al deemed the estimation of multivariate models of household
welfare as especially important as such analysis can be used to identify the contribution of social
13
An instrument designed for the broader measurement of social capital at the level of households, communities, and
organizations is the Social Capital Assessment Tool (SOCAT).
Social Capital 33
capital to various aspects of household welfare (p. 9). Based on the assumption that social capital
is capital and therefore has a measurable return to the household, Grootaert et al developed the
following generic estimation equation (p. 15):
lnEі = a + bSCi + cHCi + dOCi + eXi + fZi + ui
Where:
Ei = household expenditure per capital of household i
SCi = household endowment of social capital
HCi = household endowment of human capital
OCi = household endowment of other assets
Xi = a vector of household characteristics
Zi = a vector of community / region characteristics
ui = error term
This equation allows researchers to test empirically the effect on levels of well being from
the networks and organizations and their underlying norms and values to which people belong.
Conversely, the impact of specific aspects of well being can be estimated by using other outcome
variables as the dependent variable in this equation (p. 15).
Grootaert et al maintained that the total number of relevant variables that may determine
the creation of social capital is vast. They argued that a quantitative model based on any number of
determinants is likely to capture only a small subset of relevant variables. As such, they
recommended that qualitative in-depth studies precede any quantitative multivariate methods.
Subsequent quantitative analyses can then be used to test empirically specific aspects of the
creation process that were discovered through the qualitative studies (p. 17).
Grootaert et al stressed that questions representing each of the six dynamics of social
capital should present when gathering data. They maintained that eliminating any of the dynamics
would “undercut the conceptual framework that underlies the SC-IQ and thus reduce the analytic
potential of the data collected” (p. 7).
Social Capital 34
Part IV: The Grassroots Development Framework
In 1994 the IAF employed lessons learned from supporting over 3,800 projects to develop
the Grassroots Development Framework (GDF). The Framework merges a diverse range of
quantitative and qualitative indicators of grassroots development into one conceptual tool that both
donors and grantees can use to measure impact. It attempts to illustrate the multilevel tangible and
intangible results that the IAF believes are achieved through grassroots development as well as
how these results are linked to sustainability (Vance, 1993, p. 42, 1996, p. 4). The framework of
the GDF is conceptualized through a cone.
Underlying the framework of the GDF are two intellectual notions. The first is that tangible
and intangible effects are equally important for long-term development success. To reflect this
belief the cone is divided into two sections: tangible gains and intangible gains. The second notion
is that grassroots development must attend to three levels:
1) Improving immediate conditions for direct beneficiaries, most often participants and their
families
2) Strengthening community organizations and local support networks
3) Influencing public policies, practices, and attitudes to confront the causes of poverty
(Vance, 1993, p. 42).
The two sections and three levels of the cone are depicted in figure 1. The widening of the cone is
intended to represent the impact of grassroots development as it manifests from the direct
beneficiary through the organization and to the community or society at large.
Social Capital 35
Figure 1
Tangible Intangible
Broader Impact
Strengthening Communities
Direct
Beneficiaries
There are six windows in the cone. Specific variables that are associated with each of these
windows are depicted in figure 2. Balance among these variables is considered by the Foundation
to be the key to successful grassroots development (Vance, 1996, p. 4).
Figure 2
Tangible Intangible
Policy Environment Community Norms
Laws Values
Policies Attitudes
Practices Relations
Organization Capacity Organizational Culture
Planning Vision
Administration Democratic Practice
Resources Autonomy
Reach/Linkages Solidarity
Standard of Living Personal Capacity
Basic Needs Self-esteem
Knowledge/Skills Cultural Identity
Employment/Income Creativity
Assets Critical Reflection
Social Capital 36
The GDF is introduced to each grantee during an orientation visit prior to the first
disbursement of IAF funding. At the meeting IAF staff work with the grantees to identify the
indicators that will be used to biannually gauge the progress of the grantee organization.
Subsequently, in-country data verifiers that are accountable to the Foundation visit the grantee
every six months, confirm the grantee’s representations of progress through on-site interviews and
observations, and submit reports to the IAF.
To this day, the Foundation continues to refine the GDF. For example, data is now
collected with a gender breakdown, indicators on work with disabled beneficiaries and the impact
of IAF funding on infrastructure (including environment protection) have been added to the
Framework. In addition, the GDF has been updated for easier entry of information. Currently, the
GDF is available in Spanish, Portuguese, French, Creole and English (Vance, 2009, p. 29).
Marion Ritchey Vance of the IAF (1996) highlighted the additional information that was
gleaned by using the GDF to assess the effectiveness a Mexican grantee named Program for
Integrated Use of Natural Resources (PAIR). According to Vance, the new set of questions that
were posed through use of the GDF provided the IAF with previously unavailable details such as
that PAIR had collaborated with half a dozen major NGOs in the area, worked closely with local
and regional producer organizations, PAIR coverage expanded from the two pilot municipalities to
10 additional municipalities, involving local government, NGOs and peasant organizations, and
finally, that several of the founders of PAIR were appointed to national posts where they could
promote on a national scale the approaches to natural resource use and conservation that PAIR
believed in (p. 8).
Social Capital 37
Part V: Integrating the GDF and Measurements of Social Capital
There are many reasons to believe that various measures of social capital can indeed be
assessed through use of the GDF:
• The division of the GDF into tangible and intangible aspects is a useful proxy for
measuring the structural and cognitive community conditions that beget social capital.
• The three-tiered structure of the GDF can help the IAF to determine where bonding,
bridging, and linking networks exist.
• Researchers Bebbington and Carroll confirmed the view that the GDF could and even
should be used to measure various dimensions of social capital through their assertion that
the organizational variables constructed by the IAF “represent patterns of organized
collective action and interaction”, and “can be used to measure the process itself or the
outcome of the process14
(p. 253).
The intellectual underpinnings of the SC-IQ provide a good base for assessment of social
capital at the IAF. In order to harness the analytic potential of the SC-IQ, Grootaert et al stressed
the importance of collecting data that represents each of the six dimensions of social capital that he
identified. Figure 3 shows how such data collection is indeed possible through use of the GDF:
14
Bebbington and Carroll (2000) considered collective action to be the institutional source of social capital
accumulation and embodiment of accumulated social capital (p. 253).
Social Capital 38
Figure 3
Tangible Intangible
Policy Environment Community Norms Social Cohesion and
Inclusion
Collective Action
and Cooperation Organizational Organizational
Capacity Culture Empowerment
Groups and Networks and Political
Action
Standard of Personal
Living Capacity
Information and Communication Trust and Solidarity
Focusing on the most recent six-month data collection period,15
I randomly selected and
reviewed the GDF data that was reported on by 20 current grantees. Specifically, I looked at how
many variables from the GDF were reported on from each of the three levels of the GDF – society,
organization, individual – plus another category labeled other. Table 11 summarizes the results:
15
While the precise start and end dates for the six-month period reported on marginally differs for each grantee, the
period of focus begins in 2010 and ends in 2011 for every single report outlined here.
Social Capital 39
Table 11
Indicators for which GDF Data of 20 Randomly Selected Grantees was Collected During the Most
Recent Six Month Period
Society Organization Individual Other Total
ME 502 0 3 1 1 5
ME 498 0 4 0 1 5
ME 507 0 2 2 3 7
EC 398 1 2 3 0 6
EC 404 0 2 4 0 6
EC 412 0 3 3 0 6
AR 349 0 2 2 0 4
AR 352 0 2 2 0 4
PN 287 0 2 3 1 6
PN 293 0 2 3 3 8
PN 299 0 2 5 1 8
VZ 202 0 4 4 1 9
VZ 203 0 4 5 0 9
CO 518 0 1 1 1 3
CO 524 0 2 1 0 3
DR 336 0 2 4 0 6
DR 338 0 2 2 2 6
DR 341 0 0 5 0 5
PU 556 1 3 2 2 11
PU 562 0 3 5 1 9
Average 0.1 2.35 2.85 0.85 6.3
Median 0 2 3 1 6
Based on this review of 20 randomly selected projects, the median number of indicators
selected to report on was six. Variables chosen at the societal level are lowest with a median
number of 0 and a slightly higher average of 0.1, while individual level variables, with an average
of 2.85, were reported on most often. On average organizational indicators are reported on 2.35
times, and other indicators 0.85 times. According to these results, the information that is currently
collected at the IAF through the GDF does not adequately represent the six dimensions of social
capital that Grooetaert et al maintained must be considered in order to analyze social capital. When
the indicators on which to report grantee progress are selected care must be taken to ensure that an
Social Capital 40
adequate number of indicators that represent each of the six dimensions of social capital are
selected if various levels of social capital are to be measured.
In order to decide which of a vast number of variables to use to assess social capital,
Grootaert et al recommended preceding quantitative analysis with qualitative analysis. The IAF
already has in place a strong system for the qualitative assessment of grantees before, during, and
after funding periods. The in-depth information gleaned from such qualitative analysis can be
employed to help IAF staff and grantee organizations successfully select indicators that can be
used to assess social capital.
The work that was conducted by Bebbington and Carroll (2000) in the Andes provides
evidence of the plausibility of such a strategy. Through in-depth qualitative analysis and
comparisons of organizations in the Andes of Bolivia, Ecuador, and Peru, Bebbington and Carroll
were able to develop indicators that helped to identify the different dimensions of social capital
existent in those organizations, the impacts of that social capital on development, and how such
social capital might be created through external intervention.
Judy Baker (2000) of the World Bank confirmed the notion that some level of evaluation
can occur even when statistical controls are not present. According to Baker, a baseline survey that
is conducted prior to the intervention acts as the comparison group. Impact is then measured
through follow up surveys that record changes in outcome indicators before and after the
interventions (p. 28). This method of evaluation is not new to the IAF. The significance of
outlining it here is to show how the IAF can legitimately employ methodologies that it already
uses to assess levels of social capital.
A concern voiced by staff at the IAF is that the funding structure of the IAF, through which
funding and data collection targets single grassroots organizations and communities, does not
Social Capital 41
allow for data collection on control groups. This seriously impedes the ability of the IAF to assess
causation during its evaluation process. For example, during an IAF funding period the
participants of a grantee organization may experience increased welfare in the form of say greater
access to education and health services. However, there are many factors that could have caused
this increase in welfare. Without the assessment of similar groups that control for other possible
inducements of welfare, it is impossible to say with statistical certainty that the grant distributed by
the IAF is what caused the increase in welfare enjoyed by participants of the grantee organization.
The implication of this is that while the IAF may be able to assess levels of social capital and
welfare, the successful assessment of the creation of social capital, how social capital affects
welfare, and more specifically changes in social capital that occur as a result of IAF grants, is
questionable. A manageable, short-run focus of the IAF should be successfully identifying
variables that will serve as proxies for various dimensions of social capital, and collecting the
necessary data to conduct reflexive comparisons aimed at answering pre-identified questions
concerning levels of social capital and welfare.
Social Capital 42
References
Baker, J. L. (2000). Evaluating the impact of development projects on poverty: A handbook for
practitioners. Washington: The International Bank for Reconstruction and Development /
The World Bank.
Bebbington, A., & T. Carroll (2000). Induced social capital and federations of the rural poor in the
Andes. In H. Christiaan, & T. van Bastelaer (Eds.), The role of social capital in
development (pp. 234-278). Cambridge: Cambridge University Press.
Breslin, P. (2004). Thinking outside Newton’s box: Metaphors for grassroots development.
Grassroots Development, 25(1), 1-9.
Coleman, J. (1988). Social capital in the creation of human capital. The American Journal of
Sociology, 94, 95-120. Retrieved June 14, 2011, from JSTOR database (2780243).
Fafchamps, M., & B. Minten (1999). Social capital and the firm: Evidence from agricultural
traders in Madagascar. In H. Christiaan, & T. van Bastelaer (Eds.), The role of social
capital in development (pp. 125-154). Cambridge: Cambridge University Press.
Grootaert, C., D. Narayan, V. N. Jones, M. Woolcock (2004). Measuring social capital: An
integrated questionnaire. Washington: The International Bank for Reconstruction and
Development / The World Bank.
Gugerty, M.K., & M Kremer (2000). The impact of development assistance on social capital:
Evidence from Kenya. In H. Christiaan, & T. van Bastelaer (Eds.), The role of social
capital in development (pp. 213-233). Cambridge: Cambridge University Press.
Inter-American Foundation. (1977). They know how… an experiment in development assistance.
Washington: Library of Congress Catalog.
Social Capital 43
Krishna, A., & E. Shrader (2000). Cross cultural measures of social capital: A tool and results
from
India and Panama. Washington: The World Bank.
Krishna, A., & N. Uphoff (1999). Mapping and measuring social capital through assessment of
collective action to conserve and develop watersheds in Rajasthan, India. In H. Christiaan,
& T. van Bastelaer (Eds.), The role of social capital in development (pp. 85-124).
Cambridge: Cambridge University Press.
Portes, A. (1998). Social capital: Its origins and applications in modern sociology. Annual Review
of Sociology, 24, 1-24. Retrieved July 21, 2011, from JSTOR database (223472).
Ritchey-Vance, M. (1996). Social capital, sustainability, and working democracy: New yardsticks
for grassroots development. Grassroots Development, 20(1), 3-9.
Ritchey-Vance, M. (2003). Grassroots development results – widening the lens. Grassroots
Development, 17(1), 42-43.
Vance, R. M. (2009). Measures to match the mission: How the Grassroots Development
Framework came to be. Grassroots Development, 30(1), 20-29.
Woolcock, M., & D. Narayan (2000). Social capital: Implications for development theory,
research, and policy. The World Bank Research Observer, 15(2), 225-49.

More Related Content

What's hot

What is social capital
What is social capitalWhat is social capital
What is social capitalguest4f7e681a
 
Yanuar Nugroho - The Internet in CSOs
Yanuar Nugroho - The Internet in CSOsYanuar Nugroho - The Internet in CSOs
Yanuar Nugroho - The Internet in CSOsIan Miles
 
Lecture_social capital
Lecture_social capitalLecture_social capital
Lecture_social capitalSarah Jamieson
 
Second ARC (Ninth report) - social capital
Second ARC (Ninth report) - social capitalSecond ARC (Ninth report) - social capital
Second ARC (Ninth report) - social capitalConsultant
 
Page 284 the journal of social media in s
Page 284                    the journal of social media in sPage 284                    the journal of social media in s
Page 284 the journal of social media in samit657720
 
NGO Global Governance and the UN
NGO Global Governance and the UN NGO Global Governance and the UN
NGO Global Governance and the UN Dr Lendy Spires
 
Accountability in poverty_reduction_strategies
Accountability in poverty_reduction_strategiesAccountability in poverty_reduction_strategies
Accountability in poverty_reduction_strategiesDr Lendy Spires
 
International Journal of Humanities and Social Science Invention (IJHSSI)
International Journal of Humanities and Social Science Invention (IJHSSI)International Journal of Humanities and Social Science Invention (IJHSSI)
International Journal of Humanities and Social Science Invention (IJHSSI)inventionjournals
 
Letters 1-11 from Whitaker_BioregionalState2005_book
Letters 1-11  from Whitaker_BioregionalState2005_bookLetters 1-11  from Whitaker_BioregionalState2005_book
Letters 1-11 from Whitaker_BioregionalState2005_bookMark Whitaker
 
LinkedInVersionOfBernieBarackLetter
LinkedInVersionOfBernieBarackLetterLinkedInVersionOfBernieBarackLetter
LinkedInVersionOfBernieBarackLetterWilliam Reichertz
 
Civil society and economic development
Civil society and economic developmentCivil society and economic development
Civil society and economic developmentellaboi
 
Learning through practice kligler shresthova-oct-2-2012
Learning through practice kligler shresthova-oct-2-2012Learning through practice kligler shresthova-oct-2-2012
Learning through practice kligler shresthova-oct-2-2012amandafo
 
Social media and counter democracy
Social media  and counter democracySocial media  and counter democracy
Social media and counter democracyTalew GUALU
 

What's hot (20)

What is social capital
What is social capitalWhat is social capital
What is social capital
 
Yanuar Nugroho - The Internet in CSOs
Yanuar Nugroho - The Internet in CSOsYanuar Nugroho - The Internet in CSOs
Yanuar Nugroho - The Internet in CSOs
 
Lecture_social capital
Lecture_social capitalLecture_social capital
Lecture_social capital
 
Second ARC (Ninth report) - social capital
Second ARC (Ninth report) - social capitalSecond ARC (Ninth report) - social capital
Second ARC (Ninth report) - social capital
 
Page 284 the journal of social media in s
Page 284                    the journal of social media in sPage 284                    the journal of social media in s
Page 284 the journal of social media in s
 
NGO Global Governance and the UN
NGO Global Governance and the UN NGO Global Governance and the UN
NGO Global Governance and the UN
 
Accountability in poverty_reduction_strategies
Accountability in poverty_reduction_strategiesAccountability in poverty_reduction_strategies
Accountability in poverty_reduction_strategies
 
International Journal of Humanities and Social Science Invention (IJHSSI)
International Journal of Humanities and Social Science Invention (IJHSSI)International Journal of Humanities and Social Science Invention (IJHSSI)
International Journal of Humanities and Social Science Invention (IJHSSI)
 
Chapter06
Chapter06Chapter06
Chapter06
 
Letters 1-11 from Whitaker_BioregionalState2005_book
Letters 1-11  from Whitaker_BioregionalState2005_bookLetters 1-11  from Whitaker_BioregionalState2005_book
Letters 1-11 from Whitaker_BioregionalState2005_book
 
Social capital
Social capitalSocial capital
Social capital
 
An Appraisal of Women Targeted Microfinance in Nigeria: A Review of the Activ...
An Appraisal of Women Targeted Microfinance in Nigeria: A Review of the Activ...An Appraisal of Women Targeted Microfinance in Nigeria: A Review of the Activ...
An Appraisal of Women Targeted Microfinance in Nigeria: A Review of the Activ...
 
Social capital
Social capitalSocial capital
Social capital
 
LinkedInVersionOfBernieBarackLetter
LinkedInVersionOfBernieBarackLetterLinkedInVersionOfBernieBarackLetter
LinkedInVersionOfBernieBarackLetter
 
Civil society and economic development
Civil society and economic developmentCivil society and economic development
Civil society and economic development
 
Global governance
Global governanceGlobal governance
Global governance
 
Aartscholteaccountable
AartscholteaccountableAartscholteaccountable
Aartscholteaccountable
 
Learning through practice kligler shresthova-oct-2-2012
Learning through practice kligler shresthova-oct-2-2012Learning through practice kligler shresthova-oct-2-2012
Learning through practice kligler shresthova-oct-2-2012
 
D4D_PI_2_ENG_WEB1
D4D_PI_2_ENG_WEB1D4D_PI_2_ENG_WEB1
D4D_PI_2_ENG_WEB1
 
Social media and counter democracy
Social media  and counter democracySocial media  and counter democracy
Social media and counter democracy
 

Viewers also liked

Social capital questionnaire 2013 tsn
Social capital questionnaire 2013 tsnSocial capital questionnaire 2013 tsn
Social capital questionnaire 2013 tsnTeachSocialNetworks
 
Global knowledge management_pawlowski_2012
Global knowledge management_pawlowski_2012Global knowledge management_pawlowski_2012
Global knowledge management_pawlowski_2012Jan Pawlowski
 
student satisfaction questionnaire
 student satisfaction questionnaire student satisfaction questionnaire
student satisfaction questionnaireRidwan Nadir
 
Final project: A Survey of Convenience and Benefit of Social Networking Sites...
Final project: A Survey of Convenience and Benefit of Social Networking Sites...Final project: A Survey of Convenience and Benefit of Social Networking Sites...
Final project: A Survey of Convenience and Benefit of Social Networking Sites...hoyaohong
 
Negative impacts of social media as my space and facebook on teenagers in th...
Negative impacts of social media as my space and facebook on teenagers  in th...Negative impacts of social media as my space and facebook on teenagers  in th...
Negative impacts of social media as my space and facebook on teenagers in th...GeorgeDolezal
 
Introduction to Strategy Maps - A Book by Robert S Kaplan and David P Norton
Introduction to Strategy Maps - A Book by Robert S Kaplan and David P NortonIntroduction to Strategy Maps - A Book by Robert S Kaplan and David P Norton
Introduction to Strategy Maps - A Book by Robert S Kaplan and David P NortonEndro Catur
 
Influence of social media on the academic performance of the undergraduate st...
Influence of social media on the academic performance of the undergraduate st...Influence of social media on the academic performance of the undergraduate st...
Influence of social media on the academic performance of the undergraduate st...Alexander Decker
 
Research on Negative Effects Of Using Social Media
Research on Negative Effects Of Using Social MediaResearch on Negative Effects Of Using Social Media
Research on Negative Effects Of Using Social MediaUsman Ali
 
The effects of social media on college students
The effects of social media on college studentsThe effects of social media on college students
The effects of social media on college studentsArina Fauzi
 
Effect of online social networking sites on student engagement and achievement
Effect of online social networking sites on student engagement and achievementEffect of online social networking sites on student engagement and achievement
Effect of online social networking sites on student engagement and achievementliz99power
 
Effects of social media on Youth
Effects of social media on YouthEffects of social media on Youth
Effects of social media on YouthSubham Dwivedi
 
Factors affecting the academic performance of college students (1)
Factors affecting the academic performance of college students (1)Factors affecting the academic performance of college students (1)
Factors affecting the academic performance of college students (1)Shubham Aggarwal
 
Questionnaire for the survey of electronics market(for school/college projects)
Questionnaire for the survey of electronics market(for school/college projects)Questionnaire for the survey of electronics market(for school/college projects)
Questionnaire for the survey of electronics market(for school/college projects)Dan John
 
USE OF SOCIAL NETWORKS AND ITS EFFECTS ON STUDENTS
USE OF SOCIAL NETWORKS AND ITS EFFECTS ON STUDENTS USE OF SOCIAL NETWORKS AND ITS EFFECTS ON STUDENTS
USE OF SOCIAL NETWORKS AND ITS EFFECTS ON STUDENTS Mahesh Kodituwakku
 
Effects of social media on youth
Effects of social media on youthEffects of social media on youth
Effects of social media on youthAkshay Mistri
 
THE EFFECTS OF SOCIAL NETWORKING SITES ON THE ACADEMIC PERFORMANCE OF STUDENT...
THE EFFECTS OF SOCIAL NETWORKING SITES ON THE ACADEMIC PERFORMANCE OF STUDENT...THE EFFECTS OF SOCIAL NETWORKING SITES ON THE ACADEMIC PERFORMANCE OF STUDENT...
THE EFFECTS OF SOCIAL NETWORKING SITES ON THE ACADEMIC PERFORMANCE OF STUDENT...Kasthuripriya Nanda Kumar
 

Viewers also liked (19)

Social capital questionnaire 2013 tsn
Social capital questionnaire 2013 tsnSocial capital questionnaire 2013 tsn
Social capital questionnaire 2013 tsn
 
Global knowledge management_pawlowski_2012
Global knowledge management_pawlowski_2012Global knowledge management_pawlowski_2012
Global knowledge management_pawlowski_2012
 
student satisfaction questionnaire
 student satisfaction questionnaire student satisfaction questionnaire
student satisfaction questionnaire
 
Final project: A Survey of Convenience and Benefit of Social Networking Sites...
Final project: A Survey of Convenience and Benefit of Social Networking Sites...Final project: A Survey of Convenience and Benefit of Social Networking Sites...
Final project: A Survey of Convenience and Benefit of Social Networking Sites...
 
Negative impacts of social media as my space and facebook on teenagers in th...
Negative impacts of social media as my space and facebook on teenagers  in th...Negative impacts of social media as my space and facebook on teenagers  in th...
Negative impacts of social media as my space and facebook on teenagers in th...
 
Introduction to Strategy Maps - A Book by Robert S Kaplan and David P Norton
Introduction to Strategy Maps - A Book by Robert S Kaplan and David P NortonIntroduction to Strategy Maps - A Book by Robert S Kaplan and David P Norton
Introduction to Strategy Maps - A Book by Robert S Kaplan and David P Norton
 
Influence of social media on the academic performance of the undergraduate st...
Influence of social media on the academic performance of the undergraduate st...Influence of social media on the academic performance of the undergraduate st...
Influence of social media on the academic performance of the undergraduate st...
 
Research on Negative Effects Of Using Social Media
Research on Negative Effects Of Using Social MediaResearch on Negative Effects Of Using Social Media
Research on Negative Effects Of Using Social Media
 
The effects of social media on college students
The effects of social media on college studentsThe effects of social media on college students
The effects of social media on college students
 
Effect of online social networking sites on student engagement and achievement
Effect of online social networking sites on student engagement and achievementEffect of online social networking sites on student engagement and achievement
Effect of online social networking sites on student engagement and achievement
 
Effects of social media on Youth
Effects of social media on YouthEffects of social media on Youth
Effects of social media on Youth
 
Factors affecting the academic performance of college students (1)
Factors affecting the academic performance of college students (1)Factors affecting the academic performance of college students (1)
Factors affecting the academic performance of college students (1)
 
Questionaire
QuestionaireQuestionaire
Questionaire
 
Questionnaire for the survey of electronics market(for school/college projects)
Questionnaire for the survey of electronics market(for school/college projects)Questionnaire for the survey of electronics market(for school/college projects)
Questionnaire for the survey of electronics market(for school/college projects)
 
Questionnaire
QuestionnaireQuestionnaire
Questionnaire
 
USE OF SOCIAL NETWORKS AND ITS EFFECTS ON STUDENTS
USE OF SOCIAL NETWORKS AND ITS EFFECTS ON STUDENTS USE OF SOCIAL NETWORKS AND ITS EFFECTS ON STUDENTS
USE OF SOCIAL NETWORKS AND ITS EFFECTS ON STUDENTS
 
Effects of social media on youth
Effects of social media on youthEffects of social media on youth
Effects of social media on youth
 
THE EFFECTS OF SOCIAL NETWORKING SITES ON THE ACADEMIC PERFORMANCE OF STUDENT...
THE EFFECTS OF SOCIAL NETWORKING SITES ON THE ACADEMIC PERFORMANCE OF STUDENT...THE EFFECTS OF SOCIAL NETWORKING SITES ON THE ACADEMIC PERFORMANCE OF STUDENT...
THE EFFECTS OF SOCIAL NETWORKING SITES ON THE ACADEMIC PERFORMANCE OF STUDENT...
 
Final na final thesis
Final na final thesisFinal na final thesis
Final na final thesis
 

Similar to Social Capital and Grassroots Development: Measuring Impacts

Approaches to Community Organizing and Their Relationship to Consens.docx
Approaches to Community Organizing and Their Relationship to Consens.docxApproaches to Community Organizing and Their Relationship to Consens.docx
Approaches to Community Organizing and Their Relationship to Consens.docxalfredai53p
 
Annotated Bibliography And Summary On Social Cohesion Literature Summary
Annotated Bibliography And Summary On Social Cohesion Literature SummaryAnnotated Bibliography And Summary On Social Cohesion Literature Summary
Annotated Bibliography And Summary On Social Cohesion Literature SummaryApril Smith
 
Social Capital Building Toolkit Version 1.2 (Thomas Sander.docx
 Social Capital Building Toolkit   Version 1.2  (Thomas Sander.docx Social Capital Building Toolkit   Version 1.2  (Thomas Sander.docx
Social Capital Building Toolkit Version 1.2 (Thomas Sander.docxMARRY7
 
Trust Domination Based on Local Wisdom in The Concept of Social Capital in Lo...
Trust Domination Based on Local Wisdom in The Concept of Social Capital in Lo...Trust Domination Based on Local Wisdom in The Concept of Social Capital in Lo...
Trust Domination Based on Local Wisdom in The Concept of Social Capital in Lo...AJHSSR Journal
 
International Journal of Engineering Research and Development (IJERD)
International Journal of Engineering Research and Development (IJERD)International Journal of Engineering Research and Development (IJERD)
International Journal of Engineering Research and Development (IJERD)IJERD Editor
 
Social capital and virtual communities
Social capital and virtual communitiesSocial capital and virtual communities
Social capital and virtual communitiesMiia Kosonen
 
Social Capital for Better Community Living
Social Capital for Better Community LivingSocial Capital for Better Community Living
Social Capital for Better Community LivingDevegowda S R
 
Accountability CED: The Funder-Governed NGO
Accountability CED: The Funder-Governed NGOAccountability CED: The Funder-Governed NGO
Accountability CED: The Funder-Governed NGORyan MacNeil
 
Networking | Social Circle Memberships and Sales Performance Implications
Networking | Social Circle Memberships and Sales Performance ImplicationsNetworking | Social Circle Memberships and Sales Performance Implications
Networking | Social Circle Memberships and Sales Performance ImplicationsProfessional Capital
 
Dimitrova Review Of Cayey
Dimitrova Review Of CayeyDimitrova Review Of Cayey
Dimitrova Review Of CayeyDima Dimitrova
 
Building Social Capital
Building Social CapitalBuilding Social Capital
Building Social CapitalLaura Alonso
 
THE CONCEPT OF SOCIAL CAPITAL.pptx
THE CONCEPT OF SOCIAL CAPITAL.pptxTHE CONCEPT OF SOCIAL CAPITAL.pptx
THE CONCEPT OF SOCIAL CAPITAL.pptxThomas Owondo
 
Week 3Social vulnerability to disaster myth of community, gen.docx
Week 3Social vulnerability to disaster myth of community, gen.docxWeek 3Social vulnerability to disaster myth of community, gen.docx
Week 3Social vulnerability to disaster myth of community, gen.docxjessiehampson
 
Interrelation between Cross-Border Cooperation (CBC) and Social Capital: Conc...
Interrelation between Cross-Border Cooperation (CBC) and Social Capital: Conc...Interrelation between Cross-Border Cooperation (CBC) and Social Capital: Conc...
Interrelation between Cross-Border Cooperation (CBC) and Social Capital: Conc...Środkowoeuropejskie Studia Polityczne
 
Part I Studying nonprofit organizationsThe study of nonprofit.docx
Part I Studying nonprofit organizationsThe study of nonprofit.docxPart I Studying nonprofit organizationsThe study of nonprofit.docx
Part I Studying nonprofit organizationsThe study of nonprofit.docxdanhaley45372
 

Similar to Social Capital and Grassroots Development: Measuring Impacts (20)

Approaches to Community Organizing and Their Relationship to Consens.docx
Approaches to Community Organizing and Their Relationship to Consens.docxApproaches to Community Organizing and Their Relationship to Consens.docx
Approaches to Community Organizing and Their Relationship to Consens.docx
 
5319d48b3a9b49.44872855 (2)
5319d48b3a9b49.44872855 (2)5319d48b3a9b49.44872855 (2)
5319d48b3a9b49.44872855 (2)
 
Annotated Bibliography And Summary On Social Cohesion Literature Summary
Annotated Bibliography And Summary On Social Cohesion Literature SummaryAnnotated Bibliography And Summary On Social Cohesion Literature Summary
Annotated Bibliography And Summary On Social Cohesion Literature Summary
 
Social Capital Building Toolkit Version 1.2 (Thomas Sander.docx
 Social Capital Building Toolkit   Version 1.2  (Thomas Sander.docx Social Capital Building Toolkit   Version 1.2  (Thomas Sander.docx
Social Capital Building Toolkit Version 1.2 (Thomas Sander.docx
 
Trust Domination Based on Local Wisdom in The Concept of Social Capital in Lo...
Trust Domination Based on Local Wisdom in The Concept of Social Capital in Lo...Trust Domination Based on Local Wisdom in The Concept of Social Capital in Lo...
Trust Domination Based on Local Wisdom in The Concept of Social Capital in Lo...
 
International Journal of Engineering Research and Development (IJERD)
International Journal of Engineering Research and Development (IJERD)International Journal of Engineering Research and Development (IJERD)
International Journal of Engineering Research and Development (IJERD)
 
Social capital and virtual communities
Social capital and virtual communitiesSocial capital and virtual communities
Social capital and virtual communities
 
492281261
492281261492281261
492281261
 
Social Capital for Better Community Living
Social Capital for Better Community LivingSocial Capital for Better Community Living
Social Capital for Better Community Living
 
WP19_WEB.PDF
WP19_WEB.PDFWP19_WEB.PDF
WP19_WEB.PDF
 
Accountability CED: The Funder-Governed NGO
Accountability CED: The Funder-Governed NGOAccountability CED: The Funder-Governed NGO
Accountability CED: The Funder-Governed NGO
 
Networking | Social Circle Memberships and Sales Performance Implications
Networking | Social Circle Memberships and Sales Performance ImplicationsNetworking | Social Circle Memberships and Sales Performance Implications
Networking | Social Circle Memberships and Sales Performance Implications
 
Dimitrova Review Of Cayey
Dimitrova Review Of CayeyDimitrova Review Of Cayey
Dimitrova Review Of Cayey
 
Sociology
SociologySociology
Sociology
 
Building Social Capital
Building Social CapitalBuilding Social Capital
Building Social Capital
 
Lecture 3
Lecture 3Lecture 3
Lecture 3
 
THE CONCEPT OF SOCIAL CAPITAL.pptx
THE CONCEPT OF SOCIAL CAPITAL.pptxTHE CONCEPT OF SOCIAL CAPITAL.pptx
THE CONCEPT OF SOCIAL CAPITAL.pptx
 
Week 3Social vulnerability to disaster myth of community, gen.docx
Week 3Social vulnerability to disaster myth of community, gen.docxWeek 3Social vulnerability to disaster myth of community, gen.docx
Week 3Social vulnerability to disaster myth of community, gen.docx
 
Interrelation between Cross-Border Cooperation (CBC) and Social Capital: Conc...
Interrelation between Cross-Border Cooperation (CBC) and Social Capital: Conc...Interrelation between Cross-Border Cooperation (CBC) and Social Capital: Conc...
Interrelation between Cross-Border Cooperation (CBC) and Social Capital: Conc...
 
Part I Studying nonprofit organizationsThe study of nonprofit.docx
Part I Studying nonprofit organizationsThe study of nonprofit.docxPart I Studying nonprofit organizationsThe study of nonprofit.docx
Part I Studying nonprofit organizationsThe study of nonprofit.docx
 

Social Capital and Grassroots Development: Measuring Impacts

  • 1. Social Capital i Social Capital and Grassroots Development Celeste Visser Jose Toasa September 2, 2011
  • 2. Social Capital ii Table of Contents Part I: Social Capital – Views and Definitions …………………………………………… 1 The Communitarian View …………………………………………………………. 2 The Networks View ………………………………………………………………… 3 The Institutional View ……………………………………………………………... 5 The Synergy View ………………………………………………………………….. 6 Part II: Defining Social Capital at the Inter-American Foundation ……………………. 6 Part III: Methodologies for Measuring Social Capital …………………………………... 8 Levels of Social Capital …………………………………………………………….. 9 How Social Capital Affects Welfare ……………………………………………… 12 The Creation of Social Capital ……………………………………………………. 24 Part IV: The Grassroots Development Framework …………………………………….. 34 Part V: Integrating the GDF and Measurements of Social Capital ……………………. 37
  • 3. Social Capital 1 Social Capital and Grassroots Development Major technical refinements have increased the capacity for analytical measurements of growth since the end of the Second World War. However, these tools have not explained variations in growth rates among countries with similar stocks of natural and physical capital, or variations in project performance among similar communities. By the 1960s, the impact of human capital on growth and development was recognized. It wasn’t until the 1980s, however, that the role of social capital became accepted as a factor that affects development. A comprehensive literature review of the major perspectives on social capital comprises the first section of this paper. Key takeaways are that social capital is multidimensional, should be considered at varying levels, and it is neither inherently good nor bad. The second part of this paper will attempt to define social capital in terms of the grassroots development efforts that the Inter-American Foundation (IAF) engages in. Next, I will outline methods that prominent scholars have employed in the field to study important aspects of social capital. Such aspects include how to measure levels of social capital, how social capital affects welfare, and the creation of social capital. The IAF has developed a framework to measure the organizational capacity of its grantees called the Grassroots Development Framework (GDF). Section four of this paper includes an overview of the GDF. Finally, this paper will conclude with ideas regarding how the IAF might apply the GDF so as to facilitate the measurement of social capital as it applies to grassroots development. Part I: Social Capital – Views and Definitions Contemporary research by scholars Robert Putnam on civic traditions in modern Italy and James Coleman on social capital’s effect on high school attrition rates catalyzed further research in
  • 4. Social Capital 2 the field. Current conceptualizations of what constitutes social capital are divided between four main camps: the communitarian, networks, institutional, and synthesis views. The Communitarian View The communitarian view of social capital emphasizes the value of civil ties. Researchers Michael Woolcock and Deepa Narayan have argued that social capital is embodied in local organizations such as clubs, associations, and civic groups. Proponents of this view believe that social capital is inherently good, will always have a positive effect on a community’s welfare, and that more is always better (p. 229). In 1970, Italy engaged in an unprecedented process of decentralization. Putnam (2002) recognized the events in Italy as an opportunity to explore the origins of effective government and to research how institutions develop and adapt to their social environment. Nearly two and a half decades later he concluded that social capital might be even more important than physical or human capital for political stability, for government effectiveness, and for economic progress (p. 183). According to Putnam (2002), civic activity improves the efficiency of society by facilitating horizontal networks based on equality and cooperation, coordinated actions for mutual benefit, and collective problem solving. It builds the trust, norms, and networks necessary to enable rational individuals to overcome collective dilemmas1 and the opportunism that is generated by these predicaments (p. 167). While many positive externalities often arise as the result of strong civic ties, the communitarian perspective fails to address the downside or costs that can also be associated with social capital. For example, Portes and Sensenbrenner (1993) discussed how community ties often 1 Putnam discusses several well-known collective dilemmas, including the tragedy of the commons, the provision of public goods, the logic of collective action, and the prisoner’s dilemma (p. 163).
  • 5. Social Capital 3 place considerable financial and social constraints on Asian immigrants. It is not uncommon for Asian immigrants to anglicize their names in order to divest themselves of these suppressing associational ties. Other adverse consequences of social capital will be discussed in further detail later. Woolcock and Narayan (2000) criticized the communitarian view on the basis that it assumes that communities are homogenous entities that include and benefit all members. In reality, denigrating social constructs such as caste inequality, ethnic exclusion, and gender discrimination often impede a successfully egalitarian distribution of benefits. Furthermore, these authors stated that high levels of social solidarity or informal groups will not necessarily lead to prosperity if such groups lack the resources and access to power that is necessary to succeed (p. 230). The Networks View The networks view attempts to account for both the upside and downside of social capital. According to Woolcock and Narayan (2000), supporters of this perspective maintain that different combinations of strong intra-community ties known as “bonding2 ” and weak inter-community ties commonly referred to as “bridging3 ” are responsible for the range of outcomes that can be attributed to social capital. For example, the dismal situation of community outcasts is thought of as characterized by low levels of both bonding and bridging social capital. Successful members of microfinance programs however, are depicted as individuals who are empowered through high levels of bonding and bridging social capital (p. 231). Kozel and Parker theorized that often the poor substitute a lack of bridging networks with additional bonding networks. These researchers described the bonding networks of the poor as defensive in nature – they are used to survive, and 2 Grootaert et al (2004) defined bonding social capital as “ties to people who are similar in terms of their demographic characteristics, such as family members, neighbors, close friends, and work colleagues” (p. 4). 3 Grootaert et al (2004) defined “bridging” social capital as “ties to people who do not share many of [the characteristics of bonding social capital]” (p. 4).
  • 6. Social Capital 4 the bridging networks of the non-poor as primarily offensive – such networks are used for advancement of material interests (as cited in Woolcock and Narayan, 2000, p. 233). In opposition to the communitarian view, a central tenet of the networks perspective is that the manifestations of social capital can be both positive and negative. While members can accrue the rewards of social capital through a range of services, negative consequences for group members can also surface. Portes (1998) identified four negative consequences of social capital: • The bounded solidarity and trust that comprises the core of a group’s economic advantage may lead to the exclusion of outsiders. • Inter-group relations may give rise to free-riding problems, thus imposing excess claims on group members. • Community and autonomy within a group creates demands for conformity and therefore comes at the cost of reduced privacy and autonomy of individuals. • Downward leveling norms may exist for communities with high levels of social capital; individual success may undermine the cohesion of a group (p. 15-17). Another key belief of the networks view is that in order to critically assess the desirability of an outcome, the sources of social capital must be distinguished from the consequences derived from them. This is because certain outcomes are suboptimal. Positive outcomes for one group may come at the expense of another group, or at the price of significant costs tomorrow (Woolcock and Narayan, 2000, p. 231). The main criticism of the networks view is that it does not account for the capacity for institutions at the societal level to shape and be shaped by local communities. The “public good” nature of social capital is diminished. As such, it is believed that social capital cannot, or should not be measured across larger social aggregates such as societies or nations. Individuals involved
  • 7. Social Capital 5 in groups are regarded as the primary beneficiaries of benefits that may accrue from communal activities (Woolcock and Narayan, 2000, p. 234). The Institutional View Supporters of the institutional view argue that social capital is largely a product of the political, legal, and institutional environment. This hypothesis directly contrasts the networks view, which argues that institutional and community environments emerge as a result of contrasting levels of bonding and bridging social capital. According to this view, reported Douglass North, the degree to which groups are able to organize and act in their collective interest depends on the quality of the formal institutions under which they reside (as cited in Woolcock and Narayan, 2000, p. 234). Indeed, Theda Skocpol (1995, 1996), who is a proponent of the institutional view, concluded from his research that, “civil society thrives to the extent that the state actively encourages it” (as cited in Woolcock and Narayan, 2000, p. 234). Promoters of the institutional view have provided broad statistical evidence for the importance of social capital. For example, Knack and Keefer (1995, 1997) conducted a quantitative cross-national study of the effects of government performance and social divisions on economic performance. These researchers equate social capital with the quality of a society’s political, legal, and economic institutions. Through their studies, Stephen Knack and Philip Keefer have shown that many institutional items such as generalized trust, rule of law, civil liberties, and bureaucratic quality are positively associated with economic growth (as cited in Woolcock and Narayan, 2000, p. 234-235).
  • 8. Social Capital 6 The Synergy View The synergy view integrates the strengths of the networks and institutional perspectives. Woolcock and Narayan (2000) outlined three major points of the synergy view regarding developmental synergies4 that were presented in a 1996 issue of World Development: • Governments, corporations, and civic groups are not inherently good or bad. • Complementarities both within and across states, firms, and communities are essential for the promotion of broad-based, sustainable development. • The state is the final provider of public goods, is the authority of the law, and is the actor best able to encourage enduring alliances across boundaries. As such, the state’s role in facilitating positive developmental outcomes can be both the most important but also the most problematic of these three different sectors (p. 236). In addition to bonding and bridging social capital, Grootaert et al. (2004) discussed the recent academic addition of the idea of linking social capital. They defined this dimension as referring to one’s “ties to people in positions of authority, such as representatives of public (police, political parties) and private (banks) institutions” (p. 4). Part II: Defining Social Capital at the Inter-American Foundation The definition of social capital that most closely aligns with and supports the philosophy underlying the grassroots development approach taken by the Inter-American Foundation (IAF) is the synergy view. The IAF views sources of growth and development as multidimensional in nature. In the same light the IAF should recognize that both structural and cognitive community conditions beget social capital. An important structural element of a society is what type of groups and networks community members have access to. Researchers should consider whether such 4 Woolcok and Narayan (2000) defined developmental synergies as “dynamic professional alliances and relations between and within state bureaucracies and various actors in civil society” (p. 236).
  • 9. Social Capital 7 groups and networks are primarily bonding, bridging, or linking in nature. Of equal importance are cognitive conditions such as individual perceptions of the trustworthiness of other people and key institutions that shape peoples lives, as well as the norms of cooperation and reciprocity that facilitate attempts to work together to solve problems. A comprehensive definition of social capital needs to consider (a) the sources of social capital; (b) the main channels through which it operates; and (c) the major areas of application or outcomes. Grooetaert et al (2004) identified six dimensions of social capital as follows: • Groups and networks – the nature and extent of a household member’s participation in various types of social organizations and informal networks, and the range of contributions that one gives and receives from them. Group diversity, leadership selection, and changes in involvement over time. • Trust and solidarity - trust towards family members, neighbors, key service providers, and strangers, and how these perceptions change over time. • Collective action and cooperation – whether/how joint projects are executed and/or responses to crises are handled. The consequences of violating community expectations regarding participation. • Information and communication – ways and means by which poor receive information regarding market conditions and public services, and the extent of their access to communications infrastructure. • Social cohesion and inclusion – nature and extent of various forms of division and differences, mechanisms by which they are managed, which groups are excluded from key public services, and forms of social interaction.
  • 10. Social Capital 8 • Empowerment and political action – household members’ sense of happiness, personal efficacy, and capacity to influence both local events and broader political outcomes (p. 5). Consideration of these six facets can help the IAF to conceptualize social capital in terms of its sources, channels, and outcomes. The sources of social capital, both structural and cognitive, are depicted through the first two dimensions: groups and networks as well as trust and solidarity. Collective action and cooperation, along with information and communication, constitute the main ways in which social capital operates. Finally, the major applications or outcomes of social capital manifest through social cohesion and inclusion, as well as empowerment and political action. Part III: Methodologies for Measuring Social Capital Numerous methods to measure social capital have been constructed and tested in the field. Contemporary researchers have primarily attempted to devise methods to measure three differing dimensions of the concept: existing levels of social capital, how social capital affects welfare, and the creation of social capital. In the following three sub-sections examples will be given of case studies in which methodologies have been employed to measure each of these dimensions. Research conducted by Anirudh Krishna and Norman Uphoff (2002) will be disaggregated and discussed in each of the corresponding sections. Methods to measure levels of social capital must appear in most relevant studies in order to assess with any degree of validity how social capital affects welfare, and its creation. To avoid redundancy, the study by Krishna and Uphoff is the only study that we will disaggregate in order to independently analyze how levels of social capital were measured. We will then look at three attempts to measure how social capital affects welfare. Finally, four cases in which measures of the creation of social capital are constructed will be discussed.
  • 11. Social Capital 9 Levels of Social Capital Example one. Social capital in Rajasthan, India. This section will look closely at a study that was conducted by researchers Krishna and Uphoff (1999) concerning social capital in Rajasthan, India. While their research examines several aspects of social capital, this section of the paper will focus on their attempts to map levels of social capital through its structural and cognitive forms (p. 86). To provide an empirical basis for evaluating whether or not social capital can be identified and measured empirically, Krishna and Uphoff (1999) identified 64 villages in each of the four districts of Rajasthan. At the time of the study, these villages had participated in a watershed conservation and development program that had been receiving funding from the Indian government and the World Bank since 1991 (p. 85). Examination of information available from project reports allowed Krishna and Uphoff to determine whether prior performance in restoring degraded or vulnerable common lands through collective action was high, medium, or low for each village. The number of high, medium, and low performing villages was spread as evenly as possible across the four districts. A database was constructed through 2,397 interviews with individuals who were selected on the basis of simple random sampling, and 64 focus group sessions with village leaders and elected representatives. In addition, relevant village and household level data was obtained from official records (p. 90). The first measure constructed by Krishna and Uphoff (1999) was named the Common Land Development Index. It was based on six criteria of measured performance in watershed development - quality of work, quality of protection, productivity, voluntary action, diversification
  • 12. Social Capital 10 of activities, and support for local contribution - using factor analysis.5 The six measures proved to be highly correlated, and all of the coefficients were significant at the 0.05 levels or better. The following table shows the average component scores for villages categorized according to whether their Common Land Development Index score was low, medium, or high (p. 92). Table 1 Component scores for villages grouped by Common Land Development Index category Component Low Common Land Development Index (less than 1.5) n = 15 Medium Common Land Development Index (1.5-3.0) n = 23 High Common Land Development Index (3.0 or more) n = 26 Quantity of work 1.23 2.43 2.93 Quality of protection 0.50 0.78 1.80 Productivity 1.00 1.65 3.00 Voluntary action 0.23 0.61 2.00 Diversification of activities 0.12 0.70 2.00 Support for local contributions 0.31 0.65 1.40 Note. This table comes from p. 93 of Krishna, A., & N. Uphoff (1999). Mapping and measuring social capital through assessment of collective action to conserve and develop watersheds in Rajasthan, India. In H. Christiaan, & T. van Bastelaer (Eds.), The role of social capital in development (pp. 85-124). Cambridge: Cambridge University Press. Krishna and Uphoff concluded that there is a single common factor on which all six of these elements load highly, but that several hypotheses could explain these variations in collective action outcomes. Variables that have been identified in the social science literature on development as factors that could account for variations in collective action include relative need of communities, relative need of power holders, government staff support, modernization, heterogeneity and stratification, and literacy. These hypotheses were tested by Krishna and Uphoff through single variant as well as multivariate analysis. The only hypotheses with a significant 5 The index was constructed by first standardizing each item with the values rescaled so that each had a maximum value of 1.0; each variable was given an equal weight within the index and the six scores were then summed. The maximum score was thus 6.0 (Krishna and Uphoff, 1999, p. 92).
  • 13. Social Capital 11 coefficient and correlation with the dependent variable in any of the models was literacy (p. 93- 98). These results indicate that in order to account for the differences observed in the Common Land Development Index other variables that were measured in the field studies needed to be examined. To do so, Krishna and Uphoff set out to develop a broader measure of collective action for development. First, Krishna and Uphoff attempted to test the robustness and breadth of the dependent variable. The hope was to find out whether the Common Land Development Index affects only one set of actions that translate into good performance within a certain sector, or whether the Common Land Development Index corresponds more broadly to a general propensity for collective action at the village level (p. 100). To do so, they developed three other indices that reflect collective action in other areas that are related to development at the village level: community projects, collective representation, and service satisfaction. According to their results, villages with high Common Land Development Indices also had high scores on each of the other three indices. This result supports the hypothesis that there is a single common factor that supports mutually beneficial collective action across diverse areas of development activity (p. 101). The search employed by Krishna and Uphoff for independent measures of social capita relevant to the cultural and historical context in Rajasthan was exploratory in nature. Eventually, these researchers developed and combined six questions to construct an index of social capital. The questions are concerned with social relationships, networks, or the structure of social action, cognitive phenomena regarding social relationships, specifically norms, values, or attitudes that reflect a sense of solidarity and mutual trust (p. 105). Theoretically, this social capital index combines structural and cognitive aspects of social capital, and should reflect the predisposition and ability of people to cooperate for mutual benefit. The responses to the social capital index
  • 14. Social Capital 12 questions were highly correlated and loaded commonly on a single factor.6 Table two displays the correlations between the social capital index and other aspects of social capital. Table 2 Correlations between the social capital index and other aspects of social capital Indicator Correlation Informal networking and mutual supports 0.771 Trust 0.645 Reciprocity 0.492 Solidarity 0.420 Expectations about future cooperation 0.612 Concern for future generations 0.392 Note. This table is adapted from p. 108 of Krishna, A., & N. Uphoff (1999). Mapping and measuring social capital through assessment of collective action to conserve and develop watersheds in Rajasthan, India. In H. Christiaan, & T. van Bastelaer (Eds.), The role of social capital in development (pp. 85-124). Cambridge: Cambridge University Press. a All coefficients significant at the 0.01 level or better. Villages that had high social capital index scores also scored well in terms of other measures of trust and propensity to participate in associations. This supports the notion that Krishna and Uphoff developed a generalized measure of social capital for Rajasthan, India. How Social Capital Effects Welfare Example one. Social capital in Rajasthan, India. Krishna and Uphoff (1999) continued their study of social capital and watershed management that was introduced above by attempting to determine what relationship their social capital index has with the two dependent variables, the Common Land Development Index and the Development-Oriented Collective Action Index. Each index was adjusted to range from 0 to 100 (p. 109). Bivariate regressions of social capital on the Development-Oriented Collective Action 6 “The index score for each village was obtained by summing the six scores after dividing each variable by its range so that each variable had a maximum score of 1.0. The index was rescaled so that values range from 0 to 100 in order to facilitate interpretation of regression results” (Krishna and Uphoff, 1999, p. 107).
  • 15. Social Capital 13 Index and on the Common Land Development Index both produced a positive coefficient for social capital, significant at the 0.01 levels (p. 109). However, Krishna and Uphoff stated that the association between the social capital index and the other two indices was not sufficient to account for a major part of the variation in those variables. Using their database, these researchers constructed three other indices representing characteristics of village social life that might correlate with collective action and development performance: divisions and factions within a village, attitudes and beliefs villagers have about the honesty or dishonesty of fellow villagers, and the level of political competition in the village (p. 109). Four separate regressions on development performance and on watershed performance were conducted using ordinary least squares methodology. Literacy was the one variable from before that was included in these regressions as it was the only alternative hypothesis tested earlier that was associated with the two dependent variables in a statistically significant way (p. 109). The results of these regressions are displayed in tables three and four.
  • 16. Social Capital 14 Table 3 Ordinary least squares regressions on development performance (rescaled Development-Oriented Collective Action Index) Item Model 1 Model 2 Model 3 Model 4 Intercept -18.90 (24.68) -34.3* (18.04) -44.239** (17.627) -40.93** (16.89) Independent variables Social capital index 0.689** (0.276) 0.691** (0.272) 0.721** (0.288) 0.703** (0.261) Divisive factors -0.001 (0.041) Tolerance for dishonesty -0.051 (0.064) Political competition 0.42*** (0.121) 0.38** (0.118) 0.376** (0.120) 0.391*** (0.117) Mechanization 0.205 (0.337) Infrastructure -1.31 (0.884) Literacy 0.732* (0.355) 0.471 (0.321) 0.596* (0.298) Number of castes 0.123 (0.690) Population size 0.005 (0.003) 0.002 (0.003) n 64 64 62 64 R² 0.277 0.354 0.331 0.315 Adjusted R² 0.226 0.283 0.271 0.286 F-ratio 5.453 5.018 5.536 8.91 F-probability 0.0009 0.0004 0.0003 0.0001 Durbun-Watson statistic 1.973 2.02 1.946 1.959 Notes: This table comes from p. 112 in Krishna, A., & N. Uphoff (1999). Mapping and measuring social capital through assessment of collective action to conserve and develop watersheds in Rajasthan, India. In H. Christiaan, & T. van Bastelaer (Eds.), The role of social capital in development (pp. 85-124). Cambridge: Cambridge University Press. a Standard errors are in parentheses. *p ≤ 0.1. **p ≤ 0.05. ***p ≤ 0.001.
  • 17. Social Capital 15 Table 4 Ordinary least squares regressions on watershed performance (rescaled Common Land Development Index) Item Model 1 Model 2 Model 3 Model 4 Intercept -48.81* (25.64) -60.56** (21.92) -69.536** (21.71) -68.84** (21.48) Independent Variables Social capital index 0.728** (0.286) 0.762** (0.262) 0.748** (0.268) 0.781** (0.263) Divisive factors 0.026 (0.041) Tolerance for dishonesty -0.001 (0.068) Political competition .0513*** (0.128) 0.496** (0.124) 0.472*** (0.125) 0.470*** (0.124) Rain-fed land ratio 0.029 (0.164) Government staff support 0.216* (0.124) 0.210* (0.122) Infrastructure -1.43 (0.97) Literacy 0.549* (0.306) 0.566* (0.332) 0.539* (0.309) Population -0.001 (0.004) n 64 62 62 64 R² 0.320 0.406 0.370 0.368 Adjusted R² .0274 0.342 0.315 0.325 F-ratio 6.948 6.370 6.703 8.462 F-probability 0.0001 0.0001 0.0001 0.0001 Durbun-Watson statistic 1.66 1.792 1.576 1.572 Notes: This table comes from p. 113 in Krishna, A., & N. Uphoff (1999). Mapping and measuring social capital through assessment of collective action to conserve and develop watersheds in Rajasthan, India. In H. Christiaan, & T. van Bastelaer (Eds.), The role of social capital in development (pp. 85-124). Cambridge: Cambridge University Press. a Standard errors are in parentheses *p ≤ 0.1. **p ≤ 0.05. ***p ≤ 0.001.
  • 18. Social Capital 16 In all four of the regressions only two variables are consistently significant. The coefficient for the social capital index ranges from 0.60-0.72, and indicates that an increase of 1 percentage point in social capital is associated with on average an increase of 0.7 percentage points in collective action for development. With a range of 0.38-.042, the coefficient for the political competition index indicates that a change of 1 percentage point in political competition would be associated with a 0.4 percent point change in collective action. In five out of six of the regressions literacy was statistically significant at the 0.1 levels. These results provide evidence that increased social capital is associated with more effective collective action for development, and that more political competition is associated with greater levels of collective action (p. 114). Example 2. The effect of social capital on high school attrition rations. Researcher James Coleman (1988) conducted a study on the role of social capital in the creation of human capital. He wrote that social capital “comes about through changes in the relations among persons that facilitate action … it exists in the relations among persons” (p. 101). Coleman identified three forms of social capital: obligations and expectations, information channels, and social norms. He maintained that all social relations and social structures facilitate some of these forms of social capital. Closure of networks however, argued Coleman is especially important in facilitating social capital in the forms of obligations and expectations, and social norms. To demonstrate his hypothesis Coleman conducted a multi-step examination of the effect of social capital within the family and in the community outside the family on high school attrition rates. First, he examined social capital in the family. Coleman argued that the “social capital within the family that gives the child access to the adult’s human capital depends both on the physical
  • 19. Social Capital 17 presence of adults in the family and on the attention given by the adults to the child” (p. 111). To show the expected dropout rates for students in different types of families Coleman used a weighted logistic model with a random sample of 4,000 students from public schools. Various measures of social and human capital in the community were controlled for statistically.7 The following table depicts the dropout rates of high school students between spring grade 10, and spring grade 12 for students whose families differ in social capital indicators controlling for human capital and financial capital in the family: Table 5 Dropout rates between spring, grade 10, and spring, grade 12, for students whose families differ in social capital, controlling for human capital and financial capital in the family Percentage Dropping Out Difference in Percentage Points 1. Parents’ presence: Two parents 13.1 6.0 Single parent 19.1 2. Additional children: One sibling 10.8 6.4 Four siblings 17.2 3. Parents and children: Two parents, one sibling 10.1 12.5 One parent, four siblings 22.6 4. Mother’s expectation for child’s education: Expectation of college 11.6 8.6 No expectation of college 20.2 5. Three factors together: Two parents, one sibling, mother expects college 8.1 22.5 One parent, four siblings, no college expectation 30.6 Note. This data in this table is adapted from p. 112 in Coleman, J. (1988). Social capital in the creation of human capital. The American Journal of Sociology, 94, 95-120. Retrieved June 14, 2011, from JSTOR database (2780243). 7 The following variables were included in the model to measure the family’s financial, human, and social capital: socioeconomic status (a single variable constructed of parents’ education, parents’ income, father’s occupational status, and household possessions), race, Hispanic ethnicity, number of siblings, number of changes in school due to family residential moves since fifth grade, whether mother worked before the child was in school, mother’s expectation of child’s educational attainment, frequency of discussions with parents about personal matters, and presence of both parents in the household.
  • 20. Social Capital 18 Each indicator of adult attention in the family that was used in this regression was associated with lower high school student attrition rates between spring of the sophomore year and spring of the senior year. Coleman’s results indicate that social capital in the family is a resource for the education of the family’s children (p. 113). Coleman then analyzed social capital outside the family. He theorized that the examination of outcomes for children whose parents differ in intergenerational closure would disclose the effect of social capital outside the family on educational outcomes. As a proximate indicator of intergenerational closure, Coleman considered the number of times the child changed schools because the family moved (p. 113). According to the first logistic regression that he carried out and that was discussed above, the dropout rate if the family had not moved was 11.8%, the dropout rate was 16.7% if the family had moved once, and 23.1% if it had moved twice. An additional indicator used by Coleman to determine the effect of social capital outside the family on educational outcomes was that of variation among schools. He distinguished between public high schools, religiously based private high schools, and non-religiously based private high schools.8 Table 6 Dropout rates between spring, grade 10, and spring, grade 12, for students from schools with differing amounts of social capital in the surrounding community Public Catholic Other Private Schools 1. Raw dropout rates 14.4 3.4 11.9 2. Dropout rates standardized to average public school sophomore 14.4 5.2 11.6 Note. This data in this table is adapted from p. 115 of Coleman, J. (1988). Social capital in the creation of human capital. The American Journal of Sociology, 94, 95-120. Retrieved June 14, 2011, from JSTOR database (2780243). 8 Data was drawn from 893 public schools, 84 Catholic schools, and 27 other private schools.
  • 21. Social Capital 19 The most significant result of these comparisons was the low dropout rate in Catholic schools compared with public and other private schools. The differences, emphasized Coleman, were not due to religion. He pointed out that the dropout rate for public school students who attend Church was often 9.1%. Instead, he explained that religiously based high schools have very high levels of intergenerational closure. A community based on the religious organization surrounds these schools. Relations are multiplex as the adults are members of the same religious body and parents of the children in the same school (p. 114). In addition to the previous results, which indicate that social capital in the family is a resource for the education of the family’s children, these subsequent results provide evidence of the importance of social capital outside the school in the adult community surrounding it (p. 115). Example three. The impact of social capital on agricultural traders in Madagascar. Researchers Marcel Fafchamps and Bart Minten (1999) studied the impact of social capital on the success of the firm. Specifically, they attempted to illustrate the economic effect that social capital has on the functioning and performance of agricultural traders in Madagascar. Fafchamps and Minten argued that social capital influences economic exchange in two ways. They wrote that: Trust and emotional attachment to a group, society, or association may improve public sector efficiency or facilitate greater cooperation for services benefitting that group, society, or association9 …benefits can also accrue directly to an individual or a firm as a result of knowing people with whom it forms networks of interconnected agents (p. 125). 9 In essence, Fafchamps and Minten (1999) argued that social capital could help overcome obstacles in imperfect markets that often arise in developing countries. They argued that trust and emotional attachment can help to overcome the results of such poor market institution, which include a lack of formal credit, inadequate contract enforcement, and formal insurance deficiencies, high search costs for both suppliers and customers, and imperfect or asymmetric information on the market situation, on the credibility of suppliers and customers, and on products (pp. 125-126).
  • 22. Social Capital 20 To test the quantitative impact of social capital on traders in Madagascar, and to identify the channels through which it affects performance, Fafchamps and Minten used regression analysis. They employed the following production function: Q = f (L, K, H, S) Where: Q stands for output L stands for labor K stands for physical capital H stands for human capital S stands for social capital They maintained that in theory, if S has any effect on performance then including it in the production function would reduce the regression coefficients of the other variables (p. 140). Fafchamps and Minten then ran a second specification of the production function to identify the channels through which social capital might work: Q = f (L, K, H, S:C) Where: C stands for different channels In order to avoid simultaneous causation, instrumental variation was used10 . Additional measures were taken to avoid covariate and idiosyncratic shocks, omitted variable bias, and the concern that social capital could simply be a byproduct of economic success (p. 141). Determinants of the five measures of social capital - output, labor, physical capital, human capital, and social capital - used in this analysis included accumulation of social capital, returns to social capital, and social capital and modes of transaction. The regression results in the following table illustrate the process by which social capital, labor, and physical capital are accumulated (p. 143): 10 Instrumental variables on family background, business start-up experience, personal wealth and financial assets, and access to telecommunication equipment were selected based on a data set of exogenous variables (Fafchamps & Minten, 1999, p.141).
  • 23. Social Capital 21 Table 7 Determinants of social capital, labor, and physical capital Social Capital Labor Physical Capital Number of relatives in trade Number of people who can help Number of traders known Number of customers known personally Number of suppliers known personally Manpower (ln in man- months) Equipment (ln in local currency) Variable Years of schooling of owner/manager 0.0079 0.0075 0.0029 0.0116 0.0369 0.0387 0.1517 Age of owner/manager 0.0078 0.0135 0.0330 0.0279 0.0427 0.0226 0.0601 (Age of owner/ manager) ² -0.0001 -0.0002 -0.0004 -0.0003 -0.0004 -0.0001 -0.0003 Gender (1=male) -0.0198 -0.0012 -0.1315 -0.0522 -0.0844 -0.1618 -0.5267 Years of experience in agricultural trade 0.0409 0.0785 0.3286 0.2299 0.1884 0.1238 0.5767 Dummy if full- time trader 0.0080 0.0436 0.0017 -0.0023 0.0440 0.0469 -0.7342 Dummy if trader all-year- round -0.0984 -0.0445 0.1250 0.1355 -0.1797 0.1360 -0.2846 In capital city -0.3420 0.1575 0.3152 0.5625 -0.6174 -0.0986 -1.3378 In another city 0.1608 0.0241 -0.1695 -0.2780 -0.2753 -0.0575 -0.1803 In Vakinankaratra region -0.3816 -0.1924 0.3125 0.2212 -0.5748 -0.1196 -0.1443 In Fianarantsoa (Hauts Plateaux) -0.4611 -0.1881 0.0081 -0.2882 -1.1810 0.0143 -2.5406 In Fianarantsoa (Côte et Falaise) -0.4546 -0.0623 -0.0665 -0.3443 -1.1604 -0.1211 -3.0002 In Majunga (plaines) -0.6612 -0.2832 -0.0262 -0.7347 -1.6225 -0.6186 -4.0686 In Majunga (plateau) -0.6078 -0.2862 -0.2301 -0.6517 -1.6372 -0.5777 -5.0498 Intercept 0.6358 0.7666 0.6857 0.7378 0.9240 2.0824 3.7861 R² 0.088 0.094 0.192 0.265 0.317 0.349 0.495
  • 24. Social Capital 22 Notes: This table was adapted from the table on p.142 in Fafchamps, M., & B. Minten (1999). Social capital and the firm: Evidence from agricultural traders in Madagascar. In H. Christiaan, & T. van Bastelaer (Eds.), The role of social capital in development (pp. 125-154). Cambridge: Cambridge University Press. a n = 704 b T-statistics are available in table 4.11 P. 142 Social capital increased with the number of years in trade for all variables except relatives in trade. When regressed as dependent variables, labor and physical capital exhibited behavior similar to social capital in response to business experience. Fafchamps and Minten theorized that social capital might improve the access to credit that is needed to finance the long-term investment necessary to accumulate physical capital. Overall, the results suggest that traders accumulate social capital over time (p. 144). To illustrate the effect of business experience three sets of variables were used to explain traders’ performance: (a) human capital variables only; (b) labor and physical capital in addition to human capital variables; and (c) human capital, labor, physical capital, and social capital (p. 144). Relatives in agricultural trade were included in all of the specifications because Fafchamps and Minten believed that this form of social capital is not accumulated over time. Experience proved to be highly significant in the second specification that included social capital, human capital, and labor.11 A doubling of the years of experience in trade increased sales by 50 percent and value added by 60 percent. Sales dropped to 19 percent and value added to 25 percent in the specification that controlled for physical capital and labor (p. 144). The significance of the effect of experience in trade disappeared for sales and value added once social capital was controlled for. 11 Regression results for the second specification are included in table 4.12, which can be viewed on pp. 146 – 147 of Fafchamps, M., & B. Minten (1999). Social capital and the firm: Evidence from agricultural traders in Madagascar. In H. Christiaan, & T. van Bastelaer (Eds.), The role of social capital in development (pp. 125-154). Cambridge: Cambridge University Press.
  • 25. Social Capital 23 Based on these results, Fafchamps and Minten concluded that a large part of the effect of business experience on performance comes from the accumulation of social capital over time (p. 145). Finally, Fafchamps and Minten attempted to determine how different modes of reducing transaction costs affect the efficiency of traders. They presented two regressions. Ordinary least square estimates were used in the first regression, while the second regression corrected for possible simultaneity bias in working capital, labor, and modes of transaction. According to the coefficients of the first regression the use of customers and suppliers as the main source of price information was associated with a 60 percent increase in gross margin, while utilization of messengers lead to an increase of more than 100 percent. Not having to inspect the quality of supplies at each purchase was significantly associated with higher margins for the value added OLS specification. The coefficients regarding traders’ ability to sell on credit as a determinant of performance were highly significant in both specifications. However, when the specification was corrected for endogeneity the significance of the coefficients disappeared. Fafchamps and Minten concluded that (a) traders with better relationships with other traders, suppliers, and customers earn higher margins; (b) social capital has characteristics that parallel other types of inputs such as physical capital and labor; (c) social capital is accumulated over time and significantly improves economic performance; and (d) firms benefit from social capital mainly through a reduction in the high transaction costs typical in agricultural commodity markets. They suggested that scholars distinguish between three dimensions of social capital: relationships with individuals, relationships with other traders, and family relationships.
  • 26. Social Capital 24 The Creation of Social Capital Example one. Social capital in Rajasthan, India. To conclude their study of social capital and watershed management researchers Krishna and Uphoff (1999) attempted to identify factors that affect the formation of social capital. They constructed social capital index scores for individuals based on responses to survey questions. A comparison of the social capital index at the personal level with the social capital index at the village level allowed the authors to identify what other individual-level attributes correlate with variations in the social capital index. To account for differences in individual’s propensities for collective action Krishna and Uphoff inferred causation from these correlations (p. 115). Krishna and Uphoff tested various hypotheses that might affect individuals’ respective endowments of social capital. They assumed that individual endowments of social capital aggregate into village social capital. Standard demographic characteristics that were tested include age, gender, family size, and length of residence in the village. None were statistically significant. Wealth and status, as well as education were also statistically insignificant at the household level. Variables with statistically significant coefficients include several measures of participation, participation in decision-making, information, rulemaking and enforcement, and history. Krishna and Uphoff concluded that the statistical significance of these variables indicates that investment in such matters will help to build social capital, at least in rural Rajasthan (p. 116-119). Example two. The impact of development assistance on social capital in rural Kenya. Mary Kay Gugerty and Michael Kremer (2000) conducted research concerning the determinants of social capital. Specifically, they attempted to study the impact of development
  • 27. Social Capital 25 assistance on social capital in rural Kenya. They posed questions such as “Is social capital determined exclusively by long-run historical, cultural, and economic forces? Or can it be influenced in the short run by policy? If so, how?” (p. 213). Gugerty and Kremer pointed out that a problem that corrupts many studies of social capital is the difficulty of inferring causation from correlation in retrospective data. In order to overcome this problem and estimate causal impacts, they employed a randomized prospective evaluation of three projects undertaken by Internationaal Christelijk Steunfonds (ICS), a Dutch NGO. Project phase-in was random. This random order of the phase-in claimed Gugerty and Kremer, provided natural treatment and comparison groups (pp. 213-214). We will look closely at Gugerty and Kremer’s evaluation of the first project. In 1995 the Ministry of Education selected 100 underfunded schools and to determine which school would receive funding and when randomly divided them into four groups. Textbooks were provided to primary schools in the first group in 1996 and 1997. Schools belonging to the second group received a grant at the end of 1997. Groups three and four served as comparison groups for the first few years of the project. In 1998 group three schools received grants, while group four schools received grants in 2000 (p. 216). Gugerty and Kremer identified social capital and parental and community participation as key determinants of educational quality. They measured parental participation through attendance at Parent-Teacher Association (PTA) and school committee meetings and by parental contributions to school projects. Gugerty and Kremer tested the impacts of each form of assistance by regressing the dependent variable of interest on a binary indicator variable that takes the value of one if a school or group is participating in the program. Included in the regressions are controls for
  • 28. Social Capital 26 geographic divisions in which the schools or groups are located. Tables eight and nine display the regression results corresponding to PTA meetings and school committee meetings. Table 8 PTA meetings, 1997 Number of meetings All school committee members School committee officers Dependent variable Number of meetings in 1997 (1) Change in number of meetings 1995-7 (2) Attendance rate (3) Average number of meetings attended per member (4) Attendance rate (5) Average number of meetings attended per officer (6) Textbook schools -1.03** (0.43) -1.65** (0.70) 0.08 (0.07) -0.16 (0.24) 0.07* (0.04) -0.21 (0.44) Grant schools -0.66 (0.41) -1.37** (0.58) -0.01 (0.06) 0.34 (0.22) 0.03 (0.04) 0.54 (0.36) Observations 94 77 66 93 67 93 R2 0.18 0.15 0.21 0.14 0.13 0.10 Mean value of dependent variable in comparison schools 3.89 1.78 0.59 0.98 0.88 1.58 Note. This table is from p. 220 in Gugerty, M.K., & M Kremer (2000). The impact of development assistance on social capital: Evidence from Kenya. In H. Christiaan, & T. van Bastelaer (Eds.), The role of social capital in development (pp. 213-233). Cambridge: Cambridge University Press. a OLS regressions with robust standard errors in parentheses. All regressions include variables for the geographic regions in which schools are located. b *p ≤ 0.1. **p ≤ 0.05. ***p ≤ 0.001.
  • 29. Social Capital 27 Table 9 School committee meetings, 1997 Number of meetings All school committee members School committee officers Dependent variable Number of meetings (1) Change in number of meetings 1995-7 (2) Attendance rate (3) Average number of meetings attended per member (4) Attendance rate (5) Average number of meetings attended per officer (6) Textbook schools -0.70 (0.55) -0.89 (0.82) 0.04 (0.03) -0.23 (0.34) 0.03 (0.03) -0.36 (0.51) Grant schools -0.41 (0.56) -0.83 (0.76) 0.02 (0.03) 0.07 (0.35) 0.01 (0.03) 0.06 (0.48) Observations 91 73 87 92 96 92 R2 0.18 0.17 0.12 0.14 0.11 0.17 Mean value of dependent variable in comparison schools 4.19 0.98 0.56 2.01 0.91 3.18 Note. The table is from p. 221 in Gugerty, M.K., & M Kremer (2000). The impact of development assistance on social capital: Evidence from Kenya. In H. Christiaan, & T. van Bastelaer (Eds.), The role of social capital in development (pp. 213-233). Cambridge: Cambridge University Press. a OLS regressions with robust standard errors in parentheses. All regressions include variables for the geographic regions in which schools are located. b *p ≤ 0.1. **p ≤ 0.05. ***p ≤ 0.001. The regression results indicate that neither textbook nor grant schools saw significant changes in the average number of meetings attended per committee member, attendance rates at meetings, or in the number of school committees meetings held. Teachers’ participation in school did increase in both programs. However, because the program impact on teacher effort seemed to be direct, rather than mediated through the influence of parents, the authors concluded that increased social capital in the form of parental participation was not the channel through which the programs improved teacher effort (p. 222-223). The authors found no evidence of measurable increases in social capital outcomes. Through this study and the two subsequent projects that
  • 30. Social Capital 28 Gugerty and Kremer analyzed, the authors concluded that the effects of investment on social capital are often minimal (p. 232). Example three. Social capital and federations of the rural poor in the Andes. Anthony Bebbington and Thomas Carroll (2000) attempted to identify which federated forms of organizations are able to bridge different interests of the rural poor in the Andes. These researchers pointed out that while poor people’s organizations in the Andes embody essential forms of structural capital that can play a pivotal role in poverty reduction, such organizations widely vary in scale, role, effectiveness, and degree of inclusiveness and exclusiveness. Bebbington and Carroll argued that the supra-communal, or second-order federation12 is particularly important because such organizations link community-based groups around shared economic, political, and cultural interests, they are relatively close to the grassroots and so better able to be participatory and accountable, yet are still able to play a critical role in states, markets, and distant national social movements. Bebbington and Carroll asserted that in order to be effective this type of federation must be comprised of particular types of social relationships – a form of structural social capital that they argued can be constructed through external intervention (p. 234-235). Through several case studies, Bebbington and Carroll were able to compose a list of what they determined to be dimensions of social capital within a second-order organization in the Andes: 12 Michael Woolcock defined second-order organizations as “social systems that have the capability to combine strong intra-group ties with weak extra-group networks in a way that can develop positive synergies between the two types of ties” (as cited in Bebbington & Carroll, 2000, p. 236). Bebbington and Carroll identified the capacity of the federation to behave as such a second-order organization.
  • 31. Social Capital 29 • Local and kin-based networks – Strong bonds of mutual help based on kinship, symbolic patronage, and spatial propinquity that facilitate collective action and problem-solving, as well as ritual and other social activities. • Intercommunity linkages – Project groups within a second-order organization where members from various and more heterogeneous communities participate • Linkages to higher-level indigenous organizations – The building of relationships through which higher organizations can effectively represent, respond to, and be accountable to the second-order organization. • Municipal and regional linkages – Territorially based sets of relations with state, civil society, and market actors that build synergies for the local co-production of development. • Inter-institutional linkages with support agencies – More dependent relationships with donors and other external agencies that channel support to second-order organizations in order to gain access to resources and/or to markets and decision-making fora (p. 242-243). Bebbington and Carroll asserted that to act strategically on notions of organizational capacity specific measures of the different dimensions of social capital and organizational capacity in federations must be developed. They analyzed six case studies in order to determine: “(a) the capacities of second-order organizations in terms of different dimensions of social capital and the other assets available to the organizations; and (b) the relationship between capacity and forms of external support to the second-order organization” (p. 249). Bebbington and Carroll also conducted two larger surveys in collaboration with some other organizations. Comparators within the same locality were not identified. Thus, while organizations were compared in ex post analysis, the researchers were not able to control for all other conditions including regional agro-ecological and political economic effects.
  • 32. Social Capital 30 Bebbington and Carroll developed score-able indicators of the different forms of social relations that constitute organizational capacity. Interestingly, these researchers mentioned the framework developed by the IAF to measure the organizational development of its grantees as a precursor to their method. Bebbington and Carroll pointed out that the variables identified by the IAF could be used to measure the process of social capital accumulation itself, or the embodiment/outcome of the accumulation of social capital by the membership of a group (p. 253). Through inductive and deductive reasoning, Bebbington and Carroll decided to use three instruments. The first instrument was meant to assess the quality of the federation’s social relationships and certain assets. The second instrument assessed the quality of the federation’s community relationships and community perceptions of the federation’s effectiveness. A data sheet for basic quantitative information that was obtained from federation organization records and other documents comprised the third instrument. These instruments aggregated 124 indicators, which Bebbington and Carroll grouped into forty-four variables – half objective and half subjective. The variables were organized according to seven dimensions of capacity: leadership, participation, organizational culture, resource mobilization and use, sustainability, intermediation and negotiation, and linkages/alliances. The results are displayed in the table 10.
  • 33. Social Capital 31 Table 10 Organizational capacity indicators for fifteen federations in Ecuador Variable High Mean Low Range of difference Participation 63 47 40 23 Management 56 52 27 29 Satisfaction of members 73 60 40 33 Sustainability 55 45 30 25 Benefit distribution 44 17 7 37 Self-initiative 69 33 10 59 Overall capacity 60 39 26 34 Note. This table is from p. 255 in Bebbington, A., & T. Carroll (2000). Induced social capital and federations of the rural poor in the Andes. In H. Christiaan, & T. van Bastelaer (Eds.), The role of social capital in development (pp. 234-278). Cambridge: Cambridge University Press. Through qualitative analysis, Bebbington and Carroll linked the variation in the capacities of second-order organizations in the Andes to the quality of the internal and external social relationships of the organization. They argued that the greatest strength of the second-order organizations and the context in which these federations operate is the quality of such relationships. This suggests, maintained Bebbington and Carroll that these federations are sources of important forms of social capital that can be built upon (p. 254). Upon administering two surveys in Ecuador, and conducting in-depth qualitative studies of twelve federations, each with different origins, Bebbington and Carroll concluded that the key to inducing and reinforcing social capital for second-order institutions is the strengthening of the internal capacity of these federations in combination with the forming of effective links with external actors (p. 272-277). Example four. The integrated questionnaire for the measurement of social capital. A framework that can be used in generating quantitative data on various dimensions of social capital is called the Integrated Questionnaire for the Measurement of Social Capital (SC-
  • 34. Social Capital 32 IQ). The designers of this questionnaire, Grootaert et al. (2004), stressed that the SC-IQ was designed for incorporation into larger household surveys such as the Living Standards Measurement Survey (LSMS). This mergence, maintained the authors, would enable researchers to assess the impact of a project on social capital and/or to assess whether areas with high levels of social capital have more successful project implementation (p. 2). The questionnaire is based on the six dimensions of social capital that were defined in part two of this paper - groups and networks, trust and solidarity, collective action and cooperation, information and communication, social cohesion and inclusion, and empowerment and political action (p. 5). The SC-IQ was specifically designed to measure household and individual level social capital.13 The authors maintained that the micro-level data collected for the SC-IQ corresponds with the focus of the LSMS, and that this correspondence makes it possible to integrate the SC-IQ into the LSMS (p. 5). In order to direct questions to individuals household surveys were employed (p. 6). Grootaert et al suggested that researchers employ a two-step analysis to interpret data collected by the SC-IQ. In order to begin to organize and extract meaning from the data it was suggested that researchers first use tabular analysis centered on three basic sets of indicators of social capital: (a) memberships in associations and networks (structural), (b) trust and adherence to norms (cognitive), and (c) collective action (an output measure) (p. 9). As there is a low limit to the number of variables that can be considered at one time using tabular analysis, it was recommended that researchers complement tabular analysis with econometric analysis. Grooetart et al deemed the estimation of multivariate models of household welfare as especially important as such analysis can be used to identify the contribution of social 13 An instrument designed for the broader measurement of social capital at the level of households, communities, and organizations is the Social Capital Assessment Tool (SOCAT).
  • 35. Social Capital 33 capital to various aspects of household welfare (p. 9). Based on the assumption that social capital is capital and therefore has a measurable return to the household, Grootaert et al developed the following generic estimation equation (p. 15): lnEі = a + bSCi + cHCi + dOCi + eXi + fZi + ui Where: Ei = household expenditure per capital of household i SCi = household endowment of social capital HCi = household endowment of human capital OCi = household endowment of other assets Xi = a vector of household characteristics Zi = a vector of community / region characteristics ui = error term This equation allows researchers to test empirically the effect on levels of well being from the networks and organizations and their underlying norms and values to which people belong. Conversely, the impact of specific aspects of well being can be estimated by using other outcome variables as the dependent variable in this equation (p. 15). Grootaert et al maintained that the total number of relevant variables that may determine the creation of social capital is vast. They argued that a quantitative model based on any number of determinants is likely to capture only a small subset of relevant variables. As such, they recommended that qualitative in-depth studies precede any quantitative multivariate methods. Subsequent quantitative analyses can then be used to test empirically specific aspects of the creation process that were discovered through the qualitative studies (p. 17). Grootaert et al stressed that questions representing each of the six dynamics of social capital should present when gathering data. They maintained that eliminating any of the dynamics would “undercut the conceptual framework that underlies the SC-IQ and thus reduce the analytic potential of the data collected” (p. 7).
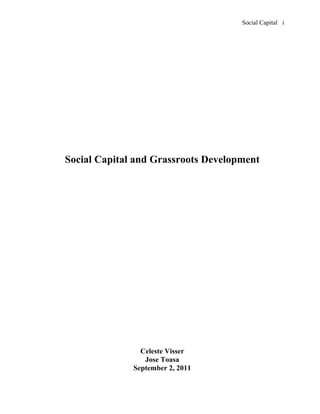
  • 36. Social Capital 34 Part IV: The Grassroots Development Framework In 1994 the IAF employed lessons learned from supporting over 3,800 projects to develop the Grassroots Development Framework (GDF). The Framework merges a diverse range of quantitative and qualitative indicators of grassroots development into one conceptual tool that both donors and grantees can use to measure impact. It attempts to illustrate the multilevel tangible and intangible results that the IAF believes are achieved through grassroots development as well as how these results are linked to sustainability (Vance, 1993, p. 42, 1996, p. 4). The framework of the GDF is conceptualized through a cone. Underlying the framework of the GDF are two intellectual notions. The first is that tangible and intangible effects are equally important for long-term development success. To reflect this belief the cone is divided into two sections: tangible gains and intangible gains. The second notion is that grassroots development must attend to three levels: 1) Improving immediate conditions for direct beneficiaries, most often participants and their families 2) Strengthening community organizations and local support networks 3) Influencing public policies, practices, and attitudes to confront the causes of poverty (Vance, 1993, p. 42). The two sections and three levels of the cone are depicted in figure 1. The widening of the cone is intended to represent the impact of grassroots development as it manifests from the direct beneficiary through the organization and to the community or society at large.
  • 37. Social Capital 35 Figure 1 Tangible Intangible Broader Impact Strengthening Communities Direct Beneficiaries There are six windows in the cone. Specific variables that are associated with each of these windows are depicted in figure 2. Balance among these variables is considered by the Foundation to be the key to successful grassroots development (Vance, 1996, p. 4). Figure 2 Tangible Intangible Policy Environment Community Norms Laws Values Policies Attitudes Practices Relations Organization Capacity Organizational Culture Planning Vision Administration Democratic Practice Resources Autonomy Reach/Linkages Solidarity Standard of Living Personal Capacity Basic Needs Self-esteem Knowledge/Skills Cultural Identity Employment/Income Creativity Assets Critical Reflection
  • 38. Social Capital 36 The GDF is introduced to each grantee during an orientation visit prior to the first disbursement of IAF funding. At the meeting IAF staff work with the grantees to identify the indicators that will be used to biannually gauge the progress of the grantee organization. Subsequently, in-country data verifiers that are accountable to the Foundation visit the grantee every six months, confirm the grantee’s representations of progress through on-site interviews and observations, and submit reports to the IAF. To this day, the Foundation continues to refine the GDF. For example, data is now collected with a gender breakdown, indicators on work with disabled beneficiaries and the impact of IAF funding on infrastructure (including environment protection) have been added to the Framework. In addition, the GDF has been updated for easier entry of information. Currently, the GDF is available in Spanish, Portuguese, French, Creole and English (Vance, 2009, p. 29). Marion Ritchey Vance of the IAF (1996) highlighted the additional information that was gleaned by using the GDF to assess the effectiveness a Mexican grantee named Program for Integrated Use of Natural Resources (PAIR). According to Vance, the new set of questions that were posed through use of the GDF provided the IAF with previously unavailable details such as that PAIR had collaborated with half a dozen major NGOs in the area, worked closely with local and regional producer organizations, PAIR coverage expanded from the two pilot municipalities to 10 additional municipalities, involving local government, NGOs and peasant organizations, and finally, that several of the founders of PAIR were appointed to national posts where they could promote on a national scale the approaches to natural resource use and conservation that PAIR believed in (p. 8).
  • 39. Social Capital 37 Part V: Integrating the GDF and Measurements of Social Capital There are many reasons to believe that various measures of social capital can indeed be assessed through use of the GDF: • The division of the GDF into tangible and intangible aspects is a useful proxy for measuring the structural and cognitive community conditions that beget social capital. • The three-tiered structure of the GDF can help the IAF to determine where bonding, bridging, and linking networks exist. • Researchers Bebbington and Carroll confirmed the view that the GDF could and even should be used to measure various dimensions of social capital through their assertion that the organizational variables constructed by the IAF “represent patterns of organized collective action and interaction”, and “can be used to measure the process itself or the outcome of the process14 (p. 253). The intellectual underpinnings of the SC-IQ provide a good base for assessment of social capital at the IAF. In order to harness the analytic potential of the SC-IQ, Grootaert et al stressed the importance of collecting data that represents each of the six dimensions of social capital that he identified. Figure 3 shows how such data collection is indeed possible through use of the GDF: 14 Bebbington and Carroll (2000) considered collective action to be the institutional source of social capital accumulation and embodiment of accumulated social capital (p. 253).
  • 40. Social Capital 38 Figure 3 Tangible Intangible Policy Environment Community Norms Social Cohesion and Inclusion Collective Action and Cooperation Organizational Organizational Capacity Culture Empowerment Groups and Networks and Political Action Standard of Personal Living Capacity Information and Communication Trust and Solidarity Focusing on the most recent six-month data collection period,15 I randomly selected and reviewed the GDF data that was reported on by 20 current grantees. Specifically, I looked at how many variables from the GDF were reported on from each of the three levels of the GDF – society, organization, individual – plus another category labeled other. Table 11 summarizes the results: 15 While the precise start and end dates for the six-month period reported on marginally differs for each grantee, the period of focus begins in 2010 and ends in 2011 for every single report outlined here.
  • 41. Social Capital 39 Table 11 Indicators for which GDF Data of 20 Randomly Selected Grantees was Collected During the Most Recent Six Month Period Society Organization Individual Other Total ME 502 0 3 1 1 5 ME 498 0 4 0 1 5 ME 507 0 2 2 3 7 EC 398 1 2 3 0 6 EC 404 0 2 4 0 6 EC 412 0 3 3 0 6 AR 349 0 2 2 0 4 AR 352 0 2 2 0 4 PN 287 0 2 3 1 6 PN 293 0 2 3 3 8 PN 299 0 2 5 1 8 VZ 202 0 4 4 1 9 VZ 203 0 4 5 0 9 CO 518 0 1 1 1 3 CO 524 0 2 1 0 3 DR 336 0 2 4 0 6 DR 338 0 2 2 2 6 DR 341 0 0 5 0 5 PU 556 1 3 2 2 11 PU 562 0 3 5 1 9 Average 0.1 2.35 2.85 0.85 6.3 Median 0 2 3 1 6 Based on this review of 20 randomly selected projects, the median number of indicators selected to report on was six. Variables chosen at the societal level are lowest with a median number of 0 and a slightly higher average of 0.1, while individual level variables, with an average of 2.85, were reported on most often. On average organizational indicators are reported on 2.35 times, and other indicators 0.85 times. According to these results, the information that is currently collected at the IAF through the GDF does not adequately represent the six dimensions of social capital that Grooetaert et al maintained must be considered in order to analyze social capital. When the indicators on which to report grantee progress are selected care must be taken to ensure that an
  • 42. Social Capital 40 adequate number of indicators that represent each of the six dimensions of social capital are selected if various levels of social capital are to be measured. In order to decide which of a vast number of variables to use to assess social capital, Grootaert et al recommended preceding quantitative analysis with qualitative analysis. The IAF already has in place a strong system for the qualitative assessment of grantees before, during, and after funding periods. The in-depth information gleaned from such qualitative analysis can be employed to help IAF staff and grantee organizations successfully select indicators that can be used to assess social capital. The work that was conducted by Bebbington and Carroll (2000) in the Andes provides evidence of the plausibility of such a strategy. Through in-depth qualitative analysis and comparisons of organizations in the Andes of Bolivia, Ecuador, and Peru, Bebbington and Carroll were able to develop indicators that helped to identify the different dimensions of social capital existent in those organizations, the impacts of that social capital on development, and how such social capital might be created through external intervention. Judy Baker (2000) of the World Bank confirmed the notion that some level of evaluation can occur even when statistical controls are not present. According to Baker, a baseline survey that is conducted prior to the intervention acts as the comparison group. Impact is then measured through follow up surveys that record changes in outcome indicators before and after the interventions (p. 28). This method of evaluation is not new to the IAF. The significance of outlining it here is to show how the IAF can legitimately employ methodologies that it already uses to assess levels of social capital. A concern voiced by staff at the IAF is that the funding structure of the IAF, through which funding and data collection targets single grassroots organizations and communities, does not
  • 43. Social Capital 41 allow for data collection on control groups. This seriously impedes the ability of the IAF to assess causation during its evaluation process. For example, during an IAF funding period the participants of a grantee organization may experience increased welfare in the form of say greater access to education and health services. However, there are many factors that could have caused this increase in welfare. Without the assessment of similar groups that control for other possible inducements of welfare, it is impossible to say with statistical certainty that the grant distributed by the IAF is what caused the increase in welfare enjoyed by participants of the grantee organization. The implication of this is that while the IAF may be able to assess levels of social capital and welfare, the successful assessment of the creation of social capital, how social capital affects welfare, and more specifically changes in social capital that occur as a result of IAF grants, is questionable. A manageable, short-run focus of the IAF should be successfully identifying variables that will serve as proxies for various dimensions of social capital, and collecting the necessary data to conduct reflexive comparisons aimed at answering pre-identified questions concerning levels of social capital and welfare.
  • 44. Social Capital 42 References Baker, J. L. (2000). Evaluating the impact of development projects on poverty: A handbook for practitioners. Washington: The International Bank for Reconstruction and Development / The World Bank. Bebbington, A., & T. Carroll (2000). Induced social capital and federations of the rural poor in the Andes. In H. Christiaan, & T. van Bastelaer (Eds.), The role of social capital in development (pp. 234-278). Cambridge: Cambridge University Press. Breslin, P. (2004). Thinking outside Newton’s box: Metaphors for grassroots development. Grassroots Development, 25(1), 1-9. Coleman, J. (1988). Social capital in the creation of human capital. The American Journal of Sociology, 94, 95-120. Retrieved June 14, 2011, from JSTOR database (2780243). Fafchamps, M., & B. Minten (1999). Social capital and the firm: Evidence from agricultural traders in Madagascar. In H. Christiaan, & T. van Bastelaer (Eds.), The role of social capital in development (pp. 125-154). Cambridge: Cambridge University Press. Grootaert, C., D. Narayan, V. N. Jones, M. Woolcock (2004). Measuring social capital: An integrated questionnaire. Washington: The International Bank for Reconstruction and Development / The World Bank. Gugerty, M.K., & M Kremer (2000). The impact of development assistance on social capital: Evidence from Kenya. In H. Christiaan, & T. van Bastelaer (Eds.), The role of social capital in development (pp. 213-233). Cambridge: Cambridge University Press. Inter-American Foundation. (1977). They know how… an experiment in development assistance. Washington: Library of Congress Catalog.
  • 45. Social Capital 43 Krishna, A., & E. Shrader (2000). Cross cultural measures of social capital: A tool and results from India and Panama. Washington: The World Bank. Krishna, A., & N. Uphoff (1999). Mapping and measuring social capital through assessment of collective action to conserve and develop watersheds in Rajasthan, India. In H. Christiaan, & T. van Bastelaer (Eds.), The role of social capital in development (pp. 85-124). Cambridge: Cambridge University Press. Portes, A. (1998). Social capital: Its origins and applications in modern sociology. Annual Review of Sociology, 24, 1-24. Retrieved July 21, 2011, from JSTOR database (223472). Ritchey-Vance, M. (1996). Social capital, sustainability, and working democracy: New yardsticks for grassroots development. Grassroots Development, 20(1), 3-9. Ritchey-Vance, M. (2003). Grassroots development results – widening the lens. Grassroots Development, 17(1), 42-43. Vance, R. M. (2009). Measures to match the mission: How the Grassroots Development Framework came to be. Grassroots Development, 30(1), 20-29. Woolcock, M., & D. Narayan (2000). Social capital: Implications for development theory, research, and policy. The World Bank Research Observer, 15(2), 225-49.