2. 470 J.A. Crowe / Social Networks 29 (2007) 469–488
environmental awareness, and a deteriorating resource base. This decline in traditional rural sectors
often poses a threat to the survival of rural communities as homes and places of work as people
lose their jobs in these traditionally high paying sectors and are forced to live and work elsewhere
(Brown, 1995; Sharp et al., 2002). In response, many communities see a need for change in
their economic base and have initiated economic development strategies to try to recruit, create,
keep, and boost local economic endeavors. Recently, social scientists have taken an interest in
researching which characteristics of a local community facilitate effective economic development
(e.g. Crowe, 2006; Flora et al., 1997; Putnam, 1993; Shaffer and Summers, 1989; Sharp et al.,
2002). In particular the concept of social capital, “the connection among individuals—social
networks and the norms of reciprocity and trustworthiness that arise from them” (Putnam, 2000, p.
19), has received much attention as a causal mechanism that can facilitate economic development
(e.g. Crowe, 2006; Flora et al., 2004; Sharp et al., 2002). The recent popularity of bonding and
bridging social capital has further stimulated an interest in the potential for network structures to
facilitate effective community-level economic development. An argument exists in the literature as
to whether tightly knit, cohesive networks (e.g., Putnam, 1993) or loose, expansive networks (e.g.,
Woolcock and Narayan, 2000) are more conducive for implementing local economic development.
Drawing on economic development research (Flora et al., 2004; Sharp and Flora, 1999; Sharp et
al., 2002; Summers, 1986) community network analysis (Burt, 1992, 2002; Scott, 2004), and social
capital literature (e.g. Portes, 1998; Putnam, 1993), I propose that instead of being in direct conflict
with one another, different types of network structures are better suited for different economic
development strategies. To evaluate this proposition, I analyze associational membership data and
recent economic development activities provided by key informants in six rural communities in
Washington State. I conclude by exploring implications the findings have for studying community-level
economic development.
2. Economic development strategies
As rural communities have tried to increase their economic base, researchers and practitioners
have questioned what types of development are most successful and which factors lead to devel-opment
success. Several researchers of economic development have distinguished between two
economic development strategies: industrial recruitment and self-development (Eisinger, 1999;
Flora et al., 1992; Sharp and Flora, 1999; Sharp et al., 2002). These two forms of economic devel-opment
are often pitted against one another as opposing approaches to development. Despite
this contrast, communities can successfully implement both forms of economic development (see
Crowe, 2006 for an example).
Industrial recruitment involves efforts to attract outside firms and industries to locate to the area
(Sharp et al., 2002). These efforts include the provision of tax abatements, low-interest loans, and
easy access to cheap land for infrastructure development. The attractiveness of industrial recruit-ment
stems from its ability to generate a large number of jobs in a relatively short time period.
Crowe (2006) finds that active civic organizations, community-wide fund-raising capacity, and
the availability and control over natural surroundings have a significant positive effect on indus-trial
recruitment. Sharp et al. (2002) find that the existence of active community organizations,
businesses that support local community projects, community-wide fund-raising capacity, and
extra-local linkages to peer communities and state government have a modest effect on industrial
recruitment.
Criticisms of industrial recruitment, such as the payment of low wages, short-term success,
high recruitment costs (Loveridge, 1996), degradation of the local environment (Pellow, 2002),
3. J.A. Crowe / Social Networks 29 (2007) 469–488 471
and possible increases in population growth, housing prices and rents (Logan and Molotch, 1987;
Molotch, 1976, 1993), have led some communities to promote a second type of economic devel-opment:
self-development. In contrast to industrial recruitment, self-development activities foster
local businesses and other entrepreneurial activities along with relying on local resources to aid
in development from within the community (Flora et al., 1992). Examples of self-development
activities include revitalizing downtown businesses, promoting local tourism, and retaining or
expanding locally owned businesses. Previous research shows that some community attributes fos-ter
self-development. Sharp et al. (2002) find that a social infrastructure rich in active community
organizations, supportive businesses of local community projects, community-wide fund-raising
capacity, and extra-local linkages to peer communities and state government is more likely to cul-tivate
self-development than industrial recruitment. While self-development has some advantages
over industrial recruitment, such as new jobs requiring higher skills and stronger job security, a
higher number of jobs tend to be created from successful industrial recruitment endeavors than
from self-development (Green et al., 1993; Sharp and Flora, 1999; Sharp et al., 2002).
Both forms of economic development have their advantages and disadvantages. Therefore, it
is up to each individual community to weigh its advantages and potential shortcomings when
deciding on an economic development strategy. While previous research has examined the effects
of a community’s social infrastructure (Crowe, 2006; Sharp et al., 2002) and environmental
surroundings (Crowe, 2006) on the two types of economic development, to date little to no research
has looked at the effect of a community’s organizational network structure on the different forms
of economic development.
Bridging (loosely connected, weak ties) and bonding (dense, strong ties) social capital are
terms often used to describe a community’s network structure. While the differentiation between
bridging and bonding social capital (Putnam, 2000) is a step in the right direction, the terms are still
broadly defined. Below, I give a brief synopsis of the two forms of social capital and definitional
problems with each. I then further divide bonding and bridging social capital into four network
configurations (complete, factional, coalitional, and bridging) ranging on a scale from densely
connected to loosely connected and theorize how each network configuration impacts the two
forms of economic development.
3. Bridging and bonding social capital
Recent discussions of social capital often distinguish between “bonding” and “bridging” social
capital (Putnam, 2000; Woolcock and Narayan, 2000). Bonding social capital is typically char-acterized
as having dense relationships and networks within communities (Taylor, 2004). This
is often typified by the existence of tightly woven networks in which members are directly tied
to many other members in the network. Bridging social capital is often described as the weaker
relationships and networks across social groups and communities. It consists of the weak ties
described by Granovetter (1986). Woolcock and Narayan (2000) argue that while the dense net-works
of bonding social capital can effectively defend against poverty, real economic development
requires a shift to other, looser forms of network structures. In order to shift from “getting by” to
“getting ahead,” a shift from bonding to bridging network structure must occur (Putnam, 2000).
The concept of “bridging” social capital has been used in at least three ways in discussions of
social capital. These three uses are not necessarily complimentary. Portes (1998) conceptualizes
bridging social capital as networks that cross demographic divides of class, age, ethnicity, etc.
Burt (2002) conceptualizes bridging social capital much differently by referring to bridges across
4. 472 J.A. Crowe / Social Networks 29 (2007) 469–488
structural holes,1 or gaps between networks, which are not necessarily of dissimilar people.
Bridging social capital has also been used by researchers to refer to the capacity to access resources
such as information, knowledge, and finances from sources that lie outside of the organization or
community (e.g., Woolcock and Narayan, 2000).
While bridging and bonding capital are often depicted as two distinct forms of connections,
Leonard and Onyx (2003) argue that the two are not necessarily mutually exclusive. They suggest
that bridging and bonding capital differ in degree, but they do not offer a conceptual model of
how one can empirically measure the different types of bridging and bonding capital. Network
analysis, by examining the structure of networks, can allowfor one to distinguish between different
degrees of bridging and bonding capital. By performing network analysis, I differentiate between
the second and third uses of bridging social capital. However, because network analysis does not
allow for a meaningful way to study various attributes of network nodes, I do not distinguish
between the first use of bridging social capital and the second and third uses. Like bridging social
capital, network analysis also allows for the unpacking of bonding social capital. In what follows,
I distinguish between two types of bonding social capital and two types of bridging social capital
and theorize how each relates to different strategies of economic development.
4. Interorganizational network structures and economic development
Bonding social capital acts as the social glue that binds groups together. The network structure
under bonding social capital is quite dense. Two typologies of network structures exist that may be
considered forms of bonding social capital. At the far extreme end of the dense/loose scale lies the
complete network structure. In the complete structure, each organization is directly connected to
all other organizations in the community (see Fig. 1 for schematic approximations). Density is at
its upper limit. Such completion is very rare even in small communities. The second typology that
falls under bonding social capital is a factional structure. A factional network structure consists
of two or more connected groups that are not connected to one another.
Bridging social capital can also be divided into two network structure typologies: coalitional
and bridging. In a coalitional structure, dense networks of organizations are connected to each
other in a non-redundant fashion. Coalitional structures resemble Burt’s use of bridging social
capital to describe networks with structural holes. Coalitional structures lie in the middle of the
dense/loose continuum. Bridging network structures consist of weak network connections that
link organizations together in a loose manner. Bridging structures are representative of the third
use of bridging social capital by allowing organizations to access sources of information and other
resources that lie outside of an organization. This network structure falls at the opposite extreme
end of the dense/loose continuum.
In his work on regional differences in social capital in Italy, Putnam (1993) asserts that dense
organizational network structures (what I have termed complete) are conducive for economic
development. Putnam (1993, p. 173) writes: “Networks of civic engagement, like the neighbor-hood
associations, choral societies, cooperatives, sports clubs, mass-based parties, and the like
. . . represent intense horizontal interaction. Networks of civic engagement are an essential form
of social capital: the denser such networks in a community, the more likely that its citizens will
1 Burt uses the term structural hole to refer to the connection of non-redundant contacts. Non-redundant contacts are
either not directly connected or have contacts that are different from one another. A network that has numerous structural
holes has links between many non-redundant contacts and therefore is diverse in nature.
5. J.A. Crowe / Social Networks 29 (2007) 469–488 473
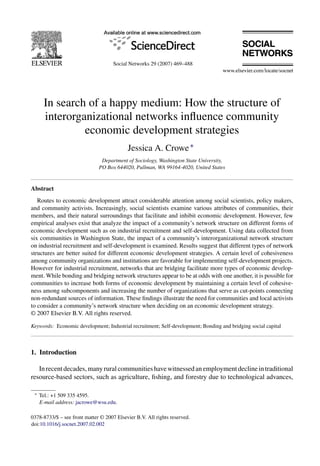
Fig. 1. Network structure typology.
6. 474 J.A. Crowe / Social Networks 29 (2007) 469–488
be able to cooperate for mutual benefit”. It is the tightly cohesive nature of these social networks
that facilitates cooperation among individuals for collective benefit.
In opposition to Putnam’s early research, Portes and Landolt (1996) show that dense network
structures can have a downside. Specifically, they note that strong, tightly knit, long-standing
civic groups may hinder economic growth by inhibiting economic development on an individual
level. In other words, demanding personal obligations placed on members of a social group may
prevent the group from participating in broader extensive social networks that connect individuals
to members outside their cohesive group. This critique can be extended to the community-level.
As effort and resources are increasingly spent on various community organizations and their
projects, less effort and resources are spent on possible external sources of development.
While critics have questioned the effectiveness of dense networks (what Putnam later referred
to as bonding social capital) in building economic development, a certain level of cohesiveness2
may be desirable for certain economic development strategies such as self-development. Cohesive
ties found in complete and near complete network structures may be effective in lowering the risk
of cooperation and thereby making trust and norms possible. Because self-development projects
come from within the community and rely on local resources, high levels of trust and norms lower
the risk of cooperation that is needed to successfully implement the projects. Thus, I hypothesize
that complete network structures will aid in the pursuit of self-development activities. However,
because trust and norms are exceptionally strong in a complete network structure, obligation to
the community may be so overwhelming that it severely reduces the time and effort spent on
external sources of development, thus hindering industrial recruitment efforts.
On the other hand, factional structures are unlikely to aid in the pursuit of economic devel-opment
activities of either type. A structure containing dense unlinked factions probably cannot
discover a common economic interest and work for it effectively. Information and other resources
are not shared among different factions, therefore making industrial recruitment harder to effec-tively
accomplish. Yet, trust and norms are likely to be low making self-development projects
more difficult to implement.
Coalitional network structures have traits of both complete structures and bridging structures.
Dense networks of organizations are connected to each other in a non-redundant way. This type
of network structure may facilitate both self-development and industrial recruitment projects.
Because density occurs on a smaller level, but each dense network is connected to other dense
networks, a level of trust and norms can develop. This sense of obligation (albeit lower than
in complete networks) and level of trust facilitate self-development projects that rely on local
resources. While obligation to the community is apparent in a coalitional network structure, it is not
so overwhelming that it reduces the time and effort spent on external sources of development. The
downside of social capital that Portes and Landolt (1996) refer to is not experienced. Therefore, I
hypothesize that because coalitional structures facilitate trust and norms but not in an overpowering
fashion, information and resources that are shared among groups will result in high amounts of
both self-development and industrial recruitment efforts.
Since a bridging network structure is relatively loose compared to a complete network struc-ture,
it may facilitate economic development that relies on external resources. By being loosely
connected, organizations can spread information and resources to one another, yet not feel obliged
2 There are four general ways to conceptualize a cohesive network (see Wasserman and Faust, 1994 for a description
of these properties). In this study, cohesive ties refer to the frequency of ties among network members. That is, cohesive
networks consist of members with direct ties to many other members in the network. Here, I measure cohesiveness by
analyzing k-cores. This is discussed in detail in Section 7.
7. J.A. Crowe / Social Networks 29 (2007) 469–488 475
to contribute resources to every project that is hosted by a community organization. This can be
particularly useful when attempting to recruit outside industries to the community.However, loose
interorganizational network ties may result in lower levels of trust and norms, thereby making
it somewhat difficult to come to a consensus on which industry to pursue. Lower levels of trust
and norms will also make it very difficult for pursuing self-development strategies. Therefore, I
hypothesize that bridging network structures will result in low amounts of self-development and
higher amounts of industrial recruitment, but to a lesser extent than coalitional network structures.
5. Summary of prior research and hypotheses tested in the present study
While much research has been conducted on the effects of social capital toward community-level
economic development, less research has been conducted that evaluates the role that a
community’s network structure plays with regards to various economic development strategies.
Using community-level data, the purpose of the current study is to empirically analyze the effects
of the structure of a community’s associational network on the two economic development strate-gies:
industrial recruitment and self-development. The primary goal of the analyses is to test the
following hypotheses:
• H1: Communities with relatively closed, cohesive associational networks (i.e. complete network
structures) exhibit higher numbers of self-development strategies.
• H2: Communities whose associational networks are loosely connected (i.e. bridging network
structures) exhibit higher amounts of industrial recruitment strategies.
• H3: Communities with non-redundant connections of dense organizational networks (i.e. coali-tional
network structures) are more likely to display both self-development and industrial
recruitment strategies.
6. Data and methods
Data for this analysis are drawnfrom interviews and surveys conducted in six rural communities
in Washington in the summer and fall of 2003. The six communities for this study were chosen
because they share a number of characteristics—are of relatively equal size (all under 10,000),
have similar levels of racial/ethnic composition, and are rural, but vary in amount and type of
recent economic development activities. Table 1 broadly describes each community on a number
of characteristics.
To represent community network structure, I analyze interlocking leadership among local com-munity
organizations and institutions. One can either focus on the linkages among organizations
created by members or the linkages among members created by organizations. Here I focus on
links among organizations created by members. To evaluate each community’s associational net-work
structure, I analyze data from 15 to 34 interviews with local leaders and citizens from each
community, with a total of 150 participants among the six communities. Informants were selected
to represent one of 20 categories of people that characterized the community and therefore needed
to be represented. Sixteen of the categories of people were consistent for each community, while
four wild card slots were made available to fill with people from categories that were unique
to each particular community. A list of the categories can be found in the Appendix. A local
community coordinator from each community, who was extremely familiar with that particular
community, helped identify and recruit the participants.
8. 476 J.A. Crowe / Social Networks 29 (2007) 469–488
Table 1
Name and broad description of the sampled communities
Community Population sizea Percent white Household median
Income
Percent
poverty
Primary economic
baseb
Rural typology
Creston 5,000–10,000 60–70 30,000–35,000 15–20 Farming Non-federal lands
Davis Grove 0–5,000 80–90 35,000–40,000 15–20 Non-specialized Federal lands
Gwenville Heights 5,000–10,000 80–90 35,000–40,000 10–15 Non-specialized Metro
Mayfield 0–5,000 80–90 35,000–40,000 10–15 Service industry Island
Rowans View 0–5,000 80–90 30,000–35,000 10–15 Farming Non-federal lands
Soundberry 0–5,000 70–80 30,000–35,000 15–20 Non-specialized Federal lands
a Population size, percent white, household median income, and percent poverty provided by the United States Census Bureau (2000).
b Primary economic base and rural typology provided by the Economic Research Service of the United States Department of Agriculture (1989).
9. J.A. Crowe / Social Networks 29 (2007) 469–488 477
Informants were asked a series of open-ended questions about general community action. The
purpose of the interviews was to capture the social network structure of each community. The
researcher asked participants to recall all local organizations and government institutions that they
belonged to, the number of years they had been a member, as well as all leadership positions that
they had held in the previous 5 years.
To evaluate the various strategies of economic development recently pursued by each com-munity,
I analyze survey data from the same informants who were interviewed. Informants were
asked a series of questions with regards to whether or not a particular type of economic develop-ment
activity had been implemented in the community in the past 3 years.3 Nine items asked about
self-development activities that were implemented in the previous 3 years. These items included:
efforts to promote agricultural diversification; to revitalize the downtown or retail sector of the
community; to retain or expand locally owned businesses or industry; to develop a small busi-ness
assistance program; to develop a commercial/retail center for locally owned businesses; to
apply for financial governmental assistance to expand local businesses; to attempt to find buyers
for local businesses; to develop or promote a local historic or cultural site or event to promote
tourism; and to encourage local realtors or contractors to develop housing. The mean number of
types of self-development activities implemented in the previous 3 years is computed and serves
as the indicator of self-development.4 An additional nine items asked about industrial recruitment
activities that occurred in the past 3 years. These items included: efforts to organize a committee
to recruit new business or industry; to attract a large scale agricultural producer or outside owned
value-added processing firm; to develop a commercial/retail center for outside-owned businesses;
to develop an industrial park; to develop and maintain contact with leaders in industry outside
the area; to apply for government financial assistance to attract industry or business; to seek
investments from corporations outside the community to expand business or industry; to bring a
state or federal office or facility to the community; to seek outside investors to develop single or
multi-family housing. The mean number of types of industrial recruitment activities implemented
in the previous 3 years is computed and serves as the indicator of industrial recruitment. Past
questionnaires and surveys used by Flora et al. (1997) and Sharp and Flora (1999) in their analy-ses
of entrepreneurial social infrastructure served as the basis for both the interview questionnaire
and the survey.
7. Analytic strategy
The first stage of the analyses focuses on the description of each community’s organizational
network with regards to component analysis. This is meant to give a vivid depiction of each
3 Questions measured a total of 18 different types of economic development activities. While the range of economic
development measures used is quite extensive, each measure falls into one of two categories: self-development or indus-trial
recruitment. These are two very different strategies that research has shown to yield different economic results.
Furthermore, previous research shows that different community traits are more favorable for implementing either self-development
or industrial recruitment strategies (e.g. Crowe, 2006; Sharp et al., 2002). Continuing with this tradition,
I aggregate the outcome measures into two composite measures: self-development and industrial recruitment. This also
helps to focus the analyses in a concise manner when comparing each outcome variable to the four network configurations.
4 While it is possible to achieve successful economic development by pursuing one or a couple of economic development
strategies, many communities have been scorned by “putting all of their eggs in one basket”. Particularly when it comes
to industrial recruitment, many communities have witnessed industries move in only to shut down operations a few years
later (LeRoy, 2005). For this reason, I equate the pursuit of a larger variety of economic development strategies as having
a more likely chance of benefiting the community both economically and socially.
10. 478 J.A. Crowe / Social Networks 29 (2007) 469–488
organizational network before more precise measures are conducted to determine the level of
bonding and bridging capital in each community.
For the second stage of the analyses, I examine the level of bonding and bridging social cap-ital
in each community by evaluating k-cores and cut-points of each organizational network. It
is useful to examine k-cores (Seidman, 1983) to help interpret the level of bonding capital in
each network structure. A k-core is a maximal subgraph in which each point is directly con-nected
to at least k other points.5 Thus an isolate is a ‘0-core’ since the single point is not
connected to any other points in the network. Because the current study is interested in bonding
and bridging network structures in how they relate to different types of economic development
strategies, the analysis of k-cores is an improvement over a measure of density for measuring
bonding structures.6 It is also important to look at the number and proportion of cut-points in
a network to measure the level and type of bridging capital in each network. Cut-points deter-mine
the extent of non-redundant contacts: contacts that are either not directly connected or have
contacts that are different from one another. A cut-point is a node in which its “removal would
increase the number of components by dividing the sub-graph into two or more separate sub-sets
between which there are no connections” (Scott, 2004, p. 107).7 Each sub-graph that either
stands alone or is connected to a larger graph by a cut-point is referred to as a block. Thus,
cut-points are essential in measuring the extent and type of bridging capital in a given network.
The existence of several cut-points indicates a coalitional network structure. While a loosely
connected network with few cut-points indicates a bridging network. Each community’s organi-zational
network is evaluated with regards to its level of k-cores and cut-points and is allotted
an estimated network configuration: complete, factional, coalitional, bridging, or a combination
of two.
For the final stage of the analyses, I test my hypotheses by comparing each community’s mean
number of pursued self-development and industrial recruitment activities with a community’s
organizational network structure.8 I do this in a qualitative manner by describing where each
community falls in the rank order of each type of development and comparing it to each commu-nity’s
network configuration based on the k-core and cut-point analyses depicted in the second
stage of the analyses.
5 Because the highest value of k for each of the six community network structures ranges from 3 to 8, I will compare
the proportion of organizations that belong to a three-core or higher (i.e. the proportion of organizations that are directly
connected to at least three other organizations).
6 While the density of each community network can be measured, a fundamental problem exists with this measure.
The density of a network depends on the size of the graph. This prevents density measures from being compared across
networks of different sizes (Friedkin, 1981; Scott, 2004). While measuring the mean degree of each network overcomes
this limitation, it does not measure the bonding type of structures that are theoretically important for the current study. This
is because one member may have direct ties with many other members thus raising the mean number of ties for all other
members of a network whom may not have many direct ties with other members in the network. Because the analysis of
k-cores overcomes both of these limitations, the current study uses k-cores to measure bonding network structures.
7 This is what Burt (1992) refers to as “structural holes.”
8 Alimitation of cross-sectional data performed on a small number of communities is the uncertainty of causation. While
descriptive comparisons can reveal trends between the dependent and independent variables, caution must be taken in
asserting causality from data collected from one point in time. Nevertheless, various forms of social capital theory assert
that network structures influence economic development and not vice versa. Furthermore, the measures of economic
development activities are based on the previous 3 years, while most participants were members of organizations and
institutions for much longer than three years (6.6 years on average). Because the study’s hypotheses were made prior to
data collection, I infer causal relationships, albeit with caution.
11. J.A. Crowe / Social Networks 29 (2007) 469–488 479
8. Component analysis
I gathered organizational and institutional9 membership data from 15–34 key informants from
each of the six communities. Table 2 provides the number of informants and organizations along
with a descriptive summary of the associational networks for each community. For instance, in
RowansView, I acquired information from 22 key informants on 48 organizations and institutions,
while in Mayfield I collected information from 34 informants on 72 organizations and institutions.
Before describing each community’s network structure with regards to its level of bonding
and bridging capital, component analysis of the organizational adjacency matrix helps to describe
the overall appearance of each community’s organizational network structure. A component is a
“maximal connected subgraph” (Scott, 2004, p. 101). In other words, a component is the largest
sub-graph of the entire network in which all points are connected to all other points in the sub-graph
by one or more paths. By examining the components of each community’s organizational network,
one can begin to see distinct differences among the six communities. For instance, Gwenville
Heights has the most components at five. The largest component includes 39 organizations linked
by 18 informants. On the other hand, Mayfield has one component that consists of 70 organizations
linked by 28 informants. Component analysis suggests that Gwenville Heights may be more
factional, while Mayfield may take on characteristics of a complete network structure. However,
more precise measures need to be taken to determine the level of bonding and bridging capital in
each community. This can be done by examining k-cores and cut-points of each organizational
network. This will also help to determine the organizational network structure of each community
in relation to the network configurations depicted in Fig. 1.
9. Organizational network structure in each community
Here I describe and interpret each community’s organizational network structure in relation
to the network configurations depicted in Fig. 1. Mayfield’s organizational network is large with
numerous ties among it various organizations. At the core of the network is a densely interlocked
clique (see Fig. 2). One hundred percent of the possible links among organizations exist within
this eight-member clique. Mayfield has the highest order of a k-core among the six communities
with k = 8, in which nine organizations are connected to eight other organizations. The proportion
of organizations in Mayfield that are connected to a minimum of three other organizations is .78
(see Table 2).
Mayfield’s network structure has five cut-points and six blocks. However, because there are a
total of 72 organizations in the network, the proportion of cut-points is small at .069 (see Table 2).
These findings suggest that Mayfield has a highly dense associational network with relatively
few structural holes. Thus Mayfield’s interorganizational structure appears to be characterized
by a strong bonding structure. Because of these dense existing ties, trust and norms are more
likely to develop leading Mayfield to have a high potential for implementing self-development
projects.
Creston’s network structure is much more sparse and lacks the cohesion of the Mayfield
network. Creston’s organizational network is the smallest with 18 organizations broken into two
9 Organizations included voluntary and civic organizations such as the Chamber of Commerce, Kiwanis, and local
development groups. Institutions included boards associated with government, the hospital, schools, churches, and the
like.
12. 480 J.A. Crowe / Social Networks 29 (2007) 469–488
Table 2
Organizations, networks, and economic development: descriptive summary
Mayfield Rowans View Soundberry Gwenville Heights Davis Grove Creston
Organizational data
Total organizations 72 48 35 49 28 18
Number of informants 34 22 18 29 30 15
Number of components 1 3 4 5 2 2
Largest component
Organizations 70 43 19 39 24 11
Largest component
Interorganizational members 28 16 13 18 20 6
Isolated organizations 2 0 1 2 2 4
Indicators of network closure
Largest k-core 8 5 5 5 4 3
Number of organizations in largest k-core 9 17 6 6 5 8
Proportion in 3-core and higher .78 .78 .67 .65 .57 .44
Indicators of structural holes
Number of cut-points 5 5 5 5 2 4
Number of blocks 6 10 10 13 5 6
Proportion of cut-points to total points .07 .10 .14 .10 .07 .22
Estimated network configuration Complete Coalitional Coalitional/factional Factional/bridging Bridging Coalitional/
bridging
Measures of economic development
Self-development (ranking from highest to lowest) 4.72 (2nd) 5.36 (1st) 3.23 (4th) 3.11 (5th) 2.65 (6th) 4.56 (3rd)
Industrial recruitment (ranking from highest to lowest) 1.64 (6th) 3.64 (2nd) 2.69 (3rd) 2.32 (4th/5th) 2.32 (4th/5th) 4.22 (1st)
13. J.A. Crowe / Social Networks 29 (2007) 469–488 481
Fig. 2. Interorganizational network structures in six communities.
components (Fig. 2 shows the largest component). The highest order of a k-core is k = 3, in which
eight organizations are connected to three other organizations. The proportion of organizations
that are connected to a minimum of three other organizations is .44. This proportion is much
smaller than it was for Mayfield. Four organizations serve as cut-points, while there are a total
14. 482 J.A. Crowe / Social Networks 29 (2007) 469–488
Fig. 2. (Continued ).
15. J.A. Crowe / Social Networks 29 (2007) 469–488 483
of six blocks. Since there are a relatively low number of total organizations, the proportion of
organizations that serve as cut-points connecting non-redundant contacts is .22. This proportion
of cut-points is three times the Mayfield’s proportion.
Creston has somewhat cohesive sub-components, but has the highest proportion of structural
holes out of the six communities. These findings suggest that Creston’s network structure possesses
a mix of coalitional and bridging properties. Creston’s high proportion of cut-points mirrors a
coalitional network structure. However, the less cohesive sub-components reflect a network that
is bridging in nature. These network properties are conducive for industrial recruitment but only
modestly favorable for self-development.
Rowans View’s network is relatively large with one large component and two small compo-nents.
The highest order of a k-core is k = 5, in which 17 organizations are connected to five other
organizations. The proportion of organizations that are connected to a minimum of three other
organizations is .78. This is the same proportion as Mayfield, although the value of the highest
k-core is lower. Five organizations serve as cut-points, while there are a total of 10 blocks. For the
entire network structure, the proportion of organizations that serve as cut-points connecting non-redundant
contacts is .10. However, for the sub-network shown in Fig. 2 that revolves around the
arts council (TVAC) the proportion of cut-points is .14 (2 out of 14). The proportion of cut-points
is lower than it was for Creston but higher than it was for Mayfield.
Rowans View has highly cohesive sub-components with a relatively mid-range proportion of
structural holes. While, the proportion of cut-points lies in the middle for the six communities,
one can clearly see by looking at the TVAC-centered sub-network (Fig. 2) that Rowans View’s
network structure is coalitional. Therefore, Rowans View’s network structure is favorable for both
self-development and industrial recruitment.
Among the six communities, Soundberry lies in the middle with regards to number of orga-nizations
at 39. It consists of one large component, two mid-size components, and one small
component. The highest order of a k-core is k = 5, in which six organizations are connected to
five other organizations. The proportion of organizations that are connected to a minimum of
three other organizations is .67. Compared to the other five communities this proportion is in the
middle. Five organizations serve as cut-points, while there are a total of 10 blocks. The proportion
of organizations that serve as cut-points connecting non-redundant contacts is .14.
Soundberry has somewhat cohesive sub-components; however, it has several sub-components
that are not connected to each other. The largest subcomponent, which consists of 19 organizations,
has a higher proportion of structural holes. Soundberry’s interorganizational network structure is
quite different from the other community network structures. While the overall network structure
appears to be factional, the network structure of the largest component has coalitional properties.
These two network structures have quite different expectations for economic development. While
factional network structures are expected to have low numbers of both industrial recruitment
and self-development activities, coalitional network structures are expected to be favorable to
both types of economic development strategies. Therefore, Soundberry may lie somewhere in the
middle with regards to both types.
The Gwenville Heights network is large with one large component and four small components.
The highest order of a k-core is k = 5, in which six organizations are connected to five other
organizations. The proportion of organizations that are connected to a minimum of three other
organizations is .65. Five organizations serve as cut-points, while there are a total of 13 blocks.
The proportion of organizations that serve as cut-points connecting non-redundant contacts is .10.
Gwenville Heights has somewhat cohesive sub-components with a relatively lower proportion of
structural holes.
16. 484 J.A. Crowe / Social Networks 29 (2007) 469–488
Of the six communities, Gwenville Heights appears to be the most factional. Several blocks
are not linked to other blocks of organizations. However, the largest component appears to have
bridging qualities. The proportion of organizations that are connected to at least three other organi-zations
is relatively lowas well as the proportion of cut-points. Both factional and bridging network
structures are expected to result in low levels of self-development. However the two structures
are expected to produce opposite results with regards to industrial recruitment. While bridging
structures are expected to produce higher levels of industrial recruitment, factional structures are
expected to produce low levels. Thus, Gwenville Heights may lie somewhere in the middle with
regards to industrial recruitment activity.
Davis Grove’s network is relatively small with a total of 29 organizations. The highest
order of a k-core is k = 4, in which five organizations are connected to four other organi-zations.
The proportion of organizations that are connected to a minimum of three other
organizations is .57. Two organizations serve as cut-points, while there are a total of five
blocks. The proportion of organizations that serve as cut-points connecting non-redundant
contacts is .069. While Davis Grove’s interorganizational network is not very dense, it is
connective. Hence, Davis Grove has a bridging network structure. With a bridging network
structure, self-development is expected to be low and industrial recruitment is expected to be
higher.
10. Qualitative assessment of community network structure and economic development
Table 2 provides the number of types of economic development strategies implemented for
the two forms of economic development for each community along with each community’s rank
order with regards to each type of development. For self-development, communities on average
implemented 3.84 types of self-development activities over the past 3 years. Rowan’s View
had the highest amount of self-development activities (5.36) while Davis Grove had the least
(2.65). On average, all communities had implemented fewer industrial recruitment activities
than self-development activities over the past 3 years (2.35 compared to 3.84). Creston had the
highest amount of industrial recruitment activities (4.22), while Davis Grove once again had the
fewest number at .4.
When comparing each community’s mean number of self-development and industrial recruit-ment
activities with a community’s associational network structure, a pattern emerges. First, the
communities that have the top two highest number of self-development activities implemented
in the past 3 years have the highest proportions of organizations and institutions that belong to a
3-core and higher (are directly connected to at least three other organizations). Rowans View and
Mayfield have the highest number of different types of recently implemented self-development
activities (5.36 and 4.72, respectively) and have the most cohesive sub-components of the six com-munities
with 78% of the organizations in both communities directly connected to at least three
other organizations. Mayfield has a network structure similar to a complete network structure,
while Rowan’s View has a coalitional network structure. Both network structures were expected
to have high levels of self-development.
In addition the community that has the lowest number of recent self-development activities
(Davis Grove) has a bridging network structure with a proportion of organizations and institutions
that belong to a 3-core or higher at .56. Gwenville Heights, which has the second lowest number
of recent self-development activities, has an overall factional network structure with its largest
component having a bridging network structure. Hence, it appears that communities that have
complete or coalitional interorganizational network structures are more likely to implement
17. J.A. Crowe / Social Networks 29 (2007) 469–488 485
self-development activities than communities with bridging or factional networks. This supports
my first hypothesis.
With regards to industrial recruitment, a different pattern emerges. First, the community that has
the highest proportion of organizations serving as cut-points (Creston) has the highest number
of recently implemented industrial recruitment activities. Creston implemented 4.22 types of
industrial recruitment activities in the previous 3 years and 22% of its organizations serve as cut-points
in its associational network. Creston’s network structure has both coalitional and bridging
properties. While it has the highest proportion of cut-points among the six communities, the
density among sub-groups is relatively low. Rowans View had a coalitional network structure
and had the second highest number of recently implemented industrial recruitment activities with
3.64. The coalitional and bridging network structures were predicted to have higher amounts of
industrial recruitment strategies.
In addition, the two communities with the lowest number of recently implemented industrial
recruitment activities (Mayfield and Gwenville Heights) have low proportions of organizations
serving as cut-points (.069 and .10, respectively). Mayfield’s network structure resembles a com-plete
network structure by having one tightly knit component, while Gwenville Heights’ overall
network structure is factional with five separate components. Both complete and factional net-work
structures were predicted to have lower amounts of industrial recruitment activities. Hence,
it appears that communities with coalitional and bridging associational network structures are
more likely to implement industrial recruitment strategies than communities whose networks are
complete or factional. This is in support of my second hypothesis.
Finally, it is important to note that both communities with coalitional network structures
(Rowans View and Creston) displayed high amounts of both strategies of economic develop-ment.
In fact, Rowans View had the highest number of self-development activities and the second
highest amount of industrial recruitment activities, both numbers well above the mean. Creston
had the highest amount of industrial recruitment activities and the third highest amount of self-development
activities, again both numbers above the mean. This supports my third hypothesis
that communities with non-redundant connections of dense organizational networks display high
amounts of both self-development and industrial recruitment.
11. Discussion and conclusion
Does a community’s associational network structure have an effect on the type and extent
of economic development strategy pursued? For the six communities in the current study, it
appears that network structure does impact economic development activities. However, different
network qualities have a positive impact on different types of economic development strategies.
A certain level of cohesiveness among community organizations and institutions are favorable
for implementing self-development activities. This may be because cohesive ties are effective
in lowering the risk of cooperation and thereby making trust and norms possible. Because self-development
activities come from within the community and rely on local resources, high levels
of trust and norms lower the risk of cooperation that is needed to successfully implement the
projects. With regards to industrial recruitment activities, bridging and coalitional networks are
desirable. Industrial recruitment comes from outside of the community. Therefore, a high level
of trust and norms from within the community may not be needed as much as is access to a wide
variety of information in coming up with a successful plan to recruit outside businesses.
These findings have several interesting implications for the community sociology and
economic development literature. The results of the current study show that different types of
18. 486 J.A. Crowe / Social Networks 29 (2007) 469–488
network structures facilitate different kinds of economic development activities. For industrial
recruitment, networks that are bridging facilitate more types of economic development. However,
networks with bonding elements are more likely to generate more types of self-development.
While bonding and bridging network structures appear to be at odds with one another, it is
possible for communities to increase both forms of economic development by maintaining a
certain level of cohesiveness among subcomponents and increasing the number of organizations
that serve as cut-points connecting non-redundant sources of information. This is representative
of a coalitional network structure.
The current study focuses on the impact of structural network configurations and their impact
on different strategies of community-level economic development. In this sense it is fairly unique,
seeing that most studies of economic development focus on examining the attributes of the com-munity
that facilitate development. However, a brief discussion of the study’s findings in light
of some specific community characteristics is warranted. The following are mere observations,
given that the number of communities in the study is not large enough for empirical testing.
First, it appears that population size and racial make-up of the community have little influence
on economic development activities (see Table 1). The community with the largest population,
Gwenville Heights, did not rank high for either self-development or industrial recruitment. On the
other hand the community with the highest percent of racial and ethnic minorities, Creston, ranked
high for both industrial recruitment and self-development—which is in contrast to the popular
belief that minority communities are less likely to implement economic development. Second, it
appears that the level of financial resources in a community, at least for these six communities,
has little impact on economic development activities. The level of household income was rela-tively
similar for all six communities (between $30,000 and $40,000). In fact, some communities
with higher income levels (such as Gwenville Heights and Davis Grove) had lower economic
development activity, while some communities with lower income levels (such as Creston and
Rowan’s View) had higher economic development activity. Likewise, the percent of people below
poverty did not seem to influence community-level economic development activity. This does not
imply that a community’s ability to mobilize resources does not impact economic development.
However, in light of a community’s financial resources, network structures seem to matter. Of all
the indicators shown in Table 1, rural typology appears to have the most potential for influencing
which economic development strategy is pursued. The communities that are limited in available
land by either being an island community or surrounded by federal lands rank low for industrial
recruitment. Crowe (2006) argues that the availability and control over natural surroundings have
a significant positive effect on industrial recruitment. It may be the case that the location of Davis
Grove and Soundberry near federal lands and Mayfield on an island may limit the types of oppor-tunities
they can pursue. Thus, more research is needed to tease out the impact network structures
have on economic development activities controlling for various community attributes such as a
community’s resource base and natural surroundings.
In addition to teasing out the impact of network structures in congruence with various com-munity
attributes, further studies need to address the impact other types of networks outside of
the community have on different economic development strategies. For instance, future research
is needed to analyze how linking social capital (networks and connections between communities
and other communities and institutions) interacts with bonding and bridging social capital and
how this interaction impacts various forms of economic development. Finally, future research is
needed to extend the analyses to other forms of community development. The current study limits
community development to two forms of economic development. However, community develop-ment
encompasses a broad spectrum of phenomena. To identify the impact of different forms of
19. J.A. Crowe / Social Networks 29 (2007) 469–488 487
network structure on community development, future research should examine their influence on
other types of development in the community, such as recreational and social service opportunities
as well as network capital’s influence on the capacity of social institutions to distribute resources
to the community.
Acknowledgements
I wish to thank Andrew Jorgenson, Thomas Rotolo, Don Dillman and three anonymous
reviewers for their helpful comments on various drafts of this manuscript.
Appendix Community interview categories
1. Parent
2. Nonprofit youth focused service organization
3. Nonprofit adult focused service organization
4. Major employer
5. Entrepreneurial business
6. Faith based organization
7. Elected official
8. Law enforcement
9. Social services agency
10. Chamber/economic development council
11. School employee (must live in community)
12. School board member
13. Hospital/health organization
14. Senior citizen
15. Representatives of ethnic groups in community
16. Older youth
17–20. Wild card
Note: Wild Card category examples may include but are not limited to: farming community,
service club representative, arts community, representative from an environmental group, factory
worker, and timber worker.
References
Brown, B., 1995. In Timber Country. Temple University Press, Philadelphia, PA.
Burt, R., 1992. Structural Holes: The Social Structure of Competition. Harvard University Press, Cambridge, MA.
Burt, R., 2002. The social capital of structural holes. In: Guillen, M., Collins, R., England, P.,Meyer,M. (Eds.), The New
Economic Sociology: Developments in an Emerging Field. Russell Sage, New York.
Crowe, J., 2006. Community economic development strategies in rural Washington: toward a synthesis of natural and
social capital. Rural Sociology 71, 573–596.
Eisinger, P., 1999. State economic development in the 1990s: Politics and policy learning. In: Blari, J., Reese, L. (Eds.),
Approaches to Economic Development. Sage, Thousand Oaks, CA.
Flora, J.L., Green, G.P., Gale, E.A., Schmidt, F.E., Flora, C., 1992. Self development: a viable rural development option?
Policy Studies Journal 20, 276–288.
Flora, C., Flora, J., Fey, S., 2004. Rural Communities: Legacy and Change. Westview, Boulder, CO.
Flora, J., Sharp, J., Flora, C., Newlon, B., 1997. Entrepreneurial social infrastructure and locally initiated economic
development in the nonmetropolitan United States. The Sociological Quarterly 38, 623–645.
Friedkin, N., 1981. The development of structure in random networks. Social Networks 3, 41–52.
Granovetter, M., 1986. Economic action and social structure: the problem of embeddedness. American Journal of Sociology
91, 481–510.
20. 488 J.A. Crowe / Social Networks 29 (2007) 469–488
Green, G.P., Flora, J.L., Flora, C.B., Schmidt, F.E., 1993. Community-based economic development projects are small
but valuable. Rural Development Perspectives 8, 8–15.
Leonard, R., Onyx, J., 2003. Networking through loose and strong ties: an Australian qualitative study. Voluntas: Inter-national
Journal of Voluntary and Nonprofit Organizations 14, 189–203.
LeRoy, G., 2005. The Great American Jobs Scam. Berrett-Koehler, San Francisco, CA.
Logan, J.R., Molotch, H., 1987. Urban Fortunes: The Political Economy of Place. University of California Press, Berkley,
CA.
Loveridge, S., 1996. On the continuing popularity of industrial recruitment. Economic Development Quarterly 10,
151–158.
Molotch, H., 1976. The city as a growth machine: toward a political economy of place. American Journal of Sociology
82, 309–332.
Molotch, H., 1993. The political economy of growth machines. Journal of Urban Affairs 15, 29–53.
Pellow, D., 2002. Garbage Wars. MIT Press, Cambridge, MA.
Portes, A., 1998. Social capital: its origins and applications in modern sociology. Annual Review of Sociology 24, 1–24.
Portes, A., Landolt, P., 1996. The downside of social capital. The American Prospect 26, 18–21.
Putnam, R., 1993. Making DemocracyWork: Civic Traditions in Modern Italy. Princeton University Press, Princeton, NJ.
Putnam, R., 2000. Bowling Alone: The Collapse and Revival of American Community. Simon and Schuster, New York.
Scott, J., 2004. Social Network Analysis. Sage Publications, London.
Seidman, S., 1983. Network structure and minimum degree. Social Networks 5, 269–287.
Shaffer, R., Summers, G., 1989. Community economic development. In: Christenson, J., Robinson, J. (Eds.), Community
Development in Perspective. Iowa State University, Ames, IA.
Sharp, J., Flora, J., 1999. Entrepreneurial social infrastructure and growth machine characteristics associated with
industrial-recruitment and self-development strategies in nonmetropolitan communities. Journal of the Community
Development Society 30, 131–153.
Sharp, J., Agnitsch, K., Ryan, V., Flora, J., 2002. Social infrastructure and community economic development strategies:
the case of self-development and industrial recruitment in rural Iowa. Journal of Rural Studies 18, 405–417.
Summers, G., 1986. Rural community development. Annual Review of Sociology 12, 347–371.
Taylor, M., 2004. Community issues and social networks. In: Phillipson, C., Allan, G., Morgan, D. (Eds.), Social Networks
and Social Exclusion. Ashgate, Burlington, VT.
Wasserman, S., Faust, K., 1994. Social Network Analysis: Methods and Applications. Cambridge University Press,
Cambridge, United Kingdom.
Woolcock, M., Narayan, D., 2000. Social capital: Implications for development theory, research, and policy. The World
Bank Research Observer 15, 225–249.