Quick Facts - Macedonia - 2013 Annual Report on the State of Philanthropy
•
0 likes•70 views

Quick Facts for Macedonia 2013 Annual Report.

Recommended
Recommended
More Related Content
What's hot
What's hot (20)
Similar to Quick Facts - Macedonia - 2013 Annual Report on the State of Philanthropy
Similar to Quick Facts - Macedonia - 2013 Annual Report on the State of Philanthropy (20)
More from Catalyst Balkans
More from Catalyst Balkans (20)
Recently uploaded
Recently uploaded (20)
Quick Facts - Macedonia - 2013 Annual Report on the State of Philanthropy
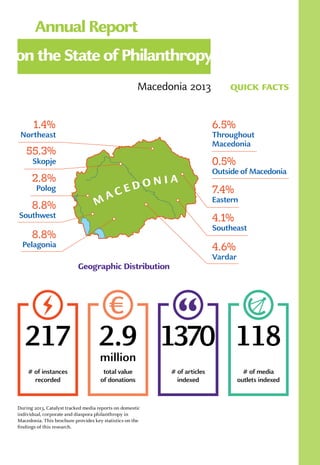
- 1. Macedonia 2013 quick facts During 2013, Catalyst tracked media reports on domestic individual, corporate and diaspora philanthropy in Macedonia. This brochure provides key statistics on the findings of this research. 1370 1182.9million 217 # of instances recorded # of articles indexed # of media outlets indexed total value of donations Annual Report on the State of Philanthropy 65 7235,9milion 399 # of instances recorded # of articles indexed # of media outlets indexed total value of donations Annual Report on the State of Philanthropy M A C E D O N I A 8.8% Southwest 6.5% Throughout Macedonia 2.8% Polog 0.5% Outside of Macedonia 55.3% Skopje 4.6% Vardar 7.4% Eastern 4.1% Southeast 8.8% Pelagonia 1.4% Northeast Geographic Distribution
- 2. 2013 macedonia TheStateofPhilanthropy Purpose of Giving Type of Beneficiary Institutions Support to Marg. Groups Poverty Reduction Healthcare Education Other Public Infrastructure Natural Disaster / Emer. Mgmt. Heritage Culture Religion Environmental Protection Sport Economic Development 0 10 20 30 40 50 60 70 80 78 45 36 19 10 6 4 4 3 3 2 2 2 Unspecified 90 3 Institutions Nonprofit Organizations Individuals / Families Local / National Govt. Religious Communities Other Unknown 0 20 40 60 80 70 60 54 10 8 8 7 # of instances # of instances
- 3. 2013macedonia TheStateofPhilanthropy Top 3 Final Beneficiary Groups Final Beneficiary Groups 0–2% 2–5% 5–10% 10–20% Talented Children and Youth Elderly Persons Mothers and Newborns Children and Youth at Risk Persons with Addiction Refugees and Internally Displaced Persons Children and Youth Members of Minority Groups People Living with HIV General Population Members of Religious Communities Children and Youth Without Parental Care Populations of Specific Communities Children and Youth Children and Adults with Physical Disabilities Adults and Children with Health Problems Children and Youth with Developmental Difficulties PERCENTAGE OF INSTANCES 0–2% 2–5% 5–10% 10–20% 20+% FINAL BENEFICIARY GROUPS Economically Vulnerable Use of Donations 14 Materials and Consumables 3 Scholarships 12 Services 15 Capital Investments 33 Equipment 12 Unknown 19 General Support 82 Humanitarian Aid 50 100 150 ONE-TIME LONG-TERM UNKNOWN 23 Health Treatments / Operations 3 Awareness Raising Campaigns 1 Research and Development 21.2% 15.7% 10.6% ECONOMICALLY VULNERABLE ADULTS, CHILDREN AND YOUTH WITH HEALTH PROBLEMS CHILDREN AND ADULTS WITH DEVELOPMENTAL DISABILITIES # of instances
- 4. Value of Donations, by Donor Type (%) Type of Donor, by # of Instances Citizens (Mass Individual) Mixed Donor Types Companies Associations Individuals Small and Medium Enterprises Corporate Foundations 0 10 20 30 40 50 72 69 40 18 14 2 2 60 70 80 43.2% Companies 34.9% Corporate Foundations 13.7% Citizens (Mass Individual) 6.4% Mixed Donors 1.9% Individuals 8.8% INSTANCES = 258,482 € VALUE OF DONATIONS BY TYPE OF DONOR Data Powered ByFinancial Support FromGiven that the value of the donation was reported in only 8.8% of the instances, estimation about the total amount donated is made by extrapolation based on the known data. For more information, please find the full report at www.catalystbalkans.org