Download to read offline
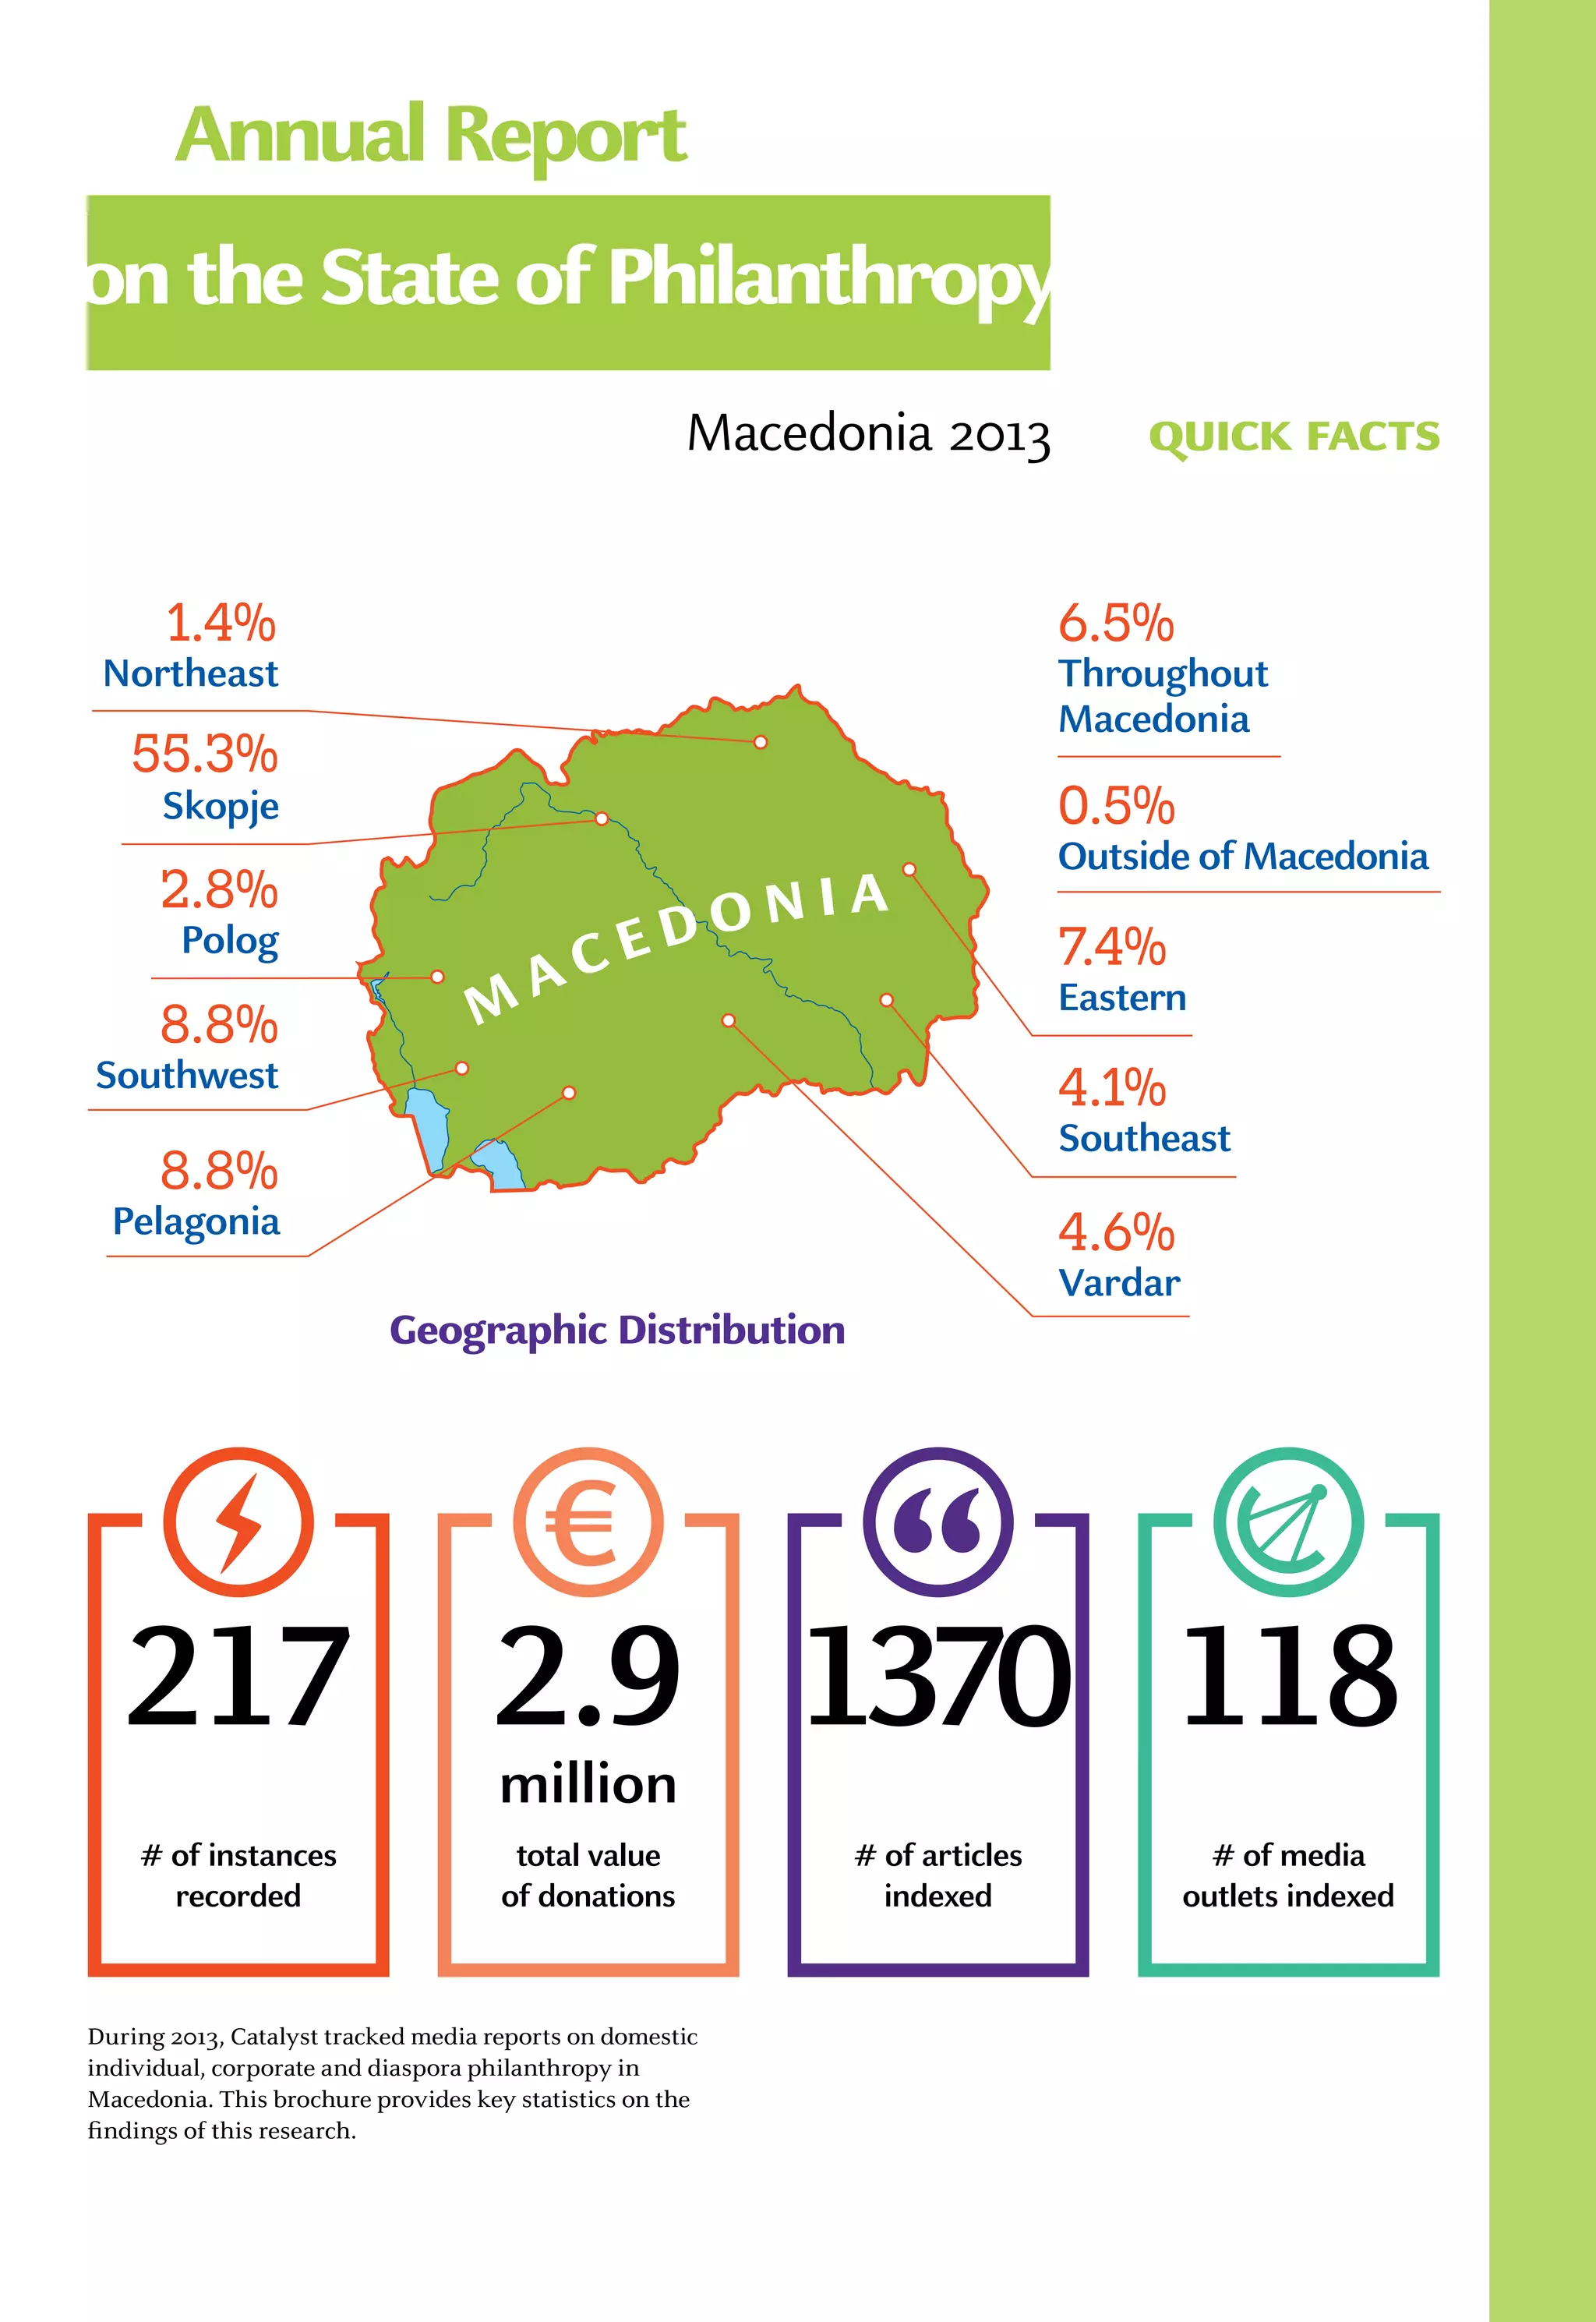
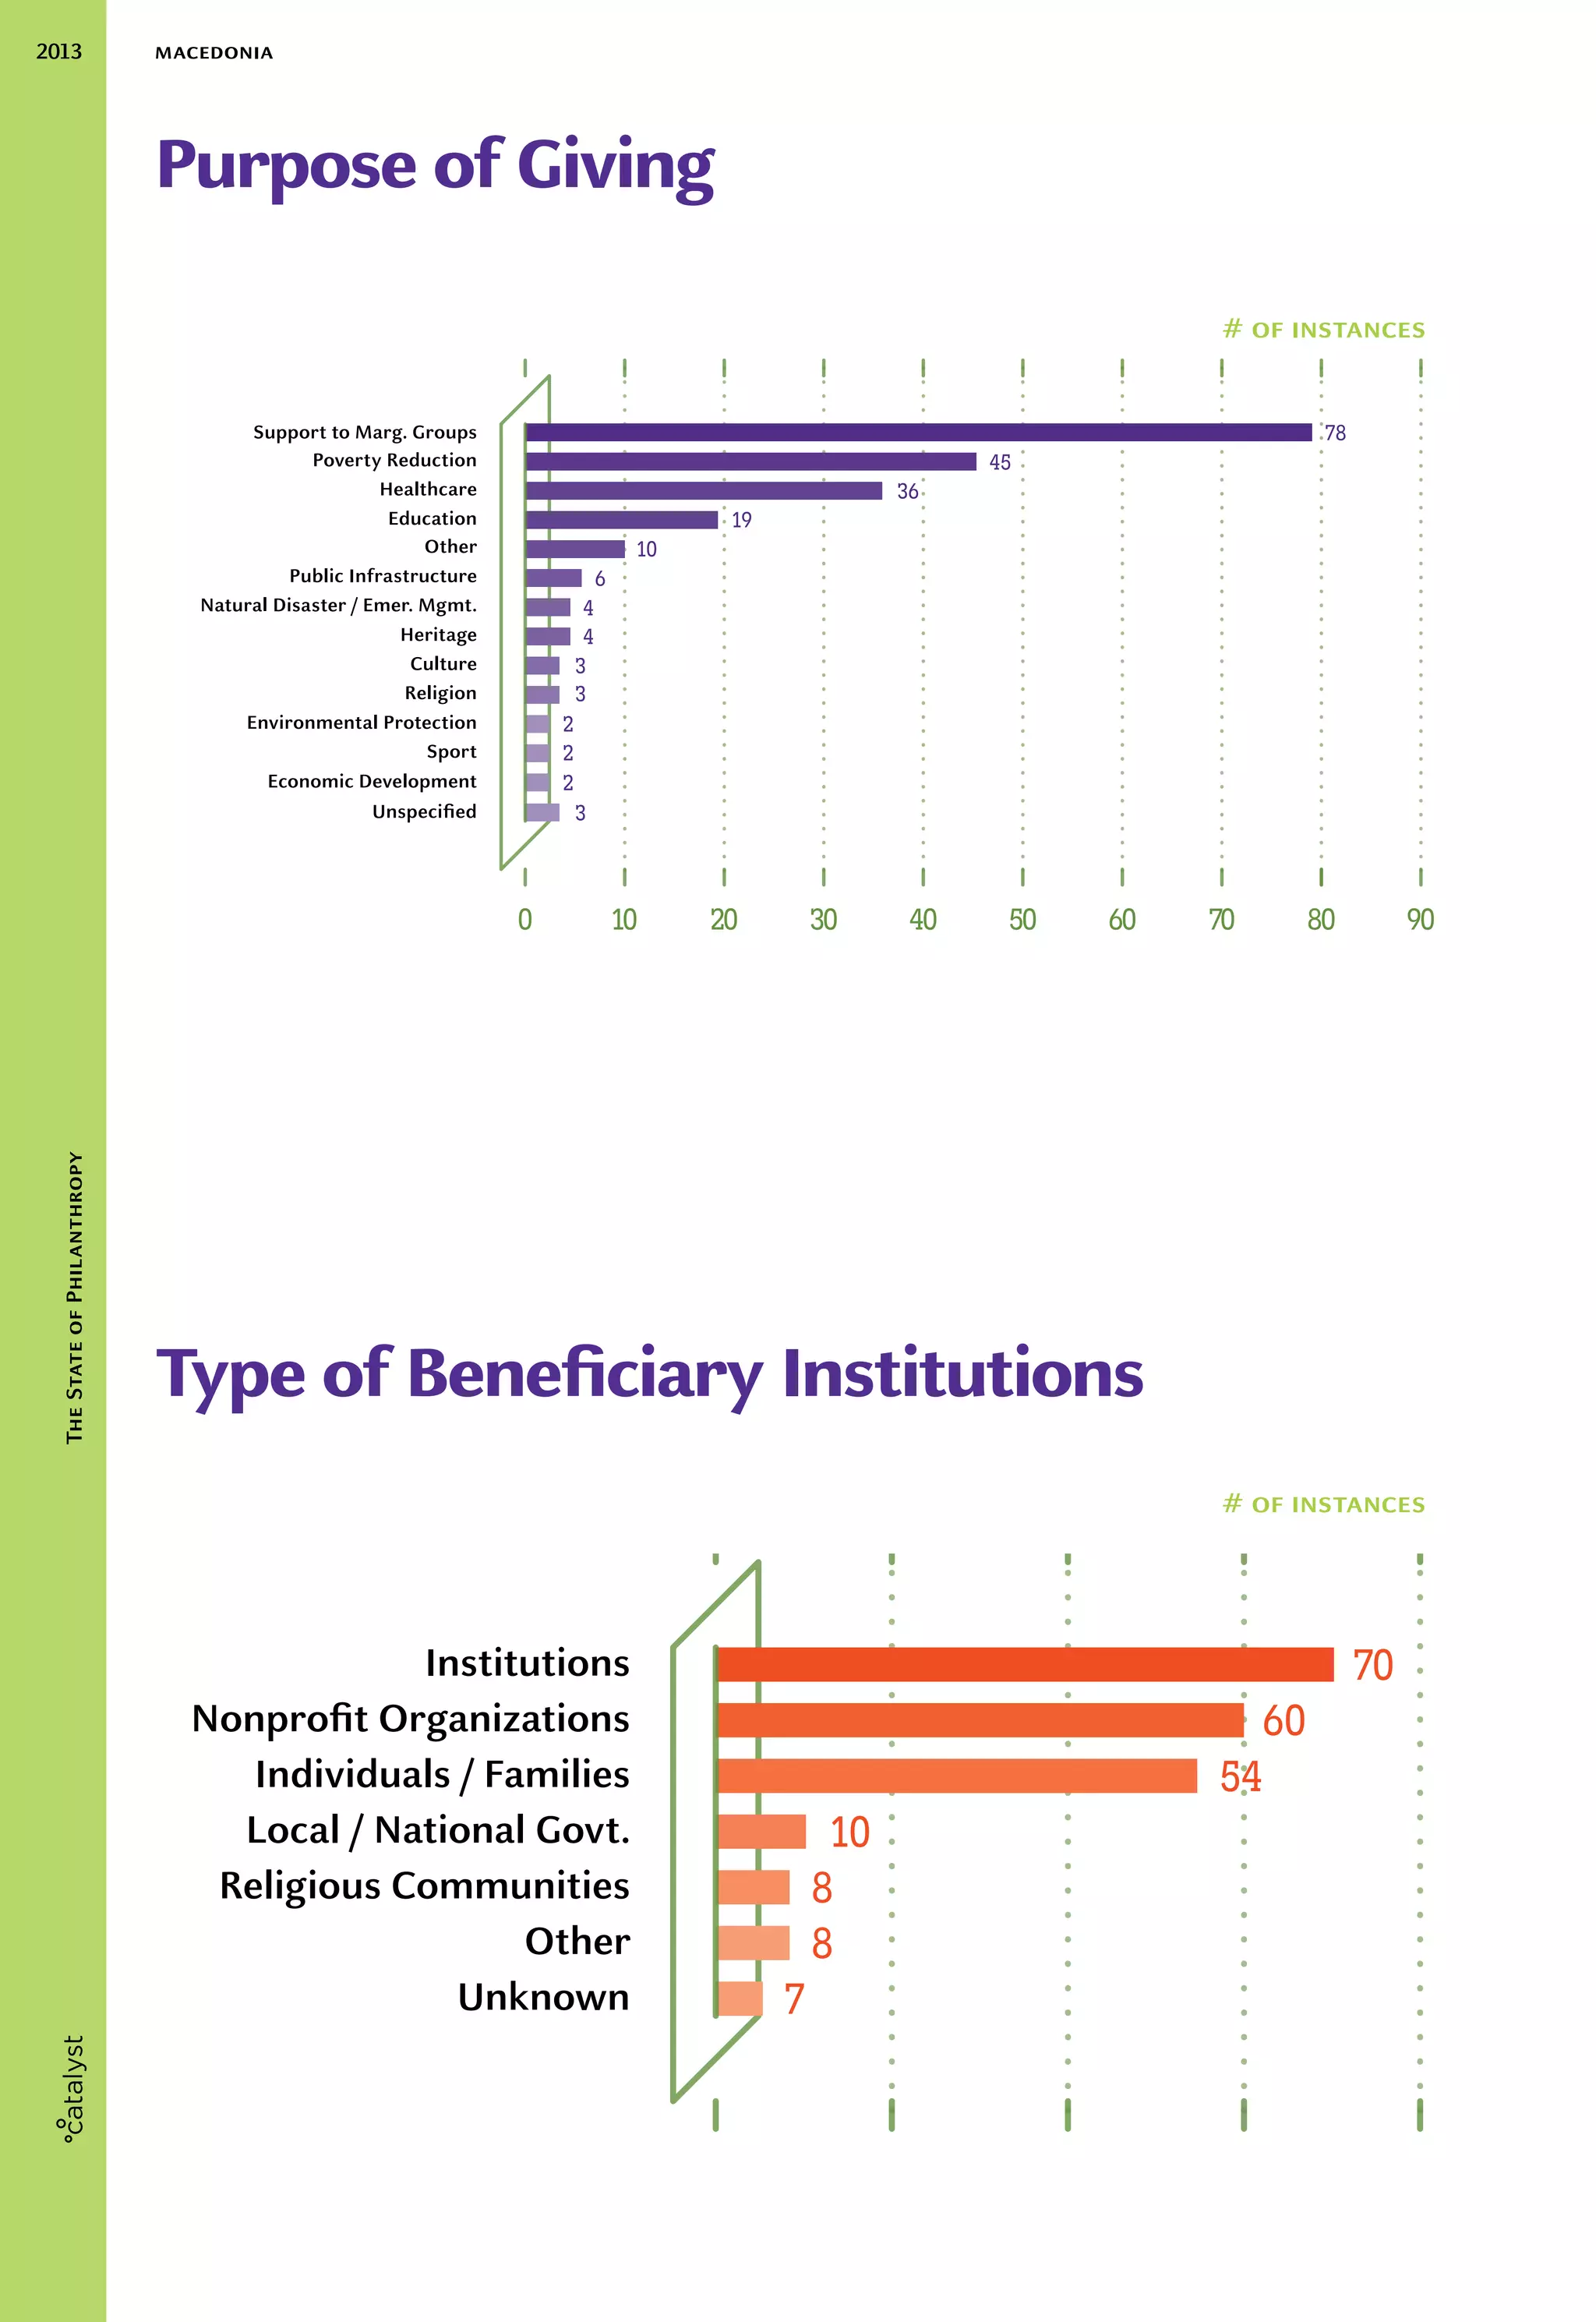


This document summarizes statistics about philanthropy in Macedonia in 2013. It found 1370 instances of philanthropy reported in 217 media articles from 65 outlets. The total value of donations was 1182.9 million denars (about $23 million USD). Most donations came from the Skopje region and supported economically vulnerable groups, healthcare, and education. Companies contributed the largest value of donations (43.2%) followed by corporate foundations (34.9%).


