
Recommended
Recommended
More Related Content
Similar to Here are a few options for Marks Rate if they go past the free tier of their paid analytics tool:1. Stay with the paid tool and upgrade to a paid plan. This provides continuity in data and analytics setup. 2. Move to a free tool but export data from the paid tool to maintain historical insights. This allows a budget-friendly switch but requires data migration work.3. Use both tools - keep the paid tool for more in-depth insights and customization, and use a free tool for basic metrics. This provides a hybrid approach.4. Consider a less expensive paid tool. Not all paid tools need to break the bank. Research affordable options.5. Look for cost
Similar to Here are a few options for Marks Rate if they go past the free tier of their paid analytics tool:1. Stay with the paid tool and upgrade to a paid plan. This provides continuity in data and analytics setup. 2. Move to a free tool but export data from the paid tool to maintain historical insights. This allows a budget-friendly switch but requires data migration work.3. Use both tools - keep the paid tool for more in-depth insights and customization, and use a free tool for basic metrics. This provides a hybrid approach.4. Consider a less expensive paid tool. Not all paid tools need to break the bank. Research affordable options.5. Look for cost (20)
More from BrittanyShear
More from BrittanyShear (12)
Recently uploaded
Recently uploaded (17)
Here are a few options for Marks Rate if they go past the free tier of their paid analytics tool:1. Stay with the paid tool and upgrade to a paid plan. This provides continuity in data and analytics setup. 2. Move to a free tool but export data from the paid tool to maintain historical insights. This allows a budget-friendly switch but requires data migration work.3. Use both tools - keep the paid tool for more in-depth insights and customization, and use a free tool for basic metrics. This provides a hybrid approach.4. Consider a less expensive paid tool. Not all paid tools need to break the bank. Research affordable options.5. Look for cost
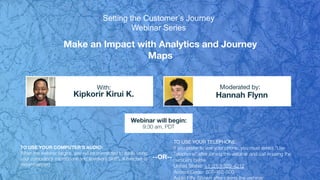
- 1. Make an Impact with Analytics and Journey Maps Kipkorir Kirui K. Hannah Flynn With: Moderated by: TO USE YOUR COMPUTER'S AUDIO: When the webinar begins, you will be connected to audio using your computer's microphone and speakers (VoIP). A headset is recommended. Webinar will begin: 9:30 am, PDT TO USE YOUR TELEPHONE: If you prefer to use your phone, you must select "Use Telephone" after joining the webinar and call in using the numbers below. United States: +1 (213) 929-4212 Access Code: 507-455-500 Audio PIN: Shown after joining the webinar --OR-- Setting the Customer’s Journey Webinar Series
- 2. Revulytics gives any software producers deep and actionable insight into who is using their software products and how they are being used, and the out-of-box analytics that enable them to grow incremental revenue, convert and retain customers, and make decisions about licensing and cloud transformation strategies.
- 3. Setting the Customer’s Journey Webinar Series Click on the Questions panel to interact with the presenters https://www.productmanagementtoday.com/webinar-series/setting-the-customer-s-journey/
- 4. About Kirui K. K. Kirui is the Co-founder & CEO of Tanasuk Africa (dba iHub Consulting) - a design thinking and software consulting firm working with organizations building products for African markets. He leads a talented team of design thinkers, UX researchers, developers, and project managers working with startups, corporates, and NGOs across Africa to help them realize the value of human-centered design as a problem-solving approach and to leverage the power of technology to solve some of their most pressing problems. Kirui also co-founded Nairobi Design Community (NDC), a a community of designers, product managers startup founders, and any other individuals who have an interest in using design thinking methods to solve their day to day design challenges. Through meetups and workshops, NDC shares best practices and tips on how to maximize the power of design thinking to solve problems. Previously, kirui worked as the Head of Product at Eneza Education - a startup providing affordable education to over 5 million learners across Africa. About Hannah Flynn Hannah went to The University of Chicago, where she majored in Environmental Studies with a concentration in Economics and Policy. She now works with Aggregage on social media strategy and webinar production for Product Management Today and B2B Marketing Zone. Setting the Customer’s Journey Webinar Series
- 5. 5 Setting the Customer’s Journey Webinar Series Agenda: 1. The case for product analytics 2. Demystify product analytics 3. Get you started with product analytics
- 6. 6 Setting the Customer’s Journey Webinar Series What we will cover 1. Why you should invest in product analytics 2. Misconceptions about data analytics 3. A framework for choosing product metrics 4. Overview of product analytics tools 5. How to make sense of your data
- 7. Case Study: Marks Rate Marks Rate is startup connecting individual investors with SMEs looking for LPO financing in Kenya. The team at Tanasuk Africa is working on the digital platform & it will go live in ~3 weeks
- 8. Before I continue, I would like to know the type of audience- designer, product manager, founder, developer?
- 9. THE CASE FOR PRODUCT ANALYTICS
- 10. As entrepreneurs / innovators/designers, we want to build products that will be used & have an impact Understanding how users are interacting with our product is the best feedback we can ever get
- 12. MISCONCEPTIONS ● You need specialized resources to do anything meaningful ● Qualitative data vs quantitative data ● You need to track every metric to understand your product ● Product analytic tools are expensive
- 13. CHOOSING THE RIGHT METRICS
- 14. Poll: How many metrics do you think one should track?
- 15. Getting it right is important Potential challenges when identifying metrics: ● Vanity metrics vs actionable metrics ● Products can have very many points we can track ● The more data you collect the more work you have to do to make sense of it ● Getting started can be daunting - starting simple is key To simplify this & ensure we don’t get it wrong, we need a framework to think through the process of identifying metrics. I use the Startup Pirate Metrics (AARRR)
- 16. About Startup Pirate Metrics ● Developed by Dave McClure, notable VC and head of the accelerator 500 Startups ● Modeled around the typical customer journey ● AARRR - Acquisition, Activation, Retention, Referral, Revenue ● Doesn’t apply only to startups, anyone can apply the approach
- 17. Startup Pirate Metrics (AARRR)
- 18. Sounds fairly straightforward but how do you actually work with this?
- 19. Remember Marks Rate? ● A platform connecting borrowers and investors ● Has two key users - Borrowers, Investors, and the Marks Rate team as 3rd user ● Each user has a different journey as they use the product ● For the purpose of this session we will look at the investor’s journey
- 20. Marks Rate Investor AARRR Acquisition A potential investor hears about Marks Rate (ads, word of mouth e.t.c) and is interested. They visit the site and successfully create an account Activation The investor reviews investing opportunities, picks one and puts down a commitment to invest Retention The investor keeps identifying and investing in more opportunities on the platform Referral The investor is happy about Marks Rate and refers it to other potential investors Revenue Marks Rate makes money from successful investments
- 21. This is still top level. Customer Journey Maps helps with the identification of specific metrics
- 22. Customer Journey Map “A customer journey map is a visual representation of the process a customer or prospect goes through to achieve a goal with your company. With the help of a customer journey map, you can get a sense of your customers' motivations -- their needs and pain points.”
- 23. How to use the customer journey map for metrics This involves three easy steps: 1. Identify the different journeys different users go through ○ For Marks Rate examples include investor registration, investor bidding, investor payout 2. Each journey has a series of steps from start to completion. You map out the steps 3. Identify metrics to track at each step in the journey A sample customer journey template. For our exercise, we don’t need to fill it out completely (Source)
- 24. Before we start Two key types of metrics: 1. Direct metrics - direct data from customer interactions e.g # of visitors 2. Derived metrics - based on a calculation from two or more metrics that we are tracking e.g conversion rate Both are important
- 25. Acquisition Journey for a Marks Rate Investor
- 26. Activation Journey for a Marks Rate Investor
- 27. Some typical metrics tracked 1. Acquisition — Customer Acquisition Cost (CAC), # of new users, Conversion rate 2. Activation — average time to activate, activation rate 3. Retention — active users (Daily, Weekly, Monthly), D1, D7, D30 retention, churn, stickiness (DAU/MAU) 4. Referral — referral rate, # of referrals, referral conversion rate 5. Revenue — average order size, repeat orders, revenue earned/day/month/year For revenue, always split first-time revenue from recurring to understand your growth engine
- 28. Important things to note 1. You will have to go through the above exercise for each user type and journey they go through 2. Startup Pirate metrics will help you understand the different stages of your product so use the approach. You can always do without it but it is better with the approach 3. Don’t feel the pressure to have many metrics at each step in the journey 4. At the end of the exercise you will have a lot of metrics so you will still have to cull and prioritize the ones that are crucial 5. Generally, derived metrics tell a better story than direct metrics
- 29. CHOOSING A PRODUCT ANALYTICS TOOL
- 30. Key Considerations 1. How much are you willing to invest? 2. At what stage is your product? Pilot, growth? 3. What volume of traffic are you handling? 4. Is it a complementary tool or the sole tool? 5. Who will use the tool?
- 31. Let us apply this to Marks Rate
- 32. Marks Rate ● How much are you willing to invest? ○ Marks Rate is a young startup with limited capital. A free tool is preferred ● At what stage is your product? Pilot, growth? ○ The web platform is in the pilot phase but the startup is not ● What volume of traffic are you handling? ○ Not significant enough as the target market is not a volume-based market
- 33. Marks Rate ● Is it a complementary tool or the sole tool? ○ It will complement Google Analytics ● Who will use the tool? ○ Everyone using the tool has limited tech knowledge and no background in analytics
- 34. Marks Rate Requirements For Marks Rate, the key requirements are: ● A free or very affordable tool because of budget constraints ● A tool that will provide insights with little or no customization after set up ● A tool that can be used by someone with little or no tech/analytics expertise
- 35. But first, please note that I use a very unconventional approach
- 36. Recommended Tool What would I choose? I would choose a paid tool for Marks Rate
- 37. Justification for a paid tool In choosing a paid tool, I made the following key calls: ● Most paid tools have a free tier ○ This fits within Marks Rate budgetary concerns as the amount of traffic on the platform will probably not surpass the free tier ● Paid tools provide insights with limited customization ○ The Marks Rate team has limited tech and analytics expertise so it is important that the tool requires little expertise ● Marks Rate are getting started on the analytics journey & have a lot to learn ○ Free tools require a significant time investment on customization in order to get the right info. When starting out, you will spend way too much time doing this ○ By choosing a paid tool, the Marks Rate team can make changes faster and learn what to track and what analysis to carry out without spending too much time doing customization
- 38. What happens if Marks Rate goes past the free tier? Poll: Move to a free tool or stick to the current one?
- 39. Marks Rate Growth Options When Marks Rate outgrows the free tier, they have several options: 1. Pay for the tool and continue using it ○ The assumption is that the team would have weighed the value of what they get vs what they pay & it makes sense to pay 2. Ditch the paid tool and opt for a free one ○ By this point, Marks Rate have learned what they need to focus on and they set up something similar to the paid tool 3. Combine elements of the paid tool with a free one ○ Send all data to the free tool and in addition use the paid tool for a specific case. As an example, they might be struggling with Retention so they would use the paid tool to track this Is there a preferred way? No there isn’t; it varies from product to product
- 40. General Pointers when Choosing a Tool
- 41. General Pointers Each product has its unique needs but they are general tips that apply across board: ● Data is only useful if you can get actionable insights to the right person. The tool you chose has to work for the people using it ● Experiment a lot before settling on a tool. It takes time but it is worth it ● Start small. Don’t fall into the trap of trying to capture everything all at once ● Periodically review if the tool is still a good fit for your product needs
- 42. MAKING SENSE OF YOUR DATA
- 43. Why is this important? Data is only useful when it can generate insights that aid decision making
- 44. Getting Started ● Most off-the-shelf products will provide enough analysis and guidance to get you started ● However, you need to know what to look for to make the best of it ● It is important to understand where your product struggles the most so that you can focus on that
- 45. Angles you can use You can get started with three broad concepts: ● Task completion ○ For users to get the value of our products, they need to complete a series of tasks. Funnels help us understand task completion & identify problematic areas ● Trends ○ You want to understand overall trends at a glance. Graphs depict this well. E.g is revenue increasing over time? Is your churn rate increasing? ● Cohort behavior ○ a cohort is a group of people who share a common characteristic over a certain period of time. It can be based on sign up date, marketing campaign e.t.c Cohort analysis involves examining how cohorts behave
- 46. 46 Setting the Customer’s Journey Webinar Series In Summary: 1. Product analytics gives useful insights on how to improve 2. Startup Pirate Metrics and Customer Journey Mapping will help you set up the right metrics 3. You can get started quickly - don’t seek perfection
- 47. Setting the Customer’s Journey Webinar Series Q&A Hannah Flynn With: Moderated by: Cofounder and CEO, Tanasuk Africa Kirui K. K. Site editor, Product Management Today https://www.productmanagementtoday.com/webinar-series/setting-the-customer-s-journey/
- 48. Kirui K. K. Co-founder and CEO, Tanasuk Africa Make an Impact with Analytics and Journey Maps August 14, 2019 at 9:30 AM PDT