
Recommended
Recommended
More Related Content
Similar to all sops combined pdf.pdf
Similar to all sops combined pdf.pdf (20)
Recently uploaded
Recently uploaded (20)
all sops combined pdf.pdf
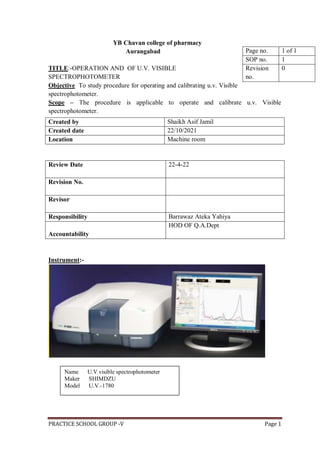
- 1. PRACTICE SCHOOL GROUP -V Page 1 YB Chavan college of pharmacy Aurangabad TITLE:-OPERATION AND OF U.V. VISIBLE SPECTROPHOTOMETER Objective To study procedure for operating and calibrating u.v. Visible spectrophotometer. Scope – The procedure is applicable to operate and calibrate u.v. Visible spectrophotometer. Instrument:- Page no. 1 of 1 SOP no. 1 Revision no. 0 Created by Shaikh Asif Jamil Created date 22/10/2021 Location Machine room Review Date 22-4-22 Revision No. Revisor Responsibility Barrawaz Ateka Yahiya Accountability HOD OF Q.A.Dept Name U.V visible spectrophotometer Maker SHIMDZU Model U.V.-1780
- 2. PRACTICE SCHOOL GROUP -V Page 2 Requirement – 2cuvetts, tissue paper, DOUBLE BEAM SPECTROPHOTOMETER Operation procedure- 1)Ensure the power plug of instrument and computer is not on. 2) Switch on the power supply pressing main switch of switchboard. 3) Remove silica bag from panel door. 4) On the system and instruments power buttons beep sound shows indication of on.Give some time to initialize the machines. 5) Make sure cuvettes are crackless and clean on both sides. (Lambda max of cuvettes should be zero). 6) Fill both the cuvettes with same blank sample and place in the cuvettes holder facing the blurred side facing yourself (clean if needed) 7) Open the UV probe version 2.70 software in the adjacent computer system. 8) Click “connect” button on bottom left side of screen the initializing will start in series showing green dots serially as LSI initialization , WI lamp energy check, wavelength origin 1 check, wavelength origin 2 check, standby 9) Now, put dilution sample in both cuvetts and close the instrument panel door. 10) Click on connect button on system and click on auto zero to tare the dilution sample to 0 absorbance. 11) Now change the closely placed cuvett with different samples to analyse keeping the upper side cuvett filled with dilution solvent sample . 12) The spectrophotometer is ready for further use. Caution- 1) Always remove silica bag before use of spectrophotometer and put bafore leaving machine room. 2) Always fill cuvettes at least 90%. 3) Close panel lead before running sample. 4) Before putting switch buttons off make sure the system and instrument is off already. 5) Wait after startimg the system to warm the sources of light. Page no. 2of 2 SOP no. 1 Revision no. 0 CREATED BY :- APPROVED BY:- REVIEWED BY:- AUTHORISED BY :- Shaikh Asif jamil Ms. Barrawaz Aateka Y HOD Dr. JP Sanghshetti Dr. Abubakar Salam Bawazir DATE & SIGNATURE 28-10-2021 BAY JNS ASB
- 3. PRACTICE SCHOOL GROUP -V Page 3 Aim: To study the effect of concentration on absorbance. Reference: Chatwal GR, Anand S (2002) Instrumental Methods of Chemical Analysis. (5th ed), Himalaya Publishing House, New Delhi. Davidson AG (2002) Ultraviolet-visible absorption spectrophotometer. In Beckett AH, Stenlake JB, (4thedn), Practical Pharmaceutical chemistry. CBS Publishers and distributors, New Delhi, 275-278. ICH (1996) Q2B Validation of Analytical Procedures-Methodology. Consensus Guidelines, ICH Harmonized Tripartite Guidelines Requirements: Glassware: Beakers, volumetric flasks, pipette, cuvettes Chemicals: Paracetamol, Methanol, Distilled water Instrument: SHIMADZU 1780 Software: UVProbe 2.70 Theory: UV spectroscopy is an absorption spectroscopy in which the molecules absorb wavelengths in UV region (400nm- 200nm) resulting in excitation of electrons. The instrument used is UV spectrophotometer which consists of components like radiation source, monochromator, detector, a recording system and sample cell. The instrument is connected to a software. The software measures the wavelength of samples of known concentration at which maximum absorbance is observed. At this maximum wavelength the absorbance of sample measured. Beer’s law: It states that the intensity of a beam of parallel monochromatic radiation decreases exponentially with the number of absorbing molecules. In other words, absorbencies proportional to the concentration. Lambert’s law: It states that the intensity of a beam of parallel monochromatic radiatiodecreases exponentially as it passes through a medium of homogeneous thickness. A combination of these two laws yields the Beer-Lambert law. Beer-Lambert law: When beam of light is passed through a transparent cell containing a solution of an absorbing substance, reduction of the intensity of light may occur. Mathematically, Beer- Lambert law is expressed as A = a. b. c Where, A = Absorbance or optical density a = Absorptivity or extinction coefficient b = Path length of radiation through sample c = Concentration of solute in solution. Both b and a are constant so a is directly proportional to the concentration Procedure: Procedure I: Preparation of Solutions Preparation of Stock solution (100μg/ml): Weigh accurately about 10 mg paracetamol and dissolve it in 15 ml methanol in 100 ml volumetric flask, make the volume upto 100 ml with distilled water.
- 4. PRACTICE SCHOOL GROUP -V Page 4 PREPARATION OF BLANK: Prepare 15: 85 %v/v solution of methanol and distilled water, as a blank and as a dilution solvent for standard dilution series. PREPARATION OF SAMPLE SOLUTIONS OF DIFFERENT CONCENTRATIONS: Pipette out 1, 2 to 5 ml of stock solution in 10 ml of volumetric flasks & make the volume upto the mark with dilution solution to get 10, 20, to 50 µg/ml respectively. Procedure II: Turn ON the UV-Vis Spectrophotometer and connected system. Run the UV Probe 2.70 software. Wait till the instrument to be initialised properly. Open Spectrum module in software. Wash the cuvettes with distilled water and rinse with the blank solution. Fill the cuvettes ≈ 80% with blank solution & clean it with lint free tissue paper. Place cuvettes in the sample compartment, and click on the Auto Zero button. Select the wavelength (nm) range to run the spectra. Wash and rinse the sample with the sample solution, scan the solution to get absorbance maxima (λmax). Calculate the absorbance maxima (λmax) for each dilution, andinterpreter the results for effect of concentration. Observation: Table 2.1 Absorbance of paracetamol in methanol Concentration (µg/ml) λmax (nm) Absorbance 10 244.40 0.271 20 244.40 1.862 30 244.40 2.677 40 244.40 3.454 50 244.40 3.844 Fig. 2.1: Spectrum on 50 µg/ml Fig. 2.2: Spectrum on 40 µg/ml nm. 200.00 250.00 300.00 350.00 400.00 Abs. 4.383 4.000 3.000 2.000 1.000 0.000 -0.254 nm. 200.00 250.00 300.00 350.00 400.00 Abs. 4.387 4.000 3.000 2.000 1.000 0.000 -0.253
- 5. PRACTICE SCHOOL GROUP -V Page 5 Fig. 2.3: Spectrum on 30 µg/ml Fig. 2.4: Spectrum on 20 µg/ml .Fig. 2.5: Spectrum on 15 µg/ml Fig. 2.6: Overlay spectra All the recorded spectra reveals that as we decrease the concentration of absorbing substance in the solution the relative absorbance also decreases. Result: Overlay spectra assures the Beer’s Law which states, the concentration is proportional to absorbance of the solution. Conclusion: The prepared dilution series obeys the Beer’s Law. nm. 200.00 250.00 300.00 350.00 400.00 Abs. 4.387 4.000 3.000 2.000 1.000 0.000 -0.253 nm. 200.00 250.00 300.00 350.00 400.00 Abs. 2.569 2.000 1.000 -0.092 nm. 200.00 250.00 300.00 350.00 400.00 Abs. 3.387 3.000 2.000 1.000 0.000 -0.167 nm. 200.00 250.00 300.00 350.00 400.00 Abs. 4.387 4.000 3.000 2.000 1.000 0.000 -0.254
- 6. PRACTICE SCHOOL GROUP -V Page 6 Aim: To determine concentration of unknown solution using standard solution. Reference: Chatwal GR, Anand S (2002) Instrumental Methods of Chemical Analysis. (5thedn), Himalaya Publishing House, New Delhi. Davidson AG (2002) Ultraviolet-visible absorption spectrophotometry. In Beckett AH, Stenlake JB, (4thedn), Practical Pharmaceutical chemistry CBS Publishers and distributors, New Delhi, 275-278. Requirements: GLASSWARE: Beakers, volumetric flasks, pipette, cuvettes CHEMICALS: Acetyl salicylic acid (Aspirin), Ethanol, Distilled water INSTRUMENT: SHIMADZU 1780 SOFTWARE: UVProbe 2.70 Theory: Refer to experiment no.1 page no.1-3 Procedure: Procedure I: Preparation of Solutions PREPARATION OF STOCK SOLUTION (100ΜG/ML): Weigh accurately about 10 mg aspirin and dissolve it in 10 ml ethanol in 100 ml volumetric flask, make the volume upto 100 ml with distilled water.This gives a solution of concentration 1mg/ml. Dilute 2ml from this solutionin20ml ethanol.Thisgives asolutionofconcentration 100µg/ml. PREPARATION OF SAMPLE SOLUTIONS OF DIFFERENT CONCENTRATIONS: Pipette out 1, 2 to 5 ml of stock solution in 10 ml of volumetric flasks & make the volume upto the mark with dilution solution to get 10, 20, to 50 µg/ml respectively. Procedure II: Turn ON the UV-Vis Spectrophotometer and connected system. Run the UV Probe 2.70 software. Wait till the instrument to be initialised properly. Open Spectrum module in software. Wash the cuvettes with distilled water and rinse with the blank solution. Fill the cuvettes ≈ 80% with blank solution & clean it with lint free tissue paper. Place cuvettes in the sample compartment, and click on the Auto Zero button. Select the wavelength (nm) range to run the spectra. Wash and rinse the sample with the sample solution, scan the solution to get absorbance maxima (λmax). Open Photometric module to determine absorbance of the solutions at absorbance maxima (λmax) for each dilution. Calculate the concentration of unknown sample for each dilution
- 7. PRACTICE SCHOOL GROUP -V Page 7 Observation: Table: 3.1Absorbance of Aspirin in ethanol and water Concentration (µg/ml) Absorbance 20 0.142 30 0.248 40 0.434 50 0.537 Unknown Sample 0.068 Calculations: Accordingto Beer-Lambertlaw; A = ɛ c t Where, ɛ and t are constant Let, A1 =the absorbance of standar dsolution of known concentration. A2 = the absorbance of solution of unknown concentration. C1= the concentration of standard solution C2=th econcentration of sample By comparing the above equation for known and unknown samples, the equation can be written as follows, = i.e. C2 = × C1 Consider, C1 =20µg/mlandA1=0.142 C2 = × 20 = 9.577µg/ml Consider, C1 = 30µg/mlandA1=0.248 C2 = × 30 = 8.225µg/ml Consider, C1= 40µg/mlandA1=0.434 C2 = × 40 = 6.267µg/ml Consider, C1= 50µg/mlandA1=0.537 C2 = × 50 = 6.331µg/ml Mean concentration of unknown sample = = 7.60µg/ml Result:
- 8. PRACTICE SCHOOL GROUP -V Page 8 The concentration of unknown sample was found to be 7.60 µg/ml. Conclusion: Determination of concentration of unknown solution using standard solution by UV-Vis Spectrophotometer was done.
- 9. PRACTICE SCHOOL GROUP -V Page 9 Aim: Determination of concentration of unknown sample by using calibration curve method. Reference: Gurdeep R. Chatwal, Sham K. Anand Instrumental Methods of Chemical Analysis, Himalaya Publication Fifth Edition (Reprints 2015), page no.2.1082& 2109 H. Willard - Hobert, L Merritt Jr Lynne John , A, Sttle Jr. Frank, “ Instrumentation Method Of Analysis” CBS Publishers and Distributors ,New Delhi. Requirements: SAMPLE: Paracetamol DILUTION SYSTEM: Methanol and Water (15:85 %v/v) used as diluents. INSTRUMENTATION: SCHIMADZU UV-1780 UV-Visible double beam spectrophotometer with matched quartz cells. Theory: Refer to experiment no. 01 page 1-3 Procedure: I PREPARATION OF STOCK SOLUTION (100ΜG/ML): Weigh accurately about 10 mg aspirin and dissolve it in 10 ml ethanol in 100 ml volumetric flask, make the volume up to 100 ml with distilled water. This gives a solution of concentration 1mg/ml. Dilute 2ml from this solutionin20ml ethanol. This gives a solution of concentration 100µg/ml. PREPARATION OF SAMPLE SOLUTIONS OF DIFFERENT CONCENTRATIONS: Pipette out 1, 2 to 5 ml of stock solution in 10 ml of volumetric flasks & make the volume upto the mark with dilution solution to get 10, 20, to 50 µg/ml respectively. Procedure: II Refer to experiment 02. Observation: Absorbance maxima of Paracetamol in methanol- water : Figure 4.1 : λmax 2.44.40nm nm. 200.00 250.00 300.00 350.00 400.00 Abs. 3.387 3.000 2.000 1.000 0.000 -0.167
- 10. PRACTICE SCHOOL GROUP -V Page 10 Observation Table:4.1 ABSORBANCE OF PARACETAMOL IN METHANOL AND WATER Sr. no. Concentration ( µg/ml ) Absorbance 1 2 0.070 2 4 0.141 3 6 0.161 4 8 0.187 5 10 0.271 6 12 1.158 7 15 1.404 8 20 1.862 9 Unknown 1.695 Calculation:-fig 4.2Determination of unknown concentration by calibration curve method Y = 0.0883 x - 0.1932 0.088 x = 1.695 + 0.193 0.088 x = 1.888 x = 1.888/0.088 x = 21.45 µg/ml Result: Concentration of Unknown sample was found to be 21.45 µg/ml and its absorbance was 1.695. y = 0.111x - 0.4112 R² = 0.8749 -0.5 0 0.5 1 1.5 2 0 10 20 30 absorbance absorbance Linear (absorbance)
- 11. PRACTICE SCHOOL GROUP -V Page 11 Aim: To determine of Absorption maxima of the given sample Reference: Chatwal GR, Anand S (2002) Instrumental Methods of Chemical Analysis. (5th edn), Himalaya Publishing House, New Delhi. Davidson AG (2002) Ultraviolet-visible absorption spectrophotometry. In Beckett AH, Stenlake JB, (4thedn), Practical Pharmaceutical chemistry. CBS Publishers and distributors, New Delhi,275-278. Requirements: GLASSWARE: Beakers, volumetric flasks, pipette, cuvettes CHEMICALS: Metformin, Methanol, Distilled water INSTRUMENT: SHIMADZU1780 SOFTWARE: UV Probe2.70 Theory:Absorption maxima (λmax): The extent to which a sample absorbs light depends on the wavelength of light. The wavelength at which a substance shows maximum absorbance is called Absorption maxima or λmax Procedure: Fill both the cuvettes with the blank (solvent). Clean both the cuvettes with tissue paper and place them in the sample cell such that the blur side faces the user. In the SPECTRUM mode click on AUTO ZERO. This records the absorbance of solvent as 0. Replace the front cuvette with the sample under analysis. Select the wavelength range for UV that is 400nm-200nm and click on START In MAIN MENU select PICK PEAK to select the desired peak wavelength Spectra: Fig. 5.1 Absorption Maxima of Metformin Conclusion: Absorption Maxima (λmax) of Metforminwas found to be 232.6 nm with
- 12. PRACTICE SCHOOL GROUP -V Page 12 absorbance 1.924 OBJECTIVE: - To describe the procedure for handling of UV- Visible Spectrophotometer SCOPE:- The procedure is applicable for single beam spectrophotometer. INSTRUMENT:- Instrument Single beam spectrophotometer Maker Chemito MODEL UV2100 Dr. RafiqZakaria Y.B. Chavan College of Pharmacy, Aurangabad TITLE:- STANDARD OPERATING PROCEDURE FOR HANDLING OF SINGLE BEAM UV- VISIBLE SPECTROPHOTOMETER. Page no. 1 of 3 SOP no. 2 Revision no. 0 DEPARTMENT:- Quality Assurance& Quality control LOCATION:- Chemistry lab DATE:- 25-11-2021 CREATED BY:-roll 99 REVISION BY :- REVIEW DATE:-25-02-2022 LOCATION:- chemistry lab AUTHARISED BY:-
- 13. PRACTICE SCHOOL GROUP -V Page 13 PROCEDURE:- Connect the instrument to power supply . Switch on the main power supply The yellowish light flickers will glow one by one . Check the initialization as- o ROM test o RAM test o Monochromatar o Filter check o Turret check o Optimising W. lamp o Optimising D2 lamp o Lamp Stability after complete initialization is done open the main menu there will be three options, Spectrum mode Photometric mode Select Mode Now open the sample holder lid. There will be 5 cuvette holders as shown below. To the blank using distilled water. Then fill analyte in the cuvette. Select the spectrum mode or photometric mode. To have to find absorbance then select the photometric mode. Then press ESCAPE button. Select the cuvette no. In which the sample was placed. Page no. 2 of 3 SOP no. 2 Revision no. 0
- 14. PRACTICE SCHOOL GROUP -V Page 14 Causion:- 1)always remove silica bag before use of spectrophotometer and put before leaving machine room 2) always fill cuvetts at least 90%. 3) close panel lead before running sample. 4) before putting switch buttons off make sure the system and instrument is off already. 5) wait after startimg the system to warm the source bulbs. Page no. 3 of 3 SOP no. 2 Revision no. 0 CREATED BY :- APPROVED BY:- REVIEWED BY:- AUTHORISED BY :- Shaikh Asif jamil Ms. Barrawaz Aateka Y HOD Dr. JP Sanghshetti Dr. Abubakar Salam Bawazir DATE & SIGNATURE 25-11-2021 BAY JNS ASB
- 15. PRACTICE SCHOOL GROUP -V Page 15 Aim :- Preparation of calibration curve of Metformin. Reference: 1. Gurdeep R. Chatwal, Sham K. Anand Instrumental Methods of Chemical Analysis, Himalaya Publication Fifth Edition(Reprints 2015), page no.2.108 & 2.109 2. United State pharmacopoeia, National formulary-35,2017, 40,4415,4418 http://www.drugs.com/pro/metformin-tablet.html Requirements:- Sample: Metformin Dilution system : distilled water used as diluent Instrumentation: “ CHEMITO ” UV2100 UV - Visible Spectrometer ( single beam) Theory:- Refer previous experiment pege no,13-14 Procedure:- Sampling and Dilution procedure is Same as previous experiments. Operation Procedure:- Turn on the UV- Visible Spectrophotometer. The yellowish light flickers and the instrument starts INISITIALIZATION as under; o ROM test o RAM test o Monochromator o Filter check o Turret check o Optimising w.lamp o Optimising D2 lamp o Lamp stability Open the sample holder lid. Perform the blank spectra using distilled water in photometric mode. Now place the metformin sample in sample holder place the transparent side of cuvette to screw side to pass the light source. Select the photometric mode then select the required wavelength i.e. 276nm for metformin Press escape button. Press the cuvette no in which our sample was placed. Note down the absorbance reading. Observation table:- Table 7.1 Absorbance of metformin in water Sr. No Concentration µg/ml Absorbance 2. 24 2.046 3. 20 1.886 4. 16 1.678 5. 12 1.215 6. 8 0.907 7. 4 0.590
- 16. PRACTICE SCHOOL GROUP -V Page 16 Wavelength = 276 nm Figure :7.1 Calibration curve of metformin Result:- Calibration Curve of Metformin was prepared. 0 0.5 1 1.5 2 2.5 0 10 20 30 Absorbance concentration Absorbance Linear (Absorbance)
- 17. PRACTICE SCHOOL GROUP -V Page 17 Aim:-Comparison of calibration curve prepared using single & beam UV- Visible Spectrophotometer. Reference: 1. Gurdeep R.Chatwal ,Sham K. Anand Instrumental Methods of Chemical Analysis, Himalaya Publication Fifth Edition(Reprints 2015),page no.2.108&2.109 2. United State pharmacopopiea, National formulary- 35,2017,40,4415,4418http://www.drugs.com/pro/metfrmin-tablet.html. Requirements: Sample: Metformin Dilution system: distilled water used as diluent Instrumentation: 1) SCHIMADZU UV-1780 UV-Visible double beam spectrophotometer 2) CHEMITO UV2100 UV - Visible Spectrometer (single beam) Theory:Refer experiment no:3 page 10-12 Procedure:Refer experiment no:3 page 10-12 Observation: ⅄ max276nm Table 8.1: Comparison of absorption by Chemito and Shimadzu Spectrophotometer conc. Abs by CHEMITO Abs by SHIMADZU 4 0.59 0.425 8 0.907 0.741 12 1.215 1.152 16 1.678 1.566 20 1.886 1.924 Figure8.1: Comparison of calibration curve of Metformin by Chemito and Shimadzu Spectrophotometer Result: Comparison of calibration curve prepared using single (CHEMITO)&double (SHIMADZU 1780) beam UV- Visible Spectrophotometer was done. y = 0.0841x + 0.2463 R² = 0.9903 y = 0.0956x + 0.0147 R² = 0.9981 0 0.5 1 1.5 2 2.5 0 5 10 15 20 25 Abs by Chemito Abs by shimadzu Linear (Abs by Chemito) Linear (Abs by shimadzu)
- 18. PRACTICE SCHOOL GROUP -V Page 18 Dr. RafiqZakaria Y.B. Chavan College of Pharmacy, Aurangabad TITLE: - STANDARD OPERATING PROCEDURE FOR HANDLING OF FTIR OBJECTIVE:- To describe the procedure for handling of FTIR. SCOPE:- To design the SOP for operation of FTIR spectrophotometer. INSTRUMENT:- Page no. 1 of 3 SOP no. 3 Revision no. 0 Review Date 22-4-22 Responsibility Barrawaz Ateka Yahiya Accountability HOD OF Q.A.Dept Created by Shaikh Asif Jamil Created date 22/10/2021 Location Machine room Page no. 2 of 3 SOP no. 3
- 19. PRACTICE SCHOOL GROUP -V Page 19 PROCEDURE: Clean the instrument Ensure that the power to the instrument is switched OFF before cleaning Clean the instrument with a clean dry cloth daily. Remove silica bag from it. Ensure that the instrument is properly connected to the power supply. Switch ON the main switch and power switch of the instrument. Switch the computer ON by the switches situated on the right of the monitor and PC respectively. Switch on the instrument, keep it for 5 to 10 mins to get warm. Click on software named ‘spectra manager’ & select collect mode In collect mode select background & put file name or as per your requirement (in case of DRA assembly put KBr powder). Now click on ‘ok collect’ so that it will scan background spectra. After completion of background spectra, put sample pellet (in case of DRA put the mixture of KBr & sample). Again click on collect & select normal, transmittance mode, select scanning range (4000-5000 cm-1 or as per your requirement). Select number of scan. After completion of scanning you will get a spectrum of the actual sample. For peak marking click on view & select ‘peaksfind’ Revision no. 0 Instrument FTIR Maker JASCO MODEL 4100
- 20. PRACTICE SCHOOL GROUP -V Page 20 For comparison with your previous standard just right click on main screen & select overlaid or stacked mode as per your requirement Now open your previous standard spectrum by click on file – open trace. You can also add the data on the screen by right click on the main screen & select add text. Save the data. For Solids (hip method ):- Take pre heated KBR as solvent with sample Take minute amount of sample with spatula mix with KBR in small mortar pestle . Mix sample + KBR. Put it in the cuvette with the pestle. Put the cuvette in the cuvette holder. See the red lazer dot on the sample for reference to the source light. o Save the peak data in word format Caution- 1)always remove silica bag before use of spectrophotometer and put before leaving machine room 2) Always fill cuvettes at least 90%. 3) close panel lead before running sample. 4)before putting switch buttons off make sure the system and instrument is off already. 5) wait after starting the system to warm the source bulbs. Page no. 3 of 3 SOP no. 3 Revision no. 0 CREATED BY :- APPROVED BY:- REVIEWED BY:- AUTHORISED BY :- Shaikh Asif jamil Ms. Barrawaz Aateka Y HOD Dr. JP Sanghshetti Dr. Abubakar Salam Bawazir DATE & SIGNATURE 22-10-2021 BAY JNS ASB
- 21. PRACTICE SCHOOL GROUP -V Page 21 Y.B. Chavan college of pharmacy, Aurangabad TITLE:- calibration of FTIR spectrophotometer OBJECTIVE:- To describe procedure for calibration of FTIR spectrophotometer. SCOPE:- Applicable for calibration of FTIR spectrophotometer. INSTRUMENT:- Instrument FTIR Maker Jasco MODEL 4100 PROCEDURE:- 1) WITH POLYSTYRENE SHEET Open the FTIR panel cover unscrew the cuvette holder. Replace it with polystyrene holding panel with a screw. Put the polystyrene sheet in the holder Click on ‘peak find’, it will give downwards graph peaks of wavenumber v/s %T. Campare the peaks with the standard IP polystyrene peaks If the noise levels are very high minimize it and again click on apply to again measure graph for compare with standard peaks as shown below. Page no. 1 of 3 SOP no. 4 Revision no. 0 Created by Shaikh Asif Jamil Created date 22/10/2021 Location Machine room Review Date 22-4-22 Revision No. Revisor Responsibility Barrawaz Ateka Yahiya Accountability HOD OF Q.A.Dept Page no. 2 of 3 SOP no. 4 Revision no. 0
- 22. PRACTICE SCHOOL GROUP -V Page 22 Fig.10.1 Transmittance wavelength curve for polystyrene if the peak matches it passes the calibration. Wave number and %T values considered are as Table 10.1 Wave length and acceptable tolerance of IR Wave number (cm- 1 ) Acceptable tolerance Percent transmittance value (cm-1 ) Remarks 3060.0 ± 1.0 3059.51 Satisfactory 2849.5 ± 1.0 2849.31 Satisfactory 1601.2 ± 1.0 1600.63 Satisfactory 1583.0 ± 1.0 1583.24 Satisfactory 1154.5 ± 1.0 1154.19 Satisfactory 1028.3 ± 1.0 1027.87 Satisfactory Match wavenumber with %transmittance and calibrate with comparing. PRECAUSIONS:- 1. Use only spectroscopic grade KBR ie dried thoroughly 2. Clean and dry mortar and pestle immediately after use . 3. Polystyrene film should be kept in protecting cover. 4. always remove silica bag before use of spectrophotometer and put before leaving machine room 5. close panel lead before running sample. 6. before putting switch buttons off make sure the system and instrument is off already. 7. wait after starting the system to warm the source bulbs.
- 23. PRACTICE SCHOOL GROUP -V Page 23 Page no. 3 of 3 SOP no. 4 Revision no. 0 CREATED BY :- APPROVED BY:- REVIEWED BY:- AUTHORISED BY :- Shaikh Asif jamil Ms. Barrawaz Aateka Y HOD Dr. JP Sanghshetti Dr. Abubakar Salam Bawazir DATE & SIGNATURE 28-10-2021 BAY JNS ASB
- 24. PRACTICE SCHOOL GROUP -V Page 24 Dr. Rafiq Zakaria Campus YB CHAVAN COLLEGE OF PHARMACY AURANGABAD CALIBRATION OFCHEMITO 2100 AND SHIMADZU 1780 UV VISIBLE SPECTROPHOTOMETER DEPARTMENT: Qualityassurance& Analysis AREA: Instrument room SOP: PS-04 SUPERCEDES: -- Eff. Date:04/12/2021 Review date:04/06/2022 01. Objective:To lay down a procedure for uv spectrophotometer 02. Responsibility:All personnel of Quality Assurance and Analysis Department 03. Accountability:HOD, Quality Assurance and Analysis Department 04. Main features: 4.1 Name of the instrument: UV VISIBLE SPECTROPHOTOMETER 4.2 Instrument serial no. MAET/02/03 4.3 Make and Model: CHEMITO 2100 and SHIMADZU 1780 4.4 Manufacturer: CHEMITO and SHIMADZU 05. Calibration Calibration of UV- VIS spectrophotometer involves: 5.1 Control of Absorbance 5.2 Limit of Stray Light 5.3 Resolution Power 5.4 Cells 5.5 Solvents 5.1 Control of absorbance: 5.2.1 Preparation of Solution A and Solution B: For solution A accurately weigh 57-63 mg of potassium dichromate and dissolve it in 100 ml of 0.005 m Sulphuric acid. From this solution take 1ml and dilute it in 10 ml of 0.005 M Sulphuric acid for solution B. 5.2.2 Fill one cuvette with 0.005 M sulfuric acid 5.2.3 In MAIN MENU click on Key 2 (PHOTOMETRIC) to record the absorbance of blank. 5.2.4Place the solution in sample cell with potassium dichromate solution. 5.2.5 Go to PHOTOMETRIC MODE and determine the absorbance at the first four wavelengths mentioned in Table 1. For solution A 5.2.6 Now determine the absorbance for solution B at 430 nm 5.2.7 Note the absorption maxima of potassium dichromate solution at different wavelengths and calculate the absorbance. 5.2.8 The permitted tolerance is given in the table below. Page no. 1 of 4 SOP no. 5 Revision no. 0
- 25. PRACTICE SCHOOL GROUP -V Page 25 Table 11.1 Standard Absorptivity and maximum tolerance Sr. no Wavelength Maximum Tolerance 1 235 nm 122.9 to 126.2 2 257 nm 142.8 to 146.2 3 313 nm 47.0 to 50.3 4 350 nm 105.6 to 109.0 5 430 nm 15.7 to 16.1 OBSERVATION: table 11.2 Absorbance Value by CHEMITO and SHIMADZU Sr. no Wavelength Observed valueAbsorbance Absorptivity Result By Chemito By Shimadzu By Chemito By Shimadzu By Chemito By Shimadzu 1 235 nm 0.706 0.7410 117.6 123.5 PASS Pass 2 257 nm 0.646 0.8620 107.6 143.5 FAIL Pass 3 313 nm 0.233 0.2890 38.83 48.6 FAIL Pass 4 350 nm 0.391 0.6340 65.16 105.3 FAIL Pass 5 430 nm 0.107 0.9531 17.8 15.8 FAIL Pass 5.2 Limit of Stray Light 5.3.1 Prepare a 1.2 % w/v potassium chloride solution. 5.3.2 Fill water in one cuvette and place it in reference cell and in MAIN MENU click on Key 2 (PHOTOMETRIC MODE) to record the absorbance of blank 5.3.3 Place water in the reference cell and 1.2 % w/v potassium chloride solution in sample cell 2. 5.3.4 Go to PHOTOMETRIC MODE and determine the absorbance of the solution at 200 nm. 5.3.5 The Absorbance at 200 nm must be greater than 2. OBSERVATION: Absorbance at 200 nm: 0.426 Result:Satisfactory 5.3 Resolution power 5.4.1 Prepare a 0.02% v/v solution of toluene in hexane. 5.4.2 Place hexane in the reference cell and in MAIN MENU click on Key 2 Page no. 2 of 4 SOP no. 5 Revision no. 0
- 26. PRACTICE SCHOOL GROUP -V Page 26 (PHOTOMETRIC) to record the absorbance of blank5.4.3Place hexane in the reference cell and toluene in hexane in sample cell 2 5.4.4 Go to SPECTRUM MODE and record the absorbance at 269 nm and 266 nm. 5.4.3 The ratio of absorbance at 269 nm to 266 nm is not less than 1.5 OBSERVATION: table 11.3 Absorbance of n hexane in toulene By Chemito By Shimadzu 1780 n-hexane in toluene 269 nm 1.367 1.660 266 nm 1.602 2.296 Ratio 0.85 1.3 Result NotSatisfactory NotSatisfactory 5.4 Cells 5.4.1Determine the absorbance of air in PHOTOMETRIC MODE by removing the cuvette from the reference cell 5.4.2 Now place an empty cuvette and record its absorbance in PHOTOMETRIC MODE 5.4.3 Determine the ratio of Absorbance of air to Absorbance of cuvette 5.4.4 The tolerance on the path length of the cells used is ± 0.005 cm. OBSERVATION: a) Absorbance of Air b) Absorbance of Cuvette: 0.082 Result: Satisfactory 5.5 Solvents 5.5.1 Take an empty cuvette and place it in the reference cell 5.5.2 In MAIN MENU click on Key 2 (PHOTOMETRIC) and record the absorbance of air at 254 nm 5.5.3 Fill the other cuvette with ethanol and place it in the sample cell 2 and in MAIN MENU click on Key 2 (PHOTOMETRIC)to record the absorbance of ethanol at 254 nm 5.5.4 The absorbance of the reference cell and its contents should not exceed 0.4 and should preferably be less than 0.2 when measured with reference to air at the same wavelength Page no. 3of 4 SOP no. 5 Revision no. 0
- 27. PRACTICE SCHOOL GROUP -V Page 27 5.5.5Precaution:The solvent in the reference cell should be of the same lot as that used to prepare the solution and must be free from fluorescence at the wavelength of measurement. OBSERVATION: table 11.4 Absorbance of ethanol and air By CHEMITO 2100 By SHIMADZU 1780 Absorbance of air 0.273 0.416 Absorbance of ethanol 3.000 3.73 Ratio 0.079 0.11 Result Satisfactory Satisfactory Page no. 1 of 4 SOP no. 5 Revision no. 0 When the instrument does not comply with the requirement/tolerance specified above, the instrument must be labelled ‘OUT OF CALIBRATION’ and must be repaired /serviced. CREATED BY :- APPROVED BY:- REVIEWED BY:- AUTHORISED BY :- Shaikh Asif jamil Ms. Barrawaz Aateka Y HOD Dr. JP Sanghshetti Dr. Abubakar Salam Bawazir DATE & SIGNATURE 26-11-2021 BAY JNS ASB
- 28. PRACTICE SCHOOL GROUP -V Page 28 DR. RAFIQ ZAKARIA CAMPUS YB CHAVAN COLLEGE OF PHARMACYAURANGABAD STANDARD OPERATING PROCEDURE (SOP) AND CALIBRATION OF ELECTRONIC BALANCE DEPARTMENT: Qualityassurance& Analysis AREA: Instrument room SOP: PS-03 Eff. Date:26/11/2021 Review date: 26/05/2022 Rev. No. : - Page no: 1 of 4 01. Objective:To lay down a procedure for Operation ofELECTRONIC BALANCE 02. Responsibility:All personnel of Quality Assurance and Analysis Department 03. Accountability:HOD, Quality Assurance and Analysis Department 04. Main features 4.1 Name of the instrument: ELECTRONIC BALANCE 4.2 Instrument serial no. 4.3 Make and Model: 4.4 Manufacturer: WENSAR Page no. 1 of 3 SOP no. 6 Revision no. 0
- 29. PRACTICE SCHOOL GROUP -V Page 29 Page no. 2 of 3 SOP no. 6 Revision no. 0 05. Precautions: 5.1 Ensure that the weighing platform is clean 5.2 Do not disturb the balance while placing or removing the substance to be weighed 5.3 06. Operation: 6.1 Ensure that the weighing platform is clean 6.2 Turn on the balance and let it warm up until it displays 0.000 6.3 If the value is found to fluctuate press 0/T to bring the reading to 0.000 6.4 Place a clean butter paper on the weighing platform and place the compound to be weighed onto the butter paper 6.5 The units in which the weight has to be determined is selected by pressing the MODE button 6.6 The weight of the compound placed is displayed. 07. Calibration: 7.1 Ensure that the weighing platform is clean 7.2 Turn on the balance and let it warm up until it displays 0.000 7.3 If the value is found to fluctuate press 0/T to bring the reading to 0.000 7.4 Load a standard weight on to the weighing balance 7.5 Determine its weight on the weighing balance 7.6 If the value displayed fluctuates from that of the known value, the issue must be reported to the service engineer and labelled as ‘OUT OF CALIBRATION’
- 30. PRACTICE SCHOOL GROUP -V Page 30 Page no. 3 of 3 SOP no. 6 Revision no. 0 CREATED BY :- APPROVED BY:- REVIEWED BY:- AUTHORISED BY :- Shaikh Asif jamil Ms. Barrawaz Aateka Y HOD Dr. JP Sanghshetti Dr. Abubakar Salam Bawazir DATE & SIGNATURE 26-11-2021 BAY JNS ASB
- 31. PRACTICE SCHOOL GROUP -V Page 31 Dr. Rafiq Zakaria Campus YB CHAVAN COLLEGE OF PHARMACY AURANGABAD TITLE: STANDARD OPERATING PROCEDURE (SOP) AND CALIBRATION COSLAB DIGITAL MELTING POINT APPARATUS Objective: To lay down a procedure for Operation of DIGITAL MELTING POINT apparatus. Responsibility: All personnel of Quality Assurance and Analysis Department Accountability: HOD, Quality Assurance and Analysis Instrument: 1. Name of the instrument: DIGITAL MELTING POINT APPARATUS 2. Instrument serial no. 3. Make and Model: 4. Manufacturer: COSLAB Page no. 1 of 3 SOP no. 7 Revision no. 0 DEPARTMENT: Quality assurance & Analysis AREA: chemistry lab Subject: SOP for handling and calibration of digital mrlting point Eff. Date: 26/11/2021 Review date: 26/05/2022
- 32. PRACTICE SCHOOL GROUP -V Page 32 Precaution: Clean the capillary and check if sealed completely. Operation: 1. Switch on the electric supply and the instrument 2. Switch on the start button 3. Switch on the STIRRER and adjust the speed 4. Seal a capillary in flame and fill the powder whose melting point is to be determined 5. Insert the capillary in the sample holder. 6. Adjust the intensity of the background light such that the inserted capillary as well the powder in it are clearly visible 7. Adjust the temperature using the HEATER control knob Increase the heat initially at higher rate; as the melting point approaches, lower the heating rate to observe the clear melting of solid near its melting temperature range Calibration: 7.1 For boiling point: 1. Fill the sample holder with a liquid of known boiling point for example water 2. Switch on the electric supply and the instrument 3. Switch on the start button 4. Switch on the STIRRER and adjust the speed 5. Adjust the intensity of the background light such that the sample tube as well the liquid in it are clearly visible 6. Adjust the temperature using the HEATER control knob 7. Increase the heat initially at higher rate; as the boiling point approaches, lower the heating rate to observe the clear vaporization of liquid near its boiling temperature range 8. If the boiling point is same as that of the known boiling point of standard liquid; the instrument is calibrated 7.2 For melting point 1. Seal a capillary in flame and fill the powder with known melting point 2. Insert the capillary in the sample holder. 3. Switch on the electric supply and the instrument 4. Switch on the start button 5. Switch on the STIRRER and adjust the speed 6. Adjust the intensity of the background light such that the inserted capillary as well the powder in it are clearly visible 7. Adjust the temperature using the HEATER control knob Page no. 2 of 3 SOP no. 7 Revision no. 0
- 33. PRACTICE SCHOOL GROUP -V Page 33 8. Increase the heat initially at higher rate; as the melting point approaches, lower the heating rate to observe the clear melting of solid near its melting temperature range 9. If the melting point is same as that of the known melting point of standard liquid; the instrument is calibrated. Page no. 3 of 3 SOP no. 7 Revision no. 0 CREATED BY :- APPROVED BY:- REVIEWED BY:- AUTHORISED BY :- Shaikh Asif jamil Ms. Barrawaz Aateka Y HOD Dr. JP Sanghshetti Dr. Abubakar Salam Bawazir DATE & SIGNATURE 26-11-2021 BAY JNS ASB
- 34. PRACTICE SCHOOL GROUP -V Page 34