NetApp powershell performance reporting consists of three things
•
0 likes•321 views

NetApp powershell performance reporting via PS command

Recommended
Recommended
More Related Content
More from Ashwin Pawar
More from Ashwin Pawar (20)
Recently uploaded
Recently uploaded (20)
NetApp powershell performance reporting consists of three things
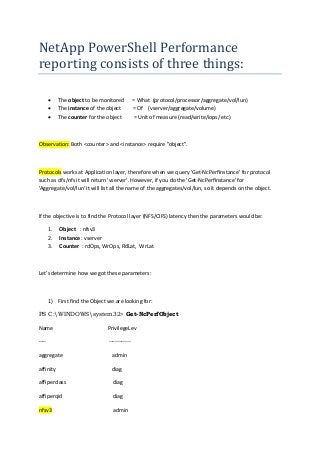
- 1. NetApp PowerShell Performance reporting consists of three things: The object to be monitored = What (protocol/processor/aggregate/vol/lun) The instance of the object = Of (vserver/aggregate/volume) The counter for the object = Unit of measure (read/write/iops/ etc) Observation: Both <counter> and <instance> require "object". Protocols works at Application layer, therefore when we query 'Get-NcPerfInstance' for protocol such as cifs/nfs it will return 'vserver'. However, if you do the 'Get-NcPerfInstance' for 'Aggregate/vol/lun' it will list all the name of the aggregates/vol/lun, so it depends on the object. If the objective is to find the Protocol layer (NFS/CIFS) latency then the parameters would be: 1. Object : nfsv3 2. Instance : vserver 3. Counter : rdOps, WrOps, RdLat, WrLat Let’s determine how we got these parameters: 1) First find the Object we are looking for: PS C:WINDOWSsystem32> Get-NcPerfObject Name PrivilegeLev ---- ------------ aggregate admin affinity diag affiperclass diag affiperqid diag nfsv3 admin
- 2. 2) Determine the Instance of that object: PS C:WINDOWSsystem32> Get-NcPerfInstance -Name nfsv3 Name Uuid ------------ ---- san01 1 san02 2 san03 3 3) Determine the counter for the object: PS C:WINDOWSsystem32> Get-NcPerfCounter -Name nfsv3 rdOps, WrOps, RdLat, WrLat Now, we have all the information that we need to find out nfsv3 latency. PS C:WINDOWSsystem32> Invoke-NcSysstat -Nfsv3 -Name san01 Name rdOps WrOps RdLat WrLat ---- ---- ----- ----- ----- san01 4k 4k 35.4 1.4 san01 6k 5k 25.5 0.9 san01 6k 4k 26.5 1.1 san01 5k 4k 17.7 1.4 PS C:WINDOWSsystem32> Comments: As seen above, nfsv3 will report overall latency at the SVM Level, but in order to pin- point the latency component(s), we will need to dig deeper at the disk/node/network latencies respectively.
- 3. First thing: We need to find out the latency of the specific NFS volume and go from there. Following command will tell you the latency at the volume level. PS C:UsersAshwinp> Invoke-NcSysstat -Volume nfs_data -Vserver san01 Name RdOps WrOps TotOps RdLat WrLat TotLat Read Written ---- ----- ----- ------ ----- ----- ------ ---- ------- nfs_data 9 3 20 16.2 0.1 7.2 69 KB 26 KB nfs_data 1 0 5 23.5 0.0 2.7 5 KB 0 nfs_data 28 4 48 17.0 0.5 10.0 283 KB 69 KB PS C:UsersAshwinp> Conclusion: Nfsv3 protocol latency and NFS volume latency are two different things and it’s important to understand the latency from totality, and then separate each component from another, until we find the root cause. Good news is that, ONTAP 8.3 onwards can help you further in this investigation using a range of QoS commands, which can enable you to narrow-down cluster component which is responsible for the overall slowness. ashwinwriter@gmail.com Sep, 2019