
Recommended
More Related Content
What's hot
What's hot (20)
Similar to Application of ST Radar data for Atmospheric characterization ppt.pdf
Similar to Application of ST Radar data for Atmospheric characterization ppt.pdf (20)
Recently uploaded
Recently uploaded (20)
Application of ST Radar data for Atmospheric characterization ppt.pdf
- 1. Application of ST Radar data for Atmospheric Characterization A Project submitted In partial fulfillment of the requirements for the degree of Master of of Technology in Radio Physics and Electronics Arkadev Kundu (97/RPM/201001) Under the guidance of Prof. ASHIK PAUL Institute of Radio Physics and Electronics University of Calcutta 92 A.P.C ROAD. KOLKATA – 700009 June, 2022 CU STR
- 2. CU STR
- 3. Earth’s Atmosphere • The Earth is surrounded by layers of gases and makes conditions on Earth suitable for living things. • Earth’s atmosphere can be divided into four zones on the basis of thermal characteristics. 1.Troposphere: starts at the Earth's surface and extends up to 10 km. 2.Stratosphere: It resides above the tropopause and extends up to 50 km. 3.Mesosphere: starts just above the Stratopause and extends to about 85 km. 4.Thermosphere: is a region of high temperatures above the Mesosphere. It includes the ionosphere and extends out to several hundred kilometres. CU STR
- 4. Stratosphere Troposphere (ST) Radar for Atmospheric observations • The Stratosphere Troposphere (ST) Radar technique uses sensitive pulsed Doppler radar to study the atmosphere on continuous basis with good height and time resolution. • This radar uses the frequency range 30 - 300 MHz to examine the optically clear atmosphere. • The primary purpose of all ST radar is the measurement of atmospheric winds, associated vertical shears of horizontal winds and various atmospheric turbulence parameters; hence they are termed – “Wind Profilers”. CU STR
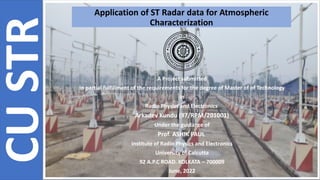
- 5. ST Radar of University of Calcutta at Haringhata • The ST (Stratosphere-Troposphere) radar of University of Calcutta has been placed at Ionospheric Field Station (IFS), Haringhata (22.58°N, 88.38°E) of University of Calcutta in eastern part of India. • This ST radar at IFS, Haringhata has the capabilities of probing the lower atmosphere up to 22 km and the upper atmosphere up to 600 km. Information obtained from the CU ST Radar • Output data- three component wind velocities, Doppler, Doppler width, SNR, Range Time Intensity plot, Range Time Velocity plot, Range Time Doppler spread plot. CU STR
- 6. ST Radar of University of Calcutta at Haringhata CU STR
- 7. Pilot array of University of Calcutta ST Radar • Initially, a 19-element sub array radar was set up at IFS, Haringhata. • This Pilot array was hexagonal in shape. CU STR
- 8. Objectives of the project The main objective of the project is to develop a AI/ML based model to predict various atmospheric parameters using data recorded by the CU ST Radar. • Prediction of atmospheric doppler at various heights, on different radar beams, on different days and at different times of the day. CU STR
- 9. Data & Methodology What data we get from ST Radar ? • The CU-STR Pilot Array data is available in two different formats. 1. Raw data, which is unprocessed. 2. Time series data, which is spectral data. For estimating the wind components, spectral data is used. • The Pilot Radar data are stored as incoherent files which are binary in nature. • incoherent files (.d format) are converted into moment files (.mmt format). • These moment files (.mmt) are converted into ASCII files through Atmospheric Data Processor (ADP) software. Block diagram of deriving wind vectors through ADP software CU STR
- 10. What is in the training dataset for ML model ? • The dataset is created for the ML model from the ASCII files. • Period of data used to train the ML model: 6 months (January, 2020 to June, 2020) • Doppler measured in height with respect to time: 1.35km to 10.2km. • Resolution of the height: 0.15km. • Radar operations per day: around 6 hours. • Resolution of Time: 164 seconds. • Data taken: Date, Time, Height, measured Doppler, Temperature, Pressure, Station Location. CU STR
- 11. Methodology • With this radar, models of various atmospheric parameters, like Doppler (shifting frequency), winds may be developed using measured data over a period of time as training dataset. • Applying this model, the values of the atmospheric parameters will be predicted for a period outside the training interval. • Refinement of the model outputs may help override huge infrastructure and resources necessary for establishing radars. Correlation between CU ST Radar Pilot array and Radiosonde of zonal (U), meridional (V), vertical wind (W), wind speed, and wind direction. This comparison was done so as to gain confidence in the values given by the Pilot radar. Results have now been published [Nandakumar et al., Radio Sci., 2022]. CU STR
- 12. [Nandakumar et al., Radio Sci., 2022]. -10 0 10 20 0 1 2 3 4 5 6 7 8 9 10 U (m/s) Height (km) 10 July 2019 Comparison of Radar Data & GPS RS Data @ 08:30 IST CU STR GPS RS -10 0 10 20 0 1 2 3 4 5 6 7 8 9 10 V (m/s) 0 5 10 15 20 0 1 2 3 4 5 6 7 8 9 10 Wind Speed (m/s) Height (km) 10 July 2019 Comparison of Radar Data & GPS RS Data @ 08:30 IST CU STR GPS RS 0 100 200 300 400 0 1 2 3 4 5 6 7 8 9 10 Wind Direction (deg) Height (km) -2 -1 0 1 2 0 1 2 3 4 5 6 7 8 W (m/s) Height (km) 10 July 2019 Radar Vertical Wind @ 08:30 IST CU STR
- 13. CU STR [Nandakumar et al., Radio Sci., 2022].
- 15. • To create and analyses a mathematical equation representing the relationship between the independent variables height, temperature, pressure with dependent variable Doppler. We use two years data as a training data of the project, but for this semester I only trained one month of February 2020 data. CU STR
- 16. Create ASCII file using ADP software Flowchart of the Foundation work Project CU STR
- 17. Result In this project the ST Radar lower atmosphere data for February 2020 was used to create a data set Next, this dataset is being fed to train a ML model. CU STR
- 18. Table: Predicted Doppler frequency compared with Actual measured Doppler Frequency Because the linear model, that was assume produce large errors, so as a next step Facebook Prophet had use here. User Input Predicted Doppler from ML model Actual Doppler from ST Radar • Height: 9.45km • Temperature: 27C • Pressure: 1014.8mb -0.1800046Hz For East: -0.0829Hz For West: 0.00174Hz For Zenith: 0.0111Hz For North: 1.19Hz For South: 3.12Hz CU STR
- 19. Final work What is Facebook Prophet ? • Prophet is an open source forecasting tool available for python and R. • It is a procedure for forecasting time series data based on an additive model where non-linear trends are fit with yearly, weekly, and daily seasonality. • It works best with time series that have strong seasonal effects and several seasons of historical data. • It is robust to missing data and shifts in the trend, and typically handles outliers well. • Prophet is open source software released by Facebook’s Core Data Science team. CU STR
- 20. Why I use this model ? • Accurate and fast. • Fully automatic. • Tunable forecasts. • Available in R or Python. CU STR
- 21. Flowchart of the Final work Project CU STR
- 22. CU STR Correlation between Predicted Doppler from ML model and Actual measured Doppler from ST Radar. Result
- 23. CU STR 11:00 12:00 13:00 14:00 15:00 16:00 17:00 18:00 -1.6 -1.4 -1.2 -1.0 -0.8 -0.6 -0.4 -0.2 0.0 0.2 0.4 0.6 0.8 Doppler Predicted Doppler Error IST Doppler (Hz) Date: 07-07-2020 Beam: East & Height: 1.35 This peak for interference and turbulance in the atmosphere. Location: CU ST Radar -1000 -800 -600 -400 -200 0 200 400 600 800 1000 Error 11:00 12:00 13:00 14:00 15:00 16:00 17:00 18:00 -1.6 -1.4 -1.2 -1.0 -0.8 -0.6 -0.4 -0.2 0.0 0.2 0.4 0.6 0.8 1.0 Doppler Predicted Doppler Error IST Doppler (Hz) Date: 07-07-2020 Beam: East & Height: 2.7 This peak for interference and turbulance in the atmosphere. Location: CU ST Radar This peak for interference and turbulance in the atmosphere. -1000 -800 -600 -400 -200 0 200 400 600 800 1000 Error 11:00 12:00 13:00 14:00 15:00 16:00 17:00 18:00 -5 -4 -3 -2 -1 0 1 2 3 4 5 Doppler Predicted Doppler Error IST Doppler (Hz) Date: 07-07-2020 Beam: East & Height: 5.1 This peak for interference and turbulance in the atmosphere. Location: CU ST Radar -600 -500 -400 -300 -200 -100 0 100 200 300 400 500 600 Error 11:00 12:00 13:00 14:00 15:00 16:00 17:00 18:00 -5 -4 -3 -2 -1 0 1 2 3 4 5 Doppler Predicted Doppler Error IST Doppler (Hz) Date: 07-07-2020 Beam: East & Height: 7.05 Location: CU ST Radar -100 -80 -60 -40 -20 0 20 40 60 80 100 Error
- 24. CU STR 11:00 12:00 13:00 14:00 15:00 16:00 17:00 18:00 -1.6 -1.2 -0.8 -0.4 0.0 0.4 0.8 1.2 1.6 Doppler Predicted Doppler Error IST Doppler (Hz) Date: 07-07-2020 Beam: West & Height: 1.95 Location: CU ST Radar -400 -300 -200 -100 0 100 200 300 400 Error 11:00 12:00 13:00 14:00 15:00 16:00 17:00 18:00 -1.6 -1.2 -0.8 -0.4 0.0 0.4 0.8 1.2 1.6 Doppler Predicted Doppler Error IST Doppler (Hz) Date: 07-07-2020 Beam: West & Height: 2.85 This peak for interference and turbulance in the atmosphere. Location: CU ST Radar -400 -300 -200 -100 0 100 200 300 400 Error 11:00 12:00 13:00 14:00 15:00 16:00 17:00 18:00 -5 -4 -3 -2 -1 0 1 2 3 4 5 Doppler Predicted Doppler Error IST Doppler (Hz) Date: 07-07-2020 Beam: West & Height: 5.1 This peak for interference and turbulance in the atmosphere. Location: CU ST Radar -400 -300 -200 -100 0 100 200 300 400 Error 11:00 12:00 13:00 14:00 15:00 16:00 17:00 18:00 -5 -4 -3 -2 -1 0 1 2 3 4 5 Doppler Predicted Doppler Error IST Doppler (Hz) Date: 07-07-2020 Beam: West & Height: 7.05 Location: CU ST Radar -100 -80 -60 -40 -20 0 20 40 60 80 100 Error
- 25. CU STR 11:00 12:00 13:00 14:00 15:00 16:00 17:00 18:00 -1.6 -1.2 -0.8 -0.4 0.0 0.4 0.8 1.2 1.6 Doppler Predicted Doppler Error IST Doppler (Hz) Date: 07-07-2020 Beam: Zenith & Height: 1.35 Location: CU ST Radar -400 -300 -200 -100 0 100 200 300 400 Error 11:00 12:00 13:00 14:00 15:00 16:00 17:00 18:00 -1.6 -1.2 -0.8 -0.4 0.0 0.4 0.8 1.2 1.6 Doppler Predicted Doppler Error IST Doppler (Hz) Date: 07-07-2020 Beam: Zenith & Height: 2.4 Location: CU ST Radar -400 -300 -200 -100 0 100 200 300 400 Error 11:00 12:00 13:00 14:00 15:00 16:00 17:00 18:00 -5 -4 -3 -2 -1 0 1 2 3 4 5 Doppler Predicted Doppler Error IST Doppler (Hz) Date: 07-07-2020 Beam: Zenith & Height: 4.05 This peak for interference and turbulance in the atmosphere. Location: CU ST Radar This peak for interference and turbulance in the atmosphere. -400 -300 -200 -100 0 100 200 300 400 Error 11:00 12:00 13:00 14:00 15:00 16:00 17:00 18:00 -5 -4 -3 -2 -1 0 1 2 3 4 5 Doppler Predicted Doppler Error IST Doppler (Hz) Date: 07-07-2020 Beam: Zenith & Height: 5.7 This peak for interference and turbulance in the atmosphere. Location: CU ST Radar -400 -300 -200 -100 0 100 200 300 400 Error
- 26. CU STR 11:00 12:00 13:00 14:00 15:00 16:00 17:00 18:00 -1.6 -1.4 -1.2 -1.0 -0.8 -0.6 -0.4 -0.2 0.0 0.2 0.4 0.6 0.8 1.0 Doppler Predicted Doppler Error IST Doppler (Hz) Date: 08-07-2020 Beam: East & Height: 1.5 Location: CU ST Radar This peak for interference and turbulance in the atmosphere. -1000 -800 -600 -400 -200 0 200 400 600 800 1000 Error 11:00 12:00 13:00 14:00 15:00 16:00 17:00 18:00 -1.6 -1.4 -1.2 -1.0 -0.8 -0.6 -0.4 -0.2 0.0 0.2 0.4 0.6 0.8 1.0 Doppler Predicted Doppler Error IST Doppler (Hz) Date: 08-07-2020 Beam: East & Height: 2.25 Location: CU ST Radar -1000 -800 -600 -400 -200 0 200 400 600 800 1000 Error 11:00 12:00 13:00 14:00 15:00 16:00 17:00 18:00 -5 -4 -3 -2 -1 0 1 2 3 4 5 Doppler Predicted Doppler Error IST Doppler (Hz) Date: 08-07-2020 Beam: East & Height: 5.1 This peak for interference and turbulance in the atmosphere. Location: CU ST Radar -600 -500 -400 -300 -200 -100 0 100 200 300 400 500 600 Error 11:00 12:00 13:00 14:00 15:00 16:00 17:00 18:00 -5 -4 -3 -2 -1 0 1 2 3 4 5 Doppler Predicted Doppler Error IST Doppler (Hz) Date: 08-07-2020 Beam: East & Height: 6.15 Location: CU ST Radar This peak for interference and turbulance in the atmosphere. -600 -500 -400 -300 -200 -100 0 100 200 300 400 500 600 Error
- 27. CU STR 11:00 12:00 13:00 14:00 15:00 16:00 17:00 18:00 -5 -4 -3 -2 -1 0 1 2 3 4 5 Doppler Predicted Doppler Error IST Doppler (Hz) Date: 08-07-2020 Beam: West & Height: 1.95 Location: CU ST Radar -400 -300 -200 -100 0 100 200 300 400 Error 11:00 12:00 13:00 14:00 15:00 16:00 17:00 18:00 -5 -4 -3 -2 -1 0 1 2 3 4 5 Doppler Predicted Doppler Error IST Doppler (Hz) Date: 08-07-2020 Beam: West & Height: 2.85 This peak for interference and turbulance in the atmosphere. Location: CU ST Radar -400 -300 -200 -100 0 100 200 300 400 Error 11:00 12:00 13:00 14:00 15:00 16:00 17:00 18:00 -5 -4 -3 -2 -1 0 1 2 3 4 5 Doppler Predicted Doppler Error IST Doppler (Hz) Date: 08-07-2020 Beam: West & Height: 5.1 Location: CU ST Radar -200 -150 -100 -50 0 50 100 150 200 Error 11:00 12:00 13:00 14:00 15:00 16:00 17:00 18:00 -5 -4 -3 -2 -1 0 1 2 3 4 5 Doppler Predicted Doppler Error IST Doppler (Hz) Date: 08-07-2020 Beam: West & Height: 8.1 This peak for interference and turbulance in the atmosphere. Location: CU ST Radar -100 -80 -60 -40 -20 0 20 40 60 80 100 Error
- 28. CU STR 11:00 12:00 13:00 14:00 15:00 16:00 17:00 18:00 -1.6 -1.2 -0.8 -0.4 0.0 0.4 0.8 1.2 1.6 Doppler Predicted Doppler Error IST Doppler (Hz) Date: 08-07-2020 Beam: Zenith & Height: 1.35 Location: CU ST Radar -400 -300 -200 -100 0 100 200 300 400 Error 11:00 12:00 13:00 14:00 15:00 16:00 17:00 18:00 -1.6 -1.2 -0.8 -0.4 0.0 0.4 0.8 1.2 1.6 Doppler Predicted Doppler Error IST Doppler (Hz) Date: 08-07-2020 Beam: Zenith & Height: 2.4 Location: CU ST Radar -400 -300 -200 -100 0 100 200 300 400 Error 11:00 12:00 13:00 14:00 15:00 16:00 17:00 18:00 -14 -12 -10 -8 -6 -4 -2 0 2 4 6 8 10 12 14 Doppler Predicted Doppler Error IST Doppler (Hz) Date: 08-07-2020 Beam: Zenith & Height: 4.05 Location: CU ST Radar This peak for interference and turbulance in the atmosphere. -400 -300 -200 -100 0 100 200 300 400 Error 11:00 12:00 13:00 14:00 15:00 16:00 17:00 18:00 -15 -12 -9 -6 -3 0 3 6 9 12 15 Doppler Predicted Doppler Error IST Doppler (Hz) Date: 08-07-2020 Beam: Zenith & Height: 5.7 This peak for interference and turbulance in the atmosphere. Location: CU ST Radar -400 -300 -200 -100 0 100 200 300 400 Error
- 29. CU STR 11:00 12:00 13:00 14:00 15:00 16:00 17:00 18:00 -1.6 -1.4 -1.2 -1.0 -0.8 -0.6 -0.4 -0.2 0.0 0.2 0.4 0.6 0.8 1.0 Doppler Predicted Doppler Error IST Doppler (Hz) Date: 20-07-2020 Beam: East & Height: 1.95 This peak for interference and turbulance in the atmosphere. Location: CU ST Radar -1000 -800 -600 -400 -200 0 200 400 600 800 1000 Error 11:00 12:00 13:00 14:00 15:00 16:00 17:00 18:00 -5 -4 -3 -2 -1 0 1 2 3 4 5 Doppler Predicted Doppler Error IST Doppler (Hz) Date: 20-07-2020 Beam: East & Height: 4.05 Location: CU ST Radar -40 -30 -20 -10 0 10 20 30 40 Error 11:00 12:00 13:00 14:00 15:00 16:00 17:00 18:00 -5 -4 -3 -2 -1 0 1 2 3 4 5 Doppler Predicted Doppler Error IST Doppler (Hz) Date: 20-07-2020 Beam: East & Height: 5.55 This peak for interference and turbulance in the atmosphere. Location: CU ST Radar -60 -50 -40 -30 -20 -10 0 10 20 30 40 50 60 Error 11:00 12:00 13:00 14:00 15:00 16:00 17:00 18:00 -5 -4 -3 -2 -1 0 1 2 3 4 5 Doppler Predicted Doppler Error IST Doppler (Hz) Date: 20-07-2020 Beam: East & Height: 6.45 This peak for interference and turbulance in the atmosphere. Location: CU ST Radar -60 -50 -40 -30 -20 -10 0 10 20 30 40 50 60 Error
- 30. CU STR 11:00 12:00 13:00 14:00 15:00 16:00 17:00 18:00 -5 -4 -3 -2 -1 0 1 2 3 4 5 Doppler Predicted Doppler Error IST Doppler (Hz) Date: 20-07-2020 Beam: West & Height: 3.45 Location: CU ST Radar -60 -50 -40 -30 -20 -10 0 10 20 30 40 50 60 Error 11:00 12:00 13:00 14:00 15:00 16:00 17:00 18:00 -5 -4 -3 -2 -1 0 1 2 3 4 5 Doppler Predicted Doppler Error IST Doppler (Hz) Date: 20-07-2020 Beam: West & Height: 5.1 This peak for interference and turbulance in the atmosphere. Location: CU ST Radar -60 -50 -40 -30 -20 -10 0 10 20 30 40 50 60 Error 11:00 12:00 13:00 14:00 15:00 16:00 17:00 18:00 -10 -8 -6 -4 -2 0 2 4 6 8 10 Doppler Predicted Doppler Error IST Doppler (Hz) Date: 20-07-2020 Beam: West & Height: 7.2 This peak for interference and turbulance in the atmosphere. Location: CU ST Radar -100 -80 -60 -40 -20 0 20 40 60 80 100 Error 11:00 12:00 13:00 14:00 15:00 16:00 17:00 18:00 -20 -16 -12 -8 -4 0 4 8 12 16 20 Doppler Predicted Doppler Error IST Doppler (Hz) Date: 20-07-2020 Beam: West & Height: 10.05 This peak for interference and turbulance in the atmosphere. Location: CU ST Radar -100 -80 -60 -40 -20 0 20 40 60 80 100 Error
- 31. CU STR 11:00 12:00 13:00 14:00 15:00 16:00 17:00 18:00 -1.6 -1.2 -0.8 -0.4 0.0 0.4 0.8 1.2 1.6 Doppler Predicted Doppler Error IST Doppler (Hz) Date: 20-07-2020 Beam: Zenith & Height: 1.5 Location: CU ST Radar This peak for interference and turbulance in the atmosphere. -400 -300 -200 -100 0 100 200 300 400 Error 11:00 12:00 13:00 14:00 15:00 16:00 17:00 18:00 -5 -4 -3 -2 -1 0 1 2 3 4 5 Doppler Predicted Doppler Error IST Doppler (Hz) Date: 20-07-2020 Beam: Zenith & Height: 2.4 Location: CU ST Radar -400 -300 -200 -100 0 100 200 300 400 Error 11:00 12:00 13:00 14:00 15:00 16:00 17:00 18:00 -5 -4 -3 -2 -1 0 1 2 3 4 5 Doppler Predicted Doppler Error IST Doppler (Hz) Date: 20-07-2020 Beam: Zenith & Height: 4.05 Location: CU ST Radar -400 -300 -200 -100 0 100 200 300 400 Error 11:00 12:00 13:00 14:00 15:00 16:00 17:00 18:00 -15 -12 -9 -6 -3 0 3 6 9 12 15 Doppler Predicted Doppler Error IST Doppler (Hz) Date: 20-07-2020 Beam: Zenith & Height: 5.7 Location: CU ST Radar This peak for interference and turbulance in the atmosphere. -600 -500 -400 -300 -200 -100 0 100 200 300 400 500 600 Error
- 32. CU STR 11:00 12:00 13:00 14:00 15:00 16:00 17:00 18:00 -1.6 -1.2 -0.8 -0.4 0.0 0.4 0.8 1.2 1.6 Doppler Predicted Doppler Error IST Doppler (Hz) Date: 21-07-2020 Beam: East & Height: 1.95 This peak for interference and turbulance in the atmosphere. Location: CU ST Radar -100 -80 -60 -40 -20 0 20 40 60 80 100 Error 11:00 12:00 13:00 14:00 15:00 16:00 17:00 18:00 -3.0 -2.5 -2.0 -1.5 -1.0 -0.5 0.0 0.5 1.0 1.5 2.0 2.5 3.0 Doppler Predicted Doppler Error IST Doppler (Hz) Date: 21-07-2020 Beam: East & Height: 3.9 This peak for interference and turbulance in the atmosphere. Location: CU ST Radar -20 -15 -10 -5 0 5 10 15 20 Error 11:00 12:00 13:00 14:00 15:00 16:00 17:00 18:00 -5 -4 -3 -2 -1 0 1 2 3 4 5 Doppler Predicted Doppler Error IST Doppler (Hz) Date: 21-07-2020 Beam: East & Height: 5.1 Location: CU ST Radar -20 -15 -10 -5 0 5 10 15 20 Error 11:00 12:00 13:00 14:00 15:00 16:00 17:00 18:00 -10 -8 -6 -4 -2 0 2 4 6 8 10 Doppler Predicted Doppler Error IST Doppler (Hz) Date: 21-07-2020 Beam: East & Height: 7.05 This peak for interference and turbulance in the atmosphere. Location: CU ST Radar -60 -50 -40 -30 -20 -10 0 10 20 30 40 50 60 Error
- 33. CU STR 11:00 12:00 13:00 14:00 15:00 16:00 17:00 18:00 -5 -4 -3 -2 -1 0 1 2 3 4 5 Doppler Predicted Doppler Error IST Doppler (Hz) Date: 21-07-2020 Beam: West & Height: 2.7 Location: CU ST Radar -100 -80 -60 -40 -20 0 20 40 60 80 100 Error 11:00 12:00 13:00 14:00 15:00 16:00 17:00 18:00 -10 -8 -6 -4 -2 0 2 4 6 8 10 Doppler Predicted Doppler Error IST Doppler (Hz) Date: 21-07-2020 Beam: West & Height: 3.6 This peak for interference and turbulance in the atmosphere. Location: CU ST Radar -100 -80 -60 -40 -20 0 20 40 60 80 100 Error 11:00 12:00 13:00 14:00 15:00 16:00 17:00 18:00 -5 -4 -3 -2 -1 0 1 2 3 4 5 Doppler Predicted Doppler Error IST Doppler (Hz) Date: 21-07-2020 Beam: West & Height: 5.4 This peak for interference and turbulance in the atmosphere. Location: CU ST Radar -100 -80 -60 -40 -20 0 20 40 60 80 100 Error 11:00 12:00 13:00 14:00 15:00 16:00 17:00 18:00 -10 -8 -6 -4 -2 0 2 4 6 8 10 Doppler Predicted Doppler Error IST Doppler (Hz) Date: 21-07-2020 Beam: West & Height: 7.95 This peak for interference and turbulance in the atmosphere. Location: CU ST Radar -20 -15 -10 -5 0 5 10 15 20 Error
- 34. CU STR 11:00 12:00 13:00 14:00 15:00 16:00 17:00 18:00 -1.0 -0.8 -0.6 -0.4 -0.2 0.0 0.2 0.4 0.6 0.8 1.0 Doppler Predicted Doppler Error IST Doppler (Hz) Date: 21-07-2020 Beam: Zenith & Height: 1.35 Location: CU ST Radar -600 -500 -400 -300 -200 -100 0 100 200 300 400 500 600 Error 11:00 12:00 13:00 14:00 15:00 16:00 17:00 18:00 -1.6 -1.2 -0.8 -0.4 0.0 0.4 0.8 1.2 1.6 Doppler Predicted Doppler Error IST Doppler (Hz) Date: 21-07-2020 Beam: Zenith & Height: 2.4 Location: CU ST Radar This peak for interference and turbulance in the atmosphere. -400 -300 -200 -100 0 100 200 300 400 Error 11:00 12:00 13:00 14:00 15:00 16:00 17:00 18:00 -10 -8 -6 -4 -2 0 2 4 6 8 10 Doppler Predicted Doppler Error IST Doppler (Hz) Date: 21-07-2020 Beam: Zenith & Height: 4.05 Location: CU ST Radar This peak for interference and turbulance in the atmosphere. -600 -500 -400 -300 -200 -100 0 100 200 300 400 500 600 Error 11:00 12:00 13:00 14:00 15:00 16:00 17:00 18:00 -5 -4 -3 -2 -1 0 1 2 3 4 5 Doppler Predicted Doppler Error IST Doppler (Hz) Date: 21-07-2020 Beam: Zenith & Height: 5.7 Location: CU ST Radar -1000 -800 -600 -400 -200 0 200 400 600 800 1000 Error
- 35. Distribution of Relative error with respect to time 1.35 2.7 4.05 5.4 6.75 8.1 9.45 -10 -8 -6 -4 -2 0 2 4 6 8 10 11:06:57 11:15:08 11:23:20 11:31:31 11:39:43 11:47:54 11:56:06 12:04:17 12:12:29 12:20:41 12:28:52 12:37:03 12:45:15 12:53:27 13:01:38 13:09:49 13:18:01 13:26:13 13:34:24 13:42:36 13:50:47 13:58:59 14:07:11 14:15:22 14:23:34 14:31:45 14:39:57 14:48:08 14:56:19 15:04:31 15:12:43 15:20:54 15:29:05 15:37:17 15:45:29 15:53:40 16:01:52 16:10:03 16:18:14 16:26:26 16:34:38 16:42:50 16:51:01 16:59:13 17:07:24 07-07-2020, Beam- East -10--8 -8--6 -6--4 -4--2 -2-0 0-2 2-4 4-6 6-8 8-10
- 36. 1.35 2.7 4.05 5.4 6.75 8.1 9.45 -10 -8 -6 -4 -2 0 2 4 6 8 10 11:02:52 11:11:03 11:19:15 11:27:27 11:35:38 11:43:50 11:52:01 12:00:13 12:08:24 12:16:36 12:24:47 12:32:59 12:41:10 12:49:22 12:57:33 13:05:45 13:13:57 13:22:08 13:30:19 13:38:31 13:46:43 13:54:54 14:03:06 14:11:17 14:19:29 14:27:40 14:35:52 14:44:03 14:52:14 15:00:26 15:08:38 15:16:49 15:25:01 15:33:12 15:41:24 15:49:35 15:57:47 16:05:58 16:14:10 16:22:21 16:30:33 16:38:45 16:46:56 16:55:08 17:03:19 17:11:31 17:19:42 17:27:54 17:36:05 08-07-2020, Beam- East -10--8 -8--6 -6--4 -4--2 -2-0 0-2 2-4 4-6 6-8 8-10
- 42. -2 -1 0 1 2 3 4 5 0 2 4 6 8 10 12 07-07-2020, Beam- EAST Median Error Distribution of Relative error with respect to height Height beams (km) Height beams (km) Error (Hz) Error (Hz)
- 43. -14 -12 -10 -8 -6 -4 -2 0 2 4 6 0 2 4 6 8 10 12 08-07-2020, Beam- EAST MEDIAN ERROR Height beams (km) Error (Hz) Height beams (km) Error (Hz)
- 44. -2 -1 0 1 2 3 4 5 0 2 4 6 8 10 12 08-07-2020, Beam- WEST Median Error Height beams (km) Height beams (km) Error (Hz) Error (Hz)
- 45. -0.5 0 0.5 1 1.5 2 2.5 3 3.5 4 4.5 0 2 4 6 8 10 12 20-07-2020, Beam- WEST Standard Deviation Height beams (km) Height beams (km) Error (Hz) Error (Hz)
- 46. -3 -2 -1 0 1 2 3 4 5 6 0 2 4 6 8 10 12 20-07-2020, Beam- EAST Median Error Height beams (km) Height beams (km) Error (Hz) Error (Hz)
- 47. -0.5 0 0.5 1 1.5 2 2.5 0 2 4 6 8 10 12 21-07-2020, Beam- EAST Median Error Height beams (km) Height beams (km) Error (Hz) Error (Hz)
- 48. Conclusion and Future work • Development of this model is not complete as evident from the errors between the measured and the model values. In future, data covering a longer period may be used to train the ML model. The predicted Doppler obtained from this model will then be validated with actual observations to test the performance of this model. • The differences occurring between measured data and model data could be arising because of lack of inclusion of time (for diurnal variations), day of year (for seasonal effects) and point of scattering (for spatial variations) in the present version. These needs to be included. • The error values between measured and model Doppler values have been truncated to ±10Hz to eliminate the spikes in Doppler attributed to interference and flight of airplanes over the radar area. • The standard deviation and median values of the relative error are less at higher height (>7km) than at lower heights. • The initial version of the model was created using linear regression. But Doppler does not have a linear relationship with the height, temperature and pressure, which was taken into account in FB Prophet. CU STR
- 49. References • Mohanakumar, K., Straosphere- 1 roposphere Interaction: Au Introduction, Science & Business Media, 2010. Springer https://doi.org/10.1007/978-1- 4020-8217-7 • UCAR Center for science education article on Layers of Earth’s Atmosphere https://scied.ucar.edu/learning-zone/atmosphere/layers-earths-atmosphere • Geeks for Geeks article on ML https://www.geeksforgeeks.org/machine- learning/ • Holton J.R., Haynes P.H., McIntyre E.M., Douglass. R.A., Rood B.R. and Pfister L., Stratosphere-troposphere exchange, 1995, https://acd- ext.gsfc.nasa.gov/People/Douglass/95RG02097.pdf • Skolnik, Introduction to Radar Systems • Machine Learning https://certes.co.uk/types-of-artificial-intelligence-a- detailed-guide/ CU STR
- 50. Thank You CU STR