Electricity market strategies applied to microgrid development
The Brazilian Conundrum_ More Hydropower, Greater Greenhouse Gas Emissions
1. The Brazilian Conundrum: More Hydropower, Greater Greenhouse Gas Emissions
by
Antonio Oliveira*, Tatiana Lauria, Cristiano Prado
Federation of Industries of the State of Rio de Janeiro - FIRJAN System
Av. Graça Aranha 1, Centro, Rio de Janeiro, RJ 20.030-002
*Corresponding author. Phone: 55 21 2563-4685 / E-mail: aajunior@firjan.org.br
Abstract
This paper examines the current structural change in the Brazilian electric power grid
and estimates the costs arising therefrom in the form of CO2 emissions. This change
has its roots in the strategy adopted in recent years of directing the expansion of the
power system largely to the Brazilian North; the new frontier of the hydraulic grid.
Particularities of the region, however, limit considerably the size of the reservoirs,
and, therefore, the amount of energy they store in the form of water. These
circumstances will translate into the decoupling between the expansion of the grid’s
storage capacity and the electricity demand, thus reducing the system’s security and
reliability. As a result, thermopower previously used only as backup will increasingly
be employed to supply base-load demand yearlong. Owing primarily to this
phenomenon, the authors estimate that the Brazilian grid will become over twice as
carbon intensive until 2022 as of recent years. Although this process will produce a
limited impact from an international outlook regarding the CO2 emissions in the
period, it is the authors’ understanding that it merits further investigation as it may
reach significant volumes in later decades.
1 Introduction
The early 21st
century has witnessed the increasing role of sustainable development
concerns in the international political agenda, as testified by important conferences such as
COP and Rio+20. Prominent among these concerns are energy-related environmental issues,
particularly in regard to greenhouse gas (GHG) emissions from electricity and heat
generation, which account for more than 40% of the global carbon dioxide (CO2) output.
Answering for a significant contribution to this statistic are the major economies, which rely
heavily on fossil fuels – one exception being France, due to its extensive use of nuclear
energy, and, another, Brazil.
2. 2
The Brazilian electric power grid is historically hallmarked by a significant presence
of renewable energy sources, in particular hydropower. In effect, hydropower alone
accounted for nearly 90% of the grid’s generation from 2001 to 2012, casting therefore all
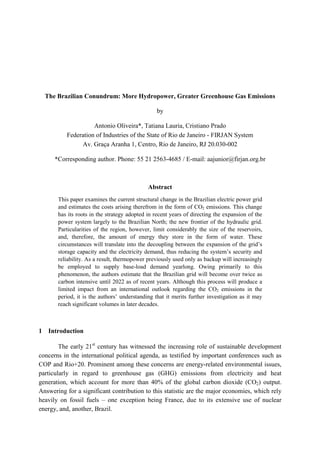
other sources on a complementary part. At a time when fossil fuels are responsible for over
two thirds of the world electricity production, Brazil stands in the spotlight among the leading
economies as the sole country where renewables cater for nearly all of the system’s output, as
shown in Figure 1.
Figure 1: Share of Renewables in Electricity Generation in the Leading Economies
Notes: i) Figures refer to 2011. ii) In Brazil, renewables include
hydropower, wind and biomass (chiefly sugarcane bagasse).
Source: Brazil: The authors, based on data from Operador
Nacional do Sistema Elétrico - ONS. Other countries:
International Energy Agency - IEA website.
In respect to the future, with over 60% of Brazil’s technical and economic hydraulic
potential still available, it is only consequent that the capacity currently programmed to be
added to the grid will come mostly from hydropower. At a casual glance this might seem a
positive prospect; a closer look, however, will reveal that the historic capital presence of
hydroelectricity may in fact shrink expressively in the coming years, bringing, as a result, a
larger share of other sources in the generation mix, including fossil fuels.
This grim outlook is due to the strategy adopted in recent years (roughly around the
turn of this century) to direct the expansion of the electric power system largely to the
Brazilian North; the new frontier of the hydraulic grid. Particularities of the region, however,
impose significant challenges for the production of electricity.
As further explained in following sections, this process will represent a significant
structural change in the Brazilian grid as it will become progressively vulnerable to droughts
and, therefore, subject to the generation from fossil sources in order to ensure an adequate
supply of electricity. In fact, the episode that broke out in 2012, when the reservoirs ebbed to
historically low levels and the share of fossil fuels in the generation mix nearly triplicated,
represented the first symptoms of this “silent” change, one that had been years in the coming.
The social, economic and environmental impacts arising from the growth of
thermopower output from fossils in the energy mix is quite challenging a task to specify and
91%
29%
22%
17% 17% 16% 13% 13% 13% 11%
0%
20%
40%
60%
80%
100%
Brazil
Italy
Germany
India
China
Russia
Japan
United
States
France
United
Kingdom
average excluding
Brazil: 16%
3. 3
quantify with any approach to completeness. In this respect, this paper contributes to the
discussion with an estimate of such impacts as those related to the emissions of GHG, in
particular those in the form of CO2, which, undoubtedly, represent an indispensable part of
any comprehensive study devoted to the influences of the power grid upon the environment
and the society.1
It is the authors’ understanding that the magnitude of the future increase in GHG
output due to the structural change in the Brazilian electricity system is presently deficient in
a proper assessment; a gap that this paper aims to fill. From a similar perception, the authors
address also the impact of such emissions from an international outlook, certain that the
results are such as to warrant acknowledgement and consideration from the international
community.
The remainder of this paper is arranged as follows. The ensuing section describes
briefly the Brazilian grid, particularly in regard to its future development. The third section
explains the structural change in Brazil and identifies its main implications. Section 4
provides context upon which is based the set of hypothesis that underpins the estimates
presented in section 5. The last section concludes.
2 The Expansion of Brazil’s Electric Grid: More Hydropower
The development of the Brazilian power grid is closely associated with the
employment of hydrographic basins for the production of electricity. The significant potential
of the national basins, in addition to their distribution in the territory, permitted not only a
widespread adoption of hydroelectric plants, but their construction near the main consumer
markets, such as the ones in the South and Southeast (more specifically, São Paulo and Rio
de Janeiro). As demand grew, however, new plants were gradually built in the other regions,
the North being the most recent to harbor the expansion of hydropower.
Hydropower is nowadays expressively present throughout Brazil, being the grid’s
backbone. In this context, all regions of the country are connected to each other, and integrate
what is called the National Interconnected System. The importance of this arrangement lies in
the fact that it allows the operation of the Brazilian grid as one single system, which is
particularly important (almost imperative) in view of the different water flow regimes among
the regions. In this sense, hydroelectricity which is produced in one region with abundant
inflows may be transported to another that is suffering a drought2
, thus avoiding the need of
production from local backup thermal plants.
The installed generation capacity in the Brazilian grid in 2013 was 129,452 MW; 69%
of which belonged to hydropower. Regarding the near future, the capacity currently expected
to be added to the grid from 2014 to 2022 will amount to 53,601 MW, with 33,087 MW, that
is, close to 60%, coming from hydropower (roughly equivalent to Argentina’s total capacity
1
According to data from the United Nations Framework Convention on Climate Change, CO2
accounts for about 99% of GHG output from electricity and heat production in Annex I parties.
2
In Brazil, the drought season historically extends from May to November, the exception being the
Southern region, where this season is usually experienced from December to May.
4. 4
in 2011). This clearly indicates that the Brazilian system will remain primarily supported by
hydroelectricity for many years to come.
A major share of this new hydropower, however, will be concentrated in the Northern
region, following the pattern established in recent years. In fact, the three major hydro plants
recently green lighted – Belo Monte (11,233 MW), Jirau (3,750 MW) and Santo Antônio
(3,568 MW) – are located in the region. From the current projects expected to start operation
from 2018 to 2022, for instance, no less than 87% of their installed capacity will be located in
the North, which will add 17,359 MW to the grid.
The predominant presence of the hydropower expansion in the North is directly
associated with the significant potential available in the region. From the 139 thousand MW
currently available countrywide, nearly half is to be found in the North.
The current state of affairs in Brazil corroborates the conclusion that the expansion of
the hydropower system predominantly in the North will likely continue in the coming
decades. In this sense, it is important to observe that, notwithstanding its great potential,
concerns regarding the impacts of hydro plants upon the biodiversity and the native
population of the Amazon rainforest limit considerably the size of reservoirs and, therefore,
the amount of energy they store in the form of water. Furthermore, the low relief of the North
offers limited conditions for the construction of large reservoirs, particularly in regard to
those that allow the regularization of output for extended periods of time, also known as
storage reservoirs.
The development of the hydropower grid will thus be largely supported, as in
previous years, by run-of-river plants, whose regularization capacity does not exceed the
length of a few weeks. In brief, this all translates into a significant structural change in the
Brazilian electric power system, one that in fact has already been in course for years, as
explained in the following section.
3 The Decline of the Regularization Capacity of Brazil’s Electric Power Grid
As a direct result of the expansion of the Brazilian grid via mainly run-of-river
schemes, there will be an increasing mismatch between the evolution of the reservoirs storage
capacity and the demand for electricity, which is expected to continue in an upward trend in
the ensuing years. Consequently, the regularization capacity of the power grid, defined as the
length of time in which all the system’s reservoirs, if 100% full, could supply the entire
demand without the need for generation from complementary sources, will suffer a
continuous decline, reducing thus the system’s security and reliability.
The previous years have already witnessed a gradual decline of the regularization
capacity of the Brazilian grid.3
In 2001, for instance, the regularization capacity was of 6.27
months. In 2013, however, the regularization capacity had decreased to 4.81 months; nearly a
quarter less than that of 2001.
3
While the grid’s storage capacity expanded 22% from 2001 to 2013, electricity demand rose 59% in
the intervening years.
5. 5
Regardless of the gradual decline of the regularization capacity observed in previous
years, the decoupling between the expansion of the grid’s storage capacity and electricity
demand is expected to accelerate in the near future. Indeed, based on official government
data, the authors estimate that the regularization capacity will shrink to 3.30 months in 2022;
a 31% drop when compared to 2013 and a near 50% fall from 2001, as shown in Figure 2.4
Figure 2: Evolution of the Regularization Capacity of the Brazilian Grid
* Estimate.
Source: the authors, based on data from Empresa de Pesquisa
Energética - EPE (2013) and ONS.
The regularization capacity of the power system is an important index in the planning
of the grid operation. However, considering the fact that it is highly unlikely to have all the
grid’s reservoirs 100% full at any given moment, it seems appropriate to gauge the
regularization capacity from the actual levels verified in the reservoirs for a particular
demand. To this new index the authors will refer from this point onwards as “effective
regularization capacity”.
From 2002 to 2012, for instance, the system’s reservoirs were at an average of 66.6%
of their capacity, being 88.8% the maximum level they ever reached in the intervening years.
As displayed in Table 1, with the reservoirs at 66.6%, the effective regularization capacity
declined from 4.18 months in 2001 to 3.20 months in 2013, being estimated to reach 2.20
months in 2022. A particularly telling insight this approach offers is the fact that, in 2022,
even if the reservoirs were to reach the highest level verified in the previous twelve years
(namely, 88.8%), the effective regularization capacity would then be merely 2.93 months,
that is, lower than that of 2013 with the reservoirs at the average 66.6%.
4
According to EPE (2013), the grid’s storage capacity will grow 2% from 2013 to 2022 while
electricity demand will increase 43% in the same period.
6.27
5.87
5.48
5.17
4.81
3.30
0
1
2
3
4
5
6
7
2001 2004 2007 2010 2013 2022*
months
6. 6
Table 1: Effective Regularization Capacity in Selected Years
Source: Ibid.
As stated in the Introduction, the decline of the regularization capacity of the
Brazilian grid will result in a greater share of generation from other sources. Renewables
such as biomass and wind, for instance, are by default considered as the first options by virtue
of being comparatively less expensive than the other sources and environmentally friendly. In
fact, their installed capacity is expected to grow significantly in the coming years. However,
due to their low capacity factors, the contribution of wind and biomass plants to the grid can
only be fairly limited, being therefore unable to face on their own the challenge of supplying
the future growth of electricity demand in Brazil.
Regarding conventional base-load technologies, nuclear power provides not only
flexibility but reduced carbon output. The unexpressive presence of thermonuclear plants in
Brazil, in addition to the country’s substantial uranium reserves, makes this source an option
for providing security and reliability to the grid. The present likelihood of a wider use of
uranium for electricity purposes in Brazil in the near future is slim, however, given the lead
time required for the construction of plants and the taboos that surround the issue.
Under these circumstances, the role of fossil fuels in the system is likely to grow
considerably as thermopower previously used only as backup will be increasingly used to
supply base-load demand yearlong. In addition, as the regularization capacity decreases, the
Brazilian grid will become progressively susceptible to droughts, thus further increasing the
necessity for generation from fossils. This, in fact, is precisely what has already been
happening in Brazil for nearly two years as of the time of this writing, as expounded in the
ensuing section.
4 The Current Scene in Brazil
In view of the significant presence of hydroelectricity throughout the history of the
Brazilian power grid, thermal stations have always been cast by default in a complementary
role. Many fossil fuel-fired plants, in particular, act as safeguards to make sure the system is
reliable, limiting their production to the extent that the storage levels in the reservoirs offer a
risk of future undersupply of hydroelectricity. As shown in Figure 3, the annual share of
fossils in generation was fairly stable from 2002 to 2011, rising considerably in subsequent
years.
2001 2013 2022
Average (66.6%) 4.18 3.20 2.20
Highest (88.8%) 5.57 4.27 2.93
Full (100%) 6.27 4.81 3.30
Effective Regularization
Capacity (months)
Reservoirs
Storage Levels
7. 7
Figure 3: Evolution of the Share of Generation from Fossil Sources
in the Brazilian Grid
Source: the authors, based on data from ONS.
The recent ramp-up in the share of fossil fuels stemmed from the necessity to ensure
the reliability of the grid after the reservoirs went down to comparatively low levels. It started
in September of 2012, when the average storage level of the reservoirs had just crossed below
57.1%, which meant then an effective regularization capacity no longer than 2.86 months. As
a result, the average relative contribution of fossils in 2012 reached 10.4%; a record that
would be broken in 2013.
That year, despite the wet season having provided inflows similar to those of past
decades, they were not enough to recover the reservoirs back to adequate levels. Thus, many
backup thermal plants triggered in 2012 continued to operate throughout 2013 to supply base-
load demand. As of the first months of 2014, the severe drought that hit Brazil has put the
power grid in dire situation.5
As exhibited in Figure 4, in March of 2014 the system’s
reservoirs were down to 40.4% and the share of fossil sources in the generation mix at an all-
time high of 22.1%.
Within this context, it is important to note that the current high share of fossils in
electricity production has less to do with the decline of the grid’s regularization capacity
but rather more with the drought that overwhelms the country. Though the system’s
reservoirs should return to adequate storage levels once the drought is over, acknowledging
their inherent resiliency (as shown in Annex I), it is undeniable that, as the regularization
capacity decreases, the share of fossils in the generation mix will rise.
5
According to data from ONS, the current wet season has been the worst in the last 43 years; the
inflows being 35% lower than the historical average.
5.1%
4.2%
8.4%
5.1%
4.8%
4.5%
8.0%
3.8%
7.8%
5.6%
10.4%
17.7%
0%
2%
4%
6%
8%
10%
12%
14%
16%
18%
2002 2003 2004 2005 2006 2007 2008 2009 2010 2011 2012 2013
8. 8
Figure 4: Evolution of the Shares of Hydropower, Thermopower from Fossil Sources
and the Reservoirs Storage Levels in the Brazilian Grid
Source: Ibid.
Among the consequences of this structural change, the carbonization of the Brazilian
electricity system will directly translate into a higher emission of pollutants. It is therefore
opportune to estimate an order of magnitude of the future increase of fossil fuels in the
generation mix and the consequent influence on CO2 output. As presented in the next section,
the results are assessed both from a national and an international perspective.
5 An Environmental Assessment of the Decline of Brazil’s Regularization Capacity:
Greater Greenhouse Gas Emissions
To estimate a possible additional generation from thermopower (meaning, from plants
that would operate only as backup if the Brazilian regularization capacity did not decline past
2014) to supply base-load demand from 2015 to 2022, and the consequent increase of fossils
in the generation mix, it is necessary to mesh together that which is known of the present, of
the past and that which is expected from the near future. An adequate arrangement of the
pertinent constants and variables shall thus paint a picture of what can be understood as a
likely outcome of the events currently unfolding in Brazil.
Acknowledging the average inflows of past decades, if the regularization capacity did
not drop beyond 2014 the reservoirs storage levels would remain at an average of 66.6%, and
the share of fossils in the generation mix at around 6.1%. Both these percentages represent
the averages observed from 2002 to 2012.
In view of the decline of the regularization capacity in the coming years, this paper
adopts the hypothesis that the operation of the system will aim to conserve the effective
regularization capacity at an annual average no lower than 2.86 months. The observance of
this principle would thus prevent an episode similar to the one occurred in 2012, which
0%
10%
20%
30%
40%
50%
60%
70%
80%
90%
100%
jan/12
feb/12
mar/12
apr/12
may/12
jun/12
jul/12
aug/12
sep/12
oct/12
nov/12
dec/12
jan/13
feb/13
mar/13
apr/13
may/13
jun/13
jul/13
aug/13
sep/13
out/13
nov/13
dec/13
jan/14
feb/14
mar/14
share of hydropower share of thermopower from fossil sources reservoirs storage level
9. 9
triggered off the massive use of backup thermal plants after the effective regularization
capacity crossed below that threshold. As a result, the share of fossils in the generation mix
will become progressively greater than 6.1% in order to keep the average effective
regularization capacity at 2.86 months as the regularization capacity decreases.
Regarding the future mix of fossils in generation, the authors assume that it will be
similar to what has been observed in recent years prior to 2013, composed chiefly of natural
gas and coal, these being the least expensive sources. This estimate mix, of course, evolves
proportionally to the respective additions in capacity observed in 2013 and currently expected
from 2014 to 2022 (as shown in Annex II).
From this picture it is possible to estimate the future effective regularization capacity
of the Brazilian power grid. If the system’s reservoirs remain at an average of 66.6%, the
effective regularization capacity will decline from 2.82 months in 2015 to 2.20 months in
2022, gradually increasing the gap from the 2.86 months threshold, as presented in Figure 5.
In brief, this means that, if the operation of the grid is to conserve the system’s reservoirs at
an average of 2.86 months, the share of thermopower production from fossil fuels in the
generation mix will have to become higher than 6.1% (the average from 2002 to 2012).
Figure 5: Estimated Evolution of the Effective Regularization Capacity
of the Brazilian Grid
Source: the authors, based on data from EPE (2013) and ONS.
As shown in Figure 6, the average share of fossils in generation will nearly double in
eight years, growing from 6.4% to 11.7%. The additional share, that is, that which bridges the
gap to 2.86 months, will increase ever the more as demand grows and the regularization
capacity shrinks. Energy-wise, the output of these plants will expand over 24x, moving from
1,791 GWh in 2015 to 43,195 GWh in 2022; a total of 177,178 GWh in the intervening years.
2.82
2.72
2.62
2.52 2.44 2.35 2.27 2.20
0.04 0.14 0.24 0.34 0.42 0.51 0.59 0.66
0.0
0.5
1.0
1.5
2.0
2.5
3.0
2015 2016 2017 2018 2019 2020 2021 2022
months
effective regularization capacity gap from 2.86 months
10. 10
Figure 6: Estimated Evolution of the Share of Fossil Sources
in the Brazilian Grid Generation
Source: Ibid.
Regarding the environment, it is appropriate to point out that, adopting the
methodology used in IEA (2013), the emissions here presented relate only to CO2 from fossil
fuel combustion in electricity generation, not including, therefore, lifecycle emissions.
The CO2 output from the additional thermopower generation will add up to 119.26
million tonnes from 2015 to 2022 in order to preserve the average effective regularization
capacity at 2.86 months, as shown on Table 2. In this period, the annual output will grow
over 23x, from 1.24 to 28.82 million tonnes; an increase of 27.58 million tonnes, whereas the
emissions from traditional thermopower will rise by 6.66 million tonnes. It is important to
note that in 2022 the output from additional generation will have exceeded the total of 2015;
a considerable increase in view of the relatively short time in which it occurs.
Table 2: CO2 Emissions from Thermopower Generation from Fossil Sources
Source: The authors, based on data from EPE (2013), Intergovernmental Panel on Climate Change (2007) and
ONS.
The CO2 emissions from electricity will grow at a faster pace than generation,
resulting therefore in the carbonization of the power grid. As shown in Figure 7, the average
CO2 output per MWh will increase considerably in the coming years, moving from 44 kg in
2015 to 78 kg in 2022.
6.4%
7.3%
8.1%
9.0%
9.7%
10.4%
11.0%
11.7%
0%
2%
4%
6%
8%
10%
12%
2015 2016 2017 2018 2019 2020 2021 2022
traditional share additional share
2015 2016 2017 2018 2019 2020 2021 2022 2015-2022
Additional 1.24 5.05 8.92 12.99 16.80 20.76 24.67 28.82 119.26
Traditional 25.41 26.52 27.31 28.19 29.14 30.11 30.94 32.07 229.68
Total 26.64 31.57 36.24 41.18 45.94 50.87 55.62 60.89 348.94
Thermopower
Million Tonnes
11. 11
Figure 7: Estimated CO2 Emissions per MWh from Electricity Generation
in the Brazilian Grid
Source: The authors, based on data from EPE (2013) and IPCC
(2007).
The decline of the regularization capacity will impact meaningfully the energy-related
GHG output in Brazil, causing the country to emit higher volumes. From an international
outlook, Brazil may soon forfeit to France the leading position among the major economies
as producer of low carbon electricity, as shown in Figure 8. It is important to note that
Brazil’s position in the international rank may continue to fall in later decades as it becomes
increasingly dependent on fossils whereas other countries advance their efforts towards
renewables.
Figure 8: CO2 Emissions per MWh from Electricity Generation
in the Leading Economies in 2011
Sources: Brazil and Brazil 2022: Ibid. Other countries: IEA
(2013).
The carbonization of the Brazilian electricity system will impact marginally the
average emissions of the leading economies. In fact, considering Brazil’s emission factor in
2022, the average rate of the leading economies would be 570 kg CO2/MWh; 0.2% higher
than the one actually verified in 2011, of 569 kg CO2/MWh. These results merit further
reflection regarding the choices that are being made in the expansion of the Brazilian electric
44
50
56
61
65
70
74
78
0
20
40
60
80
100
2015 2016 2017 2018 2019 2020 2021 2022
kgCO2/MWh
32 61 78
402
437 441
477 497 503
764
856
0
100
200
300
400
500
600
700
800
900
Brazil
France
Brazil
2022
Italy
Russia
United
Kingdom
Germany
Japan
United
States
China
India
kgCO2/MWh
12. 12
power grid along with the associated costs. Such considerations are presented in the ensuing
section, which concludes the paper.
6 Conclusion
The Brazilian electric grid is historically based on hydropower, and will continue to
be so for the foreseeable future. However, due the recent shift towards the Northern region,
which imposes significant constraints on the size of reservoirs, the expansion of the system’s
storage capacity has progressively lagged behind that of electricity demand. As a result, the
grid’s regularization capacity is in fast decline, one that is set to accelerate in the coming
years.
Under these circumstances, it will be increasingly necessary to weigh the benefits and
corresponding costs of the other sources as their role becomes more and more important to
the system’s security and reliability. As shown by the authors, the role of fossil fuels in the
electric grid is set to grow immensely, which will lead to a yet greater increase in the output
of CO2. Although the estimated carbonization of the Brazilian system will cause a relatively
small impact from an international perspective until 2022, it is a matter of further
investigation how significant an influence it may become in a twenty, thirty or fifty years
time.
The costs ensuing from the choices that have been made regarding the expansion of
the Brazilian electric power system have just started to become apparent. Whether society is
willing (or ready) to pay these costs is a matter that must be object of public debate, one that
should acknowledge the fact that Brazil stands at a crossroads: one path leading to the
inevitable carbonization of the grid; the other, to a greater use of nuclear energy and/or a
more intense rate of construction of hydro plants with larger reservoirs throughout the
country, including the Amazon rainforest. It is imperative, therefore, a comprehensive
technical assessment of the options available and their associated costs, so that the future
choices may lead Brazil to a sustainable balance between environmental protection and
energy security.
The Brazilian power grid is currently undergoing a process of structural change, one
that has but recently started and is due to intensify in the ensuing years. At a time when
sustainable socioeconomic development occupies growing room in the political agenda
worldwide, with the reduction of anthropogenic GHG emissions being one of the main
targets, Brazil appears to move, perhaps unawarely, in the opposite direction. This change
can very well mean the eventual end of the country’s international reputation among the
leading economies for its low output of GHG as it will contribute more and more to the rise
of emissions in the planet, a phenomenon presently absent from debate. Brazil is therefore
one rare example of a country whose chief challenge at the wake of the 21st
century is not to
ascertain a strategy to transition toward a low-GHG electricity system, but to preserve it.
13. 13
References
Empresa de Pesquisa Energética - EPE (2013), Brazilian Energy Balance 2013: Year 2012.
Ministério de Minas e Energia. Rio de Janeiro, Brazil.
____ (2013), Plano Decenal de Expansão de Energia 2022. Ministério de Minas e Energia.
Brasília, Brazil.
Fortunato, L. A. M. et al. (1990), Introdução ao Planejamento da Expansão e Operação de
Sistemas de Produção de Energia Elétrica. Editora da Universidade Federal Fluminense.
Niterói, Brazil.
Intergovernmental Panel on Climate Change - IPCC (2007), Revised 1996 IPCC Guidelines
for National Greenhouse Gas Inventories. Bracknell, United Kingdom.
International Energy Agency - IEA (2013), CO2 Emissions from Fuel Combustion Highlights
(2013 Edition). OECD. Paris, France.
____, “Statistics”, http://www.iea.org/statistics/statisticssearch/. Accessed March 2014.
Operador Nacional do Sistema Elétrico - ONS, “Boletim Semanal da Operação”, http://www.
ons.org.br/resultados_operacao/boletim_semanal/index.htm. Accessed April 2014.
____, “Carga de Energia”, http://www.ons.org.br/historico/geracao_energia.aspx. Accessed
April 2014.
____, “Dados Relevantes 2012”, http://www.ons.org.br/download/biblioteca_virtual/
publicacoes/dados_relevantes_2012/index.html. Accessed March 2014.
____, “Energia Natural Afluente”, http://www.ons.org.br/historico/energia_natural_
afluente.aspx. Accessed March 2014.
____, “Geração de Energia”, http://www.ons.org.br/historico/geracao_energia.aspx. Accessed
April 2014.
____, “IPDO – Informativo Preliminar Diário da Operação”, http://www.ons.org.br/
resultados_operacao/ipdo.aspx. Accessed April 2014.
U.S. Energy Information Administration, “International Energy Statistics”, http://www.eia.
gov/cfapps/ipdbproject/IEDIndex3.cfm?tid=2&pid=2&aid=7. Accessed April 2014.
United Nations Framework Convention on Climate Change, “Greenhouse Gas Inventory
Data - Comparisons By Gas”, http://unfccc.int/di/DetailedByGas.do. Accessed April 2014.
World Energy Council (2013), World Energy Trilemma: Time to get real – the case for
sustainable energy investment. London, United Kingdom.
14. 14
Annex I: Recent Evolution of the Brazilian Grid’s Reservoirs (Jan/2001 - Mar/2014)
Source: The authors, based on data from ONS.
Annex II: Estimated Shares in Electricity Generation from Fossil Sources
Sources: The authors, based on EPE (2013) and ONS.
0%
10%
20%
30%
40%
50%
60%
70%
80%
90%
100%
Jan/01
Aug/01
Mar/02
Oct/02
May/03
Dec/03
Jul/04
Feb/05
Sep/05
Apr/06
Nov/06
Jun/07
Jan/08
Aug/08
Mar/09
Oct/09
May/10
Dec/10
Jul/11
Feb/12
Sep/12
Apr/13
Nov/13
Source
2008-
2012
2015 2016 2017 2018 2019 2020 2021 2022
Coal 20.4% 24.3% 24.3% 24.0% 23.4% 23.1% 22.7% 22.2% 22.2%
Diesel Oil 4.2% 3.0% 3.0% 2.2% 2.2% 2.1% 2.1% 2.0% 2.0%
Fuel Oil 6.1% 5.3% 5.3% 5.3% 5.1% 5.1% 5.0% 4.9% 4.9%
Natural Gas 69.4% 67.3% 67.3% 68.5% 69.3% 69.6% 70.3% 70.9% 70.9%