1. Residential Energy Usage in Relation to Weather Conditions in San Marcos, California
Kayla Carpenter
Faculty Advisor: Zhi-Yong Yin, Environmental and Ocean Sciences
Introduction
Climate change is caused by the emission of green house gases and, as of 2012, carbon dioxide
(CO2) accounted for 82% of total U.S emissions. The largest single source of CO2 emissions in the
nation is due to the combustion fossil fuels to generate electricity, accounting for 38% of total CO2
emissions. Currently, electricity produced from renewable sources contributes only 13% to total
production while coal still generates the majority at 39% (EIA 2014). Overall, energy related carbon
emissions have been declining over the past five years, but this trend has been due to reductions in
the industrial power sector while the demand for residential and commercial use continues to rise.
A federal goal was set for the United States to reduce emissions by 17% of 2005 levels by 2020 and
AB 32, a California mandated goal, is even more stringent by reducing to 1990 levels by 2020. At
the current rate of consumption, neither the state nor federal goal will be met. Thus, it is pertinent
to change consumption patterns and carbon intensive electrical generation, like coal and petroleum,
to be substituted with natural gas and renewables. Due to the mild climate, San Marcos, California,
was chosen as a case study to determine the behavior of energy users and if this can relate to
emissions reductions. It was hypothesized that temperature and relative humidity will correlate with
electricity consumption due to the Mediterranean type climate and peak consumption will occur
over the summer season. Overall, San Marcos will use less electricity and therefore emit less carbon
dioxide than the national average.
San Marcos experiences a typical Mediterranean type climate with warmest temperatures in the
summer season and lowest over winter. On average, the city receives about 15 inches of
precipitation annually, with most of the rain occurring in the winter months. San Marcos
underwent rapid growth in the 1970’s and 1980’s and currently has a median household income of
$65,000. As of 2010, the population reached over 87,000 with a population density of about 3,500
people per square mile.
Results Discussion
Overall, temperature strongly correlated with electrical consumption, suggesting as temperature
increases, electrical consumption also increases. Summer showed the highest daily consumption patterns
and had the highest correlation to temperature. Summer’s peak hour consumption correlated strongly to
temperature, suggesting the usage of cooling devices.
Ultimately, it was found that San Marcos uses an average of 7,753 kWh annually per household
compared to the national average of 12,069 kWh. Furthermore, San Marcos emits an average of 5,350
kilograms (kg) of CO2 per household compared to 7,270 kg nationally (Fig. 7). Although the warmest
months correlate to increased energy usage, the overall climate of San Marcos is relatively mild
compared to a majority of the United States, leading to lower usage and emissions. However, because
48% of household electricity consumption is due to heating and cooling and the residential demand for
energy is on the rise, it is still important for San Marcos to alter consumption habits and switch to more
renewable sources.
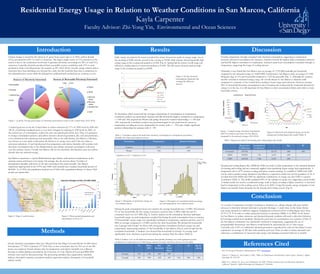
Heating and cooling degree-days (HDD & CDD) are used to relate temperature to the electrical demand
for heating and cooling and are commonly applied when predicting future energy load requirements. A
temperature above 65°F assumes cooling and below assumes heating. To establish if HDD and CDD
can be used to predict energy demand in San Marcos, a regression model was run for goodness of fit. It
revealed that both HDD and CDD are significant contributors of energy use, but CDD is a greater
contributor (Table 3). The model explained 84% of the variance in energy use, suggesting a good model.
A similar model was used in a residential energy study in Spain, revealing a higher sensitivity of electrical
load to temperature in the cooling season (Valor et al. 2001). Using this model, energy companies in San
Marcos can predict future demands for the heating and cooling seasons (Fig. 8).
Methods
Hourly electricity consumption data was collected from San Diego Gas and Electric for 800 meters
from January 17th 2013 to January 15th 2014. Due to time constraints, data for 563 out of the 800
meters was analyzed. Hourly climatic data for temperature and relative humidity was collected
through an online database provided by the University of Utah. Microsoft Excel and IBM SPSS
software were used for data processing. The processing included: data organization; statistical
analyses: descriptive statistics, correlation analysis, regression analysis, histograms of household
analysis results.
Conclusion
As a result of temperature strongly correlating to electricity use, climate change will cause further
increases in electricity demand and lead to potential shortages. A study done on the future climate
and energy demand in California suggests changing the comfort level for cooling degree-day’s from
65 °F to 75 °F in order to reduce projected increases in electricity (Miller et al. 2008). In the future,
for San Marcos to reduce emissions and electrical demand, residents will need to alter their behavior
by lowering comfort level standards. During the peak hour of consumption over summer, 3/5ths of
the San Marcos community was statistically correlated to temperature, suggesting the use of
programmable thermostats. San Marcos would benefit by increasing the use of solar energy.
Currently, only 2.14% of California’s electrical generation is produced by solar yet San Diego County
experiences an average of 263 days with sunshine each year. Thus, in order to reduce demands and
emissions, a combination of increased solar energy and changing consumer behavior is needed.
0
0.2
0.4
0.6
0.8
1
1.2
0
50
100
150
200
250
300
350
400
kWh
Degreedays
Date
HDD
CDD
Avg.
kWh
Model
6.76%
4.16%
1.04%
0.52%
0.39% 0.26%
Sources of Renewable Electricity Generated
Hydro
Wind
Biomass
wood
Biomass
waste
Geothermal
Solar
Daily energy use patterns by season revealed that winter showed two peaks in energy usage, one in
the morning at 9:00h and the second in the evening at 19:00h while summer showed generally high
energy usage in the evening and peaked at 21:00h (Fig. 4). Spring had the lowest overall usage and
followed a similar pattern as winter but peaked at 21:00h. The fall season showed relatively high
usage in the evening but peaked at 20:00h.
To determine which season had the strongest relationship of consumption to temperature,
correlation analysis was performed. Summer and fall showed the highest correlation to temperature,
r =.492 and .384, respectively. Winter and spring showed the weakest relationship, r = .025 and
.250, respectively. Correlation analysis was preformed again for the peak hour by season to
temperature revealing an inverse relationship for winter, with r = -.190, and a highly significant
positive relationship for summer with r= .729.
During the peak consumption hour over summer the average household uses 1.4 kWh. The bottom
5% of the households, the low energy consumers, used less than .5 kWh; while the top 5%
consumers used over 2.67 kWh (Fig. 5). Further analysis on the correlations between individual
household energy use and temperature revealed that during the peak consumption hour in summer,
374 households’ energy usage was statistically correlated to temperature variation and they used 1.5
kWh on average compared to 1.0 kWh used by the other households. We divided the households
into 2 groups with Group1 for those with strong positive correlations between energy use and
temperature, representing majority of the households in San Marcos (Fig. 6), and Group0 for the
remainder households. A Student t test showed that households in Group1 on average used
significantly more electricity at peak hour during the summer than the others (Table 2).
Table 2. Student t test on the difference between households electricity uses with significant positive
correlations to temperature at 21:00h during summer (Group1) and those that do not (Group0).
13%
19%
27%
39%
Sources of Electricity Generated
Renewable
Nuclear
Natural Gas
Coal
0
10
20
30
40
50
60
70
80
0
0.5
1
1.5
2
2.5
3
3.5
Temperature(°F)
Precipitation(in)
Long-term Averages at Vista, CA (1981-2010)
Avg Rainfall (in)
Avg Temp (°F)
Correlation Temperature Relative Humidity
Summer .729** -.235*
Winter -.190 -.100
* Significant at 0.05. ** Significant at 0.01.
Table 1. Correlation analysis for peak hour electricity consumption to temperature and relative
humidity for winter and summer seasons
Figure 1. a) and b) Average percentages of electricity generated by source in the United States (EIA 2014)
Figure 2. Map of study location Figure 3. Mean annual temperature and
precipitation at Vista, CA
Figure 4. Hourly electricity
consumption during the day
averaged for different
seasons
Figure 5. Histogram of peak-hour energy use
over summer season
Figure 6. Histogram of correlations between energy
use and temperature over summer season
San Marcos
Regression
Coefficients
Standardized
Coefficients
t Sig. R2
(Constant) .695746 18.153 .000 .842
HDD .000525 .736 3.678 .004
CDD .002198 1.366 6.825 .000
N Mean
kWh
Std.
Deviation
Std.
Error
Mean
t df Sig. (2-
tailed)
Group1 374 1.46 .903 .047
Group0 189 .998 .642 .047 7.04 500 .000
References Cited
EIA (US Energy Information Administration). 2014. www.eia.gov.
Valor, E., V. Meneu, E., and Caselles, V. 2001. "Daily Air Temperature and Electricity Load in Spain." Journal of Applied
Meteorology, 40: 1413-421.
Miller, N. L., Hayhoe, K., Jin, J., and Auffhammer. M. 2008. "Climate, Extreme Heat, and Electricity Demand in
California." Journal of Applied Meteorology and Climatology, 47: 1834-844.
kWh/home
Kg CO2/home
0
2000
4000
6000
8000
10000
12000
14000
National Avg
San Marcos
Avg
EnergyUse-Emission
kWh/home Kg CO2/home
Table 3. Regression analysis for heating and cooling degree-day model
Figure 7. Annual average electrical consumption
and CO2 emissions per home for San Marcos
compared to the national averages (EIA 2014).
Figure 8. Observed and estimated energy use by the
heating and cooling degree-day model (Table 3)
Editor's Notes
** need references for all graphics
*add sentence for comparison to another city
Beta is standardized coefficient, larger beta contributes more to the dependent variable,
Summer month histograms- 9:00 evening energy use, mean for all meters, distribution of the mean, shows where the majority of people are concentrated , x acis shows means of energy usage, frequency is number of households in the category, most people use from .5 to 1 kWh, postively skewed, a few people use A LOT ~9kWh
Correlation of individual meters with temperature, majority is positive, pretty high, .5 and higher,
Correlation with relative humidity - negative with very low values
Correlation of all meters