Relative effectiveness of water hyacinth, bacteria and fungi in purifying sewage
•
1 like•390 views

International peer-reviewed academic journals call for papers, http://www.iiste.org

Recommended
Recommended
More Related Content
What's hot
What's hot (19)
Similar to Relative effectiveness of water hyacinth, bacteria and fungi in purifying sewage
Similar to Relative effectiveness of water hyacinth, bacteria and fungi in purifying sewage (20)
More from Alexander Decker
More from Alexander Decker (20)
Recently uploaded
Recently uploaded (20)
Relative effectiveness of water hyacinth, bacteria and fungi in purifying sewage
- 1. Journal of Environment and Earth Science ISSN 2224-3216 (Paper) ISSN 2225-0948 (Online) Vol. 3, No.10, 2013 www.iiste.org Relative Effectiveness of Water Hyacinth, Bacteria and Fungi in Purifying Sewage Adeniran, K. A.1 and Bello, A.S.2 Department of Agricultural and Biosystems Engineering, University of Ilorin, PMB 1515, Ilorin. Nigeria 1.E-mail:-kadeniran_2003@yahoo.com 2.E-mail:- hamebell@yahoo.com Abstract The relative effectiveness of water hyacinth (Eichhornia Crassipes) (phytoremedian), bacteria and fungi (bioremedians) used for the purification of domestic sewage was carried out using Completely Randomised Design (CRD) replicated three times. Treatments imposed include: no treatment (control), 1kg and 2kg water hyacinth, bacteria and fungi cultures. Physical, bacteriological and chemical properties of domestic sewage were investigated before and after purification. The results show that for suspended solids, cultured tanks treated with 2kg water hyacinth reduced the sewage concentration from 73mg/l to 37.5mg/l, dissolved solids was reduced from 312mg/l to 266mg/l, Biological Oxygen Demand (BOD) was reduced from 11.2mg/l to 4.37mg/l, Chemical Oxygen Demand (COD) was reduced from 7.6mg/l to 2.7mg/l. Dissolved Oxygen increased from 6.8mg/l to 7.17mg/l for 2kg hyacinth treatment due to photosynthesis but reduced to 3.7 for fungi. The cultured tanks treated with bacteria performed best in reducing turbidity and bacteriological properties of sewage. Turbidity was reduced from 5.8NTU to 1.2NTU for tanks cultured with bacteria. During the first three weeks, the hyacinth's growth was very rapid. It effectively depleted the nutrients present in the sewage, by the 4th week, gradual wilting of water hyacinth was noticed and by the end of the 5th week, serious wilting occurred due to deficiency in essential nutrients. The 2kg water hyacinth tanks wilted permanently due to total consumption of sewage. The results show that purification potential of water hyacinth is related to plants population with the 2kg hyacinth's tanks purifying better than the 1kg hyacinth density and also that bacteria purifies sewage better than fungi. Generally the 2kg water hyacinth was best in reducing the physio-chemical properties of the sewage better than the other treatments applied while the tanks treated with bacteria performed best in reducing bacteriological properties of sewage. Keywords:-Purification, sewage, phytoremediation, water hyacinth, bioremediation, bacteria and fungi. 1. Introduction Bioremediation was defined by the American Academy of Microbiology as the use of living organisms to reduce or eliminate environmental hazards resulting from accumulations of toxic chemicals and other hazardous wastes (Gibson and Sayler, 1992). It can be in form of in situ or ex situ. Bioremediation may occur due the actions of either indigenous microorganisms (those that are native to the site) or exogenous microorganism (those that are imported from other locations). In either case, bioremediation technologies optimize the environmental conditions so that the appropriate microorganisms will flourish and destroy the maximum amount of contaminants. Recent advancements have also proven successful via the addition of matched microbe strains to the medium to enhance the resident microbe population's ability to break down contaminants. Microorganisms used to perform the function of bioremediation are known as bioremediators. Bioremediation can take place in two conditions that are aerobic and anaerobic conditions. Water hyacinth (Eichhornia Crassipes) is a free floating perennial aquatic plant, a member of pickerelweed family- Pontederiaceae and Genus–Eichhornia. It has a broad, thick, glossy, ovate leaves and may rise above the surface, it is a free-floating perennial macrophyte that can grow to a height of 3 feet (Gray, 1993). Under natural conditions the rate of growth was 18.39 g/m2/day on a dry weight basis. Adeniran (2009) reported that water hyacinth is good for nutrient removal and can be used in the pretreatment of sewage before discharging it to water bodies. Dunigan et al., (2002) conducted field trials by adding N and P as ammonium chloride and potassium nitrate and observed that water hyacinth increased the rate of loss of ammonium, but was ineffective in removing nitrate and theirs was low removal of phosphorus. Nelson and Palmer (1998) also observed that rates of N and P uptake were similar to one another and correlated directly with growth. Water hyacinth has become a source of concern to ecologists and fisher-folks in Nigeria since it entered our aquatic ecosystem two decades ago. It made its entrance into Nigeria through the Republic of Benin in 1984 and since then has constituted nuisance to navigation and fisheries (Ndimele and Jimoh, 2011). Amongst the menaces caused by water hyacinth is that, it forms thick mat covering rice paddies, blocking canals and channels, impending navigation and halting fishing, swiping away buildings for mosquito (Chukwuka and Uka, 2007; Ndimele 2010; Ndimele et al., 2011). Because conventional treatment methods are not only costly but time consuming, it is important to reduce the polluting potentials of domestic sewage before it is released into rivers and lakes. This can be achieved by using water hyacinth (Eichhornia crassipes) and bioremedians. The objective 30
- 2. Journal of Environment and Earth Science ISSN 2224-3216 (Paper) ISSN 2225-0948 (Online) Vol. 3, No.10, 2013 www.iiste.org of this study was to determine the relative purification potentials of domestic sewage using bioremedians and water hyacinth. 2. Materials and Methods 2.1 Experimental Design The study was carried out using Completely Randomized Design (CRD) replicated three times. The treatments include: no bioremedian and phytoremedian (control), 1kg and 2kg water hyacinth plant density cultures, bacteria and fungi treatment cultures. 2.2 Characteristics of sewage 2.2.1 Culturing the microorganisms The sewage sample was collected in a clean 2 litres capacity bottle and was evaluated to determine the constituent microorganisms present in the sewage. 10ml of the sample was poured into a flask using a funnel and filter paper. It was then placed into a sterile petri dish (containing agar- the growth medium), which was pressed down gently while removing the filter and the dish was placed in the incubator to allow bacterial growth. During incubation, growth of coliform was encouraged while those of other organisms were suppressed and each cell later developed/grew into individual colonies which could be counted directly for the calculation of Coliform Microbial Density (CMD). 9.7×10⁵ cells/ml of bacteria and fungi respectively were then introduced into each of the bacteria and fungi treatment tanks. 2.2.2 Sewage sampling method The samples were collected from the treatment tanks for various laboratory tests into clean 2litre capacity bottles which were tightly stopped immediately they are filled up with the collected sewage. The initial volume at the point of collection was noted on each sample bottle and the bottles were then stored in a cool dry place for analysis to commence about an hour after the time of collection. 2.3 Physical Tests 2.3.1 Suspended solids The suspended solid was obtained either by subtracting the dissolved solids from total solids or by using filter. The filter was oven dry and weighed 10ml of sample filtered through. The filter was transferred into an oven and dried overnight at 1030C. 2.4.2 Dissolved Solids The sample was filtered with a filter and all the procedure for estimating total solids were carried out. The increase in weight of dish was then calculated. 2.5 Chemical Parameters 2.5.1 Determination of Chemical Oxygen Demand 100ml of distilled water was measured into a 250ml conical flask and 10ml of H2SO4 was added with exactly 20ml of 0.01m KMnO4. A purple solution was obtained and boiled in water bath for 30 minutes: the flask was cooled then 10ml of 10% KI solution was added and a reddish wine colour was obtained with the liberation of iodine. The solution was titrated against 0.05m sodium thiosuphate using 2-3 drops of starch indicator. The result of titre value obtained represented as “A”. 10ml of sewage was added to 90ml of distilled water and the sample was put into 250ml conical flask also 20ml of 0.01m KMn04 was also added. The flask was heated on a boiling bath for 30 minutes. It was then cooled and 10ml of KI solution was added then the liberation iodine was titrated against 0.05m sodium thiosulphate using starch indicator. The result of the titre value obtained represented as “B”. Chemical Oxygen Demand (COD) was calculated as: COD (mg/L) = {(A-B) x M x 40,000/ volume (cm)3 of sample taken} (1) where A=Distilled water titre, B = Sample titre and M= Molarity of KMnO4 used. 2.5.2 Determination of Biological Oxygen Demand 20ml of sewage sample was pipetted into the BOD bottle 5ml of 10% MnCl solution was added followed by 5ml of alkaline iodide solution. The bottle was stopper and mix by inverting several times which turns dirty brown on invention 10ml 25% of HCl solution was added and mix thoroughly which gave a reddish-yellow solution. All the content was empty into a 25ml conical flask with addition of 3 drops of starch indicator. The precipitate was titrated with 0.05m Na2S2O3 to a colourless solution at the end point and the Dissolved Oxygen was calculated as: Dissolved Oxygen (mg/l) = {Titre Value/ V (cm)3 of sample taken} x Molarity x 8000 x Dissolved Oxygen content after seven days (D07) (2) The BOD was determined by subtracting dissolved oxygen of day seven from the initial dissolved oxygen content of the first day. 31
- 3. Journal of Environment and Earth Science ISSN 2224-3216 (Paper) ISSN 2225-0948 (Online) Vol. 3, No.10, 2013 www.iiste.org 2.6 Bacteriological parameters 2.6.1 Bacteria Count The population of coliform bacteria present in the sewage was estimated by determining the Agar count, coliform organisms and E.Coli (Escherichia Coli) of the samples collected. Each of these properties was determined by using a funnel, filter paper and a flask, about 10ml of sample was poured into the filtering funnel. This was placed into a sterile Petri dish (containing agar- the growth medium), which was pressed down gently while removing the filter. After tapping the Petri dish shut, the dish was placed in the incubator to allow bacterial growth. During incubation, growth of Coliform was encouraged while those of other organisms were suppressed. Each cell later developed/grew into individual colonies which could be counted directly for the calculation of Coliform Microbial Density (CMD). 3. Results and Discussion 3.1 Physical Parameters 3.1.1 Volume of sewage consumed The average volume of sewage consumed by the 1kg treatment sample was 4.5litres, while the 2kg treatment sample consumed all the 15litres of the sewage by the end of the fifth week which was due to rapid growth of the plants which was high within the first three weeks resulting in high evaporation and evapotranspiration which took place at a higher rate due to high plant density for the 2kg treatment compared to the other treatments and also a rapid drop in plants density within the last three weeks was observed due to depletion of nutrient in the sewage, while the average volume of sewage consumed by the bacteria treatment sample was 4.2litres and 4.0litres for the fungi treatment sample and the rate of consumption was rapid for the first two weeks but gradually reduces for the last four weeks. For the control (no-water hyacinth treatment and bioremedians), the variation of average volume consumed was due to atmospheric condtion such as evaporation. 3.1.2 Suspended Solids The suspended solid at the point of collection was 73mg/l. For tanks treated with 1kg water hyacinth, suspended solids was reduced to 43.8mg/l, 37.5mg/l for the 2kg water hyacinth treatment, 60mg/l for the bacteria treatment and 67.9mg/l for the fungi treatment. The permissible suspended solid is 55mg/l (WHO, 2011). This shows that the 2kg and 1 kg water hyacinth cultured tanks performed better than bacteria and fungi cultured tanks. The ANOVA tests show that there are significant differences occurred between the treatment means. 3.1.3 Dissolved Solids The dissolved solids at the point of collection was 312mg/l, for tanks treated with 1kg water hyacinth dissolved solids was reduced to 277.1mg/l, 266mg/l for 2kg water hyacinth treatment, 293.3mg/l for bacteria treatment sample and 299.9 for fungi treatment, The permissible dissolved oxygen is 500mg/l (WHO, 2011). This shows that the 2kg water hyacinth treatment tank performed better. The ANOVA test shoes that no significant differences occurred between the treatments means. 3.1.4 Turbidity The turbidity at the point of collection was 5.8NTU, for tanks treated with 1kg water hyacinth turbidity was reduced to 1.8NTU, 1.6NTU for the 2kg water hyacinth treatment sample, 1.2NTU for the Bacteria treatment sample and 2.0NTU for the Fungi treatment. The permissible turbidity is 0.3NTU (WHO, 2011). This shows that the bacteria treatment tanks performed best. The ANOVA test shows that no significant differences occurred between the treatments means. 3.2 Bacteriological parameters 3.2.1 Bacteria Count Table 4 relates the comparison of the average faecal Coliform count of the various densities of plants, bioremedians and the controlled environment, with reference to standard values which exceeded the minimum permissible values of 10cfu/ml (WHO, 2011). This indicates a high presence of different bacteria colonies in comparison with the permissible standard. 3.3 Chemical Parameters 3.3.1 Chemical Oxygen Demand The COD at the point of collection was 7.60mg/l, the COD reduced to4.32mg/l for the 1kg water hyacinth treatment, 3.63mg/l for the 2kg water hyacinth treatment, 3.87mg/l for the bacteria treatment, 3.7mg/l for the fungi treatment. The permissible COD is 10mg/l (WHO, 2011) which shows that the 2kg water hyacinth treatment performed best. The ANOVA test shows that significant differences occurred between the treatments mean. 3.3.2 Dissolved Oxygen The dissolved oxygen at the point of collection was 6.8mg/l. The dissolved oxygen increased to 7.3mg/l for the 32
- 4. Journal of Environment and Earth Science ISSN 2224-3216 (Paper) ISSN 2225-0948 (Online) Vol. 3, No.10, 2013 www.iiste.org 1kg water hyacinth treatment, 7.17mg/l for the 2kg water hyacinth treatment because the plants take in carbondioxide and produce oxygen in the water by photosynthesis, while for bacteria treatment it was reduced to 3.87mg/l and 3.7mg/l for the fungi treatment because the bioremedians use up the dissolved oxygen gradually to breakdown the contaminants in water. The permissible dissolved oxygen is 5mg/l and this shows that the fungi treatment performed best. The ANOVA test shows that significant differences occurred between the treatments means. 3.3.3 Biological Oxygen Demand The BOD at the point of collection was 11.2mg/l, the BOD was reduced to 7.77mg/l for the 1kg water hyacinth treatment, 5.63mg/l for the 2kg water hyacinth treatment, 8.42mg/l for the bacteria treatment and 4.37 for the fungi treatment. The permissible BOD is 6mg/l (WHO, 2011) which shows that fungi treatment performed best. The ANOVA test shows that a significant difference occurred between the treatment means. 4. Conclusion The study showed that both water hyacinth (Eichhornia Crassipes) and Bioremedians (bacteria and fungi) are effective in purifying domestic sewage with little or no harmful effect on the ecology. During the first three water hyacinth cultured in the 2kg tank performed best for reducing physio-chemical properties of domestic sewage, while bacteria throughout the study performed best for reduction of bacteriological of the sewage. The purification potential of water hyacinth is seen to be related to the population of water hyacinth, as the 2kg treatment purified the domestic sewage better than the 1kg treatment it was also noticed that bacteria purifies sewage better than the fungi especially in reducing the turbidity and faecal coliform where it has the highest reduction rate (but the faecal coliform still present exceeds the WHO (2011) permissible values). Due to the depletion of nutrients in the sewage, which started by the third week, but became significant by the 5th week, wilting started in the water hyacinth and rapid reduction in the amount of microorganism present in the treated water, thus bringing about a termination of the study. The purification rate is related to variation in hyacinth’s population densities and type of microorganism introduced (bacteria having high purification than fungi). References Adeniran, K.A. (2009). Purification effects of Water Hyacinth (Elchhornia Crassipes) on Domestic Sewage. Proceedings of the 1ST Annual Civil Engineering Conference tagged Civil Engineering Impact on National Development, Pp 98-107. Organised by the Civil Engineering Department, University of Ilorin, Ilorin. Nigeria. Chuckwuka, K.S and U.N. Uka, 2007. Effect of water hyacinth (Eichhornia crassipes) infestation on Zooplankton population in Awba reservoir, Ibadan South-West Nigeria J. Boil. Sci., 7: 865-869. Dunigan, E.P., R.A. Phelan and Z.H. Shamsuddin,2002. Use of water hyacinth to remove nitrogen and phosphorus from Eutrophic waters. Hyacinth Control J.13; 59-61 Gibson, D.T., and Sayler, G.S. 1992. Scientific Foundations of Bioremediation: Current Status and Future Needs. American Academy of Microbiology, Washington, D.C.,USA. Gray, N.F. 1993. Biology of Waste Water Treatment.1st Ed. Oxford University Press. Pg 479-492. Ndimele, P.E., 2010. A review on the phytoremediation of petroleum hydrocarbon. Pak. J. Boil. Sci., 13:715-722. Ndimele, P.E., C.A. Kumolu-Johnson and M.A. Anetekhai. 2011. The invasive aquatic macrophyte, water hyacinth {Eichhornia crassipes (Mart.) Solm Laubach:Pontedericeae}: Problems and prospects. Res. J. Environ. Sci., 5:509-520. Nelson Y.E and Palmer, R.K 1998. Aquatic Plants Potential in Animal Nutrition Németh, S., (www.fao.org), A halastavi trágyázás módszerei.Budapest Agroinform, Pg. 90. World Health Organization (WHO) 2011, Guidelines for Drinking-Water Quality- 4th Edition, World Health Organization, Geneva. 33
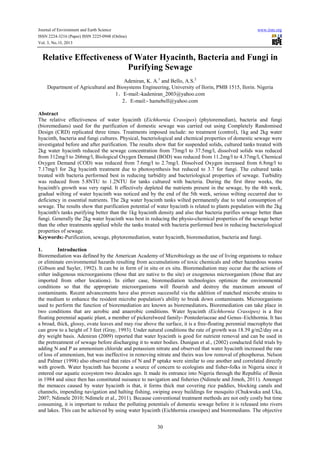
- 5. Journal of Environment and Earth Science ISSN 2224-3216 (Paper) ISSN 2225-0948 (Online) Vol. 3, No.10, 2013 www.iiste.org Dissolved Solids (mg/l) Fig 1:– Experimental setup 600 500 400 300 200 100 0 Control 1kg-WH 2kg-WH Bacteria Fungi WHO permissible level No of weeks Turbidity (NTU) Fig 2:-Effects of purification on Dissolved Solids 8 Control 6 1kg-WH 4 2kg-WH 2 0 No of weeks Biological Oxygen Demand Fig 3:-Effects of purification on Turbidity 25 20 15 10 5 0 Control 1kg-WH 2kg-WH No of weeks Fig 4:- Effects of purification on Biological Oxygen Demand 34
- 6. Chemical Oxygen Demand (mg/l) Journal of Environment and Earth Science ISSN 2224-3216 (Paper) ISSN 2225-0948 (Online) Vol. 3, No.10, 2013 www.iiste.org 12 10 8 6 4 2 0 Control 1kg-WH 2kg-WH Bacteria Fungi WHO permissible level No of weeks Dissolved Oxygen (mg/l) Fig 5:- Effects of purification on Chemical Oxygen Demand 10 8 6 4 2 0 Control 1kg-WH 2kg-WH Bacteria Fungi WHO permissible level No of Weeks Fig 6:-Effects of purification on Dissolved Oxygen Table 1:- Statistical Analysis of Suspended Solids using ANOVA (Analysis of Variance test Sum of Squares df Mean Square F Treatments 2999.3 3 999.8 7.96 Error 2511.4 20 125.6 Total 5510.67 23 Table 2:- Statistical Analysis of Dissolved Solids using ANOVA test Sum of Squares df Mean Square F Treatments 20,974.9 3 6,991.6 2.14 Errors 65,221.2 20 3261.1 Total 86,196.2 23 Table 3:-Statistical Analysis of Turbidity using ANOVA test Sum of Squares df Mean Square Treatments 5.27 3 1.76 Error 30.29 20 1.51 Total 35.56 23 Table 4:- Average Bacterial Count Description Colonies on Nutrient Agar(cc) Point of collection >300 Sample with 1kg >300 Hyacinth Sample with 2kg >300 Hyacinth Bacteria >300 Fungi >300 Coliform org.in 100cc 180+ 180+ 180+ F 1.16 E.coli per 100cc Very high Very high Very high 180+ 180+ High High 35
- 7. Journal of Environment and Earth Science ISSN 2224-3216 (Paper) ISSN 2225-0948 (Online) Vol. 3, No.10, 2013 www.iiste.org Table 5:-Statistical Analysis of Biological Oxygen Demand using ANOVA test Sum of Squares df Mean Square F Treatments Errors Total 163.04 279.59 442.63 3 20 23 54.35 13.98 3.89 Table 6:-Statistical Analysis of Chemical Oxygen Demand using ANOVA test Sum of Squares df Mean Square F Treatments Errors Total 9.16 54.82 63.98 3 20 23 3.05 2.74 1.11 Table 7:-Statistical Analysis of Dissolved Oxygen using ANOVA test Sum of Squares df Mean Square F reatments Error Total 50.88 56.49 107.37 3 20 23 16.96 2.83 36 6.00
- 8. This academic article was published by The International Institute for Science, Technology and Education (IISTE). The IISTE is a pioneer in the Open Access Publishing service based in the U.S. and Europe. The aim of the institute is Accelerating Global Knowledge Sharing. More information about the publisher can be found in the IISTE’s homepage: http://www.iiste.org CALL FOR JOURNAL PAPERS The IISTE is currently hosting more than 30 peer-reviewed academic journals and collaborating with academic institutions around the world. There’s no deadline for submission. Prospective authors of IISTE journals can find the submission instruction on the following page: http://www.iiste.org/journals/ The IISTE editorial team promises to the review and publish all the qualified submissions in a fast manner. All the journals articles are available online to the readers all over the world without financial, legal, or technical barriers other than those inseparable from gaining access to the internet itself. Printed version of the journals is also available upon request of readers and authors. MORE RESOURCES Book publication information: http://www.iiste.org/book/ Recent conferences: http://www.iiste.org/conference/ IISTE Knowledge Sharing Partners EBSCO, Index Copernicus, Ulrich's Periodicals Directory, JournalTOCS, PKP Open Archives Harvester, Bielefeld Academic Search Engine, Elektronische Zeitschriftenbibliothek EZB, Open J-Gate, OCLC WorldCat, Universe Digtial Library , NewJour, Google Scholar