TrustArc Webinar - Stay Ahead of US State Data Privacy Law Developments
Capture recapture estimation for elusive events with two lists
1. Mathematical Theory and Modeling www.iiste.org
ISSN 2224-5804 (Paper) ISSN 2225-0522 (Online)
Vol.2, No.8, 2012
Capture-Recapture Estimation for Elusive Events with Two Lists
Danjuma Jibasen1, Waheed Babatunde Yahya2*, Emanuel Teju Jolayemi2
1. Department of Statistics and Operations Research, Modibbo Adamawa University of Technology,
Yola, Nigeria.
2. Department of Statistics, University of Ilorin, P.M.B. 1515, Ilorin, Nigeria.
*E-mail of the corresponding author: wb_yahya@daad-alumni.de
Abstract
The application of capture-recapture methods to the estimation of population parameter for epidemiologic and
estimating the size of elusive epidemiologic event. The proposed estimator ܰ , the Petersen estimator ܰ௦ and
demographic event has been growing recently. This paper presents a robust capture-recapture model for
another estimator ܰ were compared using the Akaike Information Criterion (AIC) and the Mean Absolute
Deviation (MAD) through simulation studies. Both the AIC and MAD revealed that ܰ is a better and robust
estimator. It was discovered that ܰ௦ under estimates the total elusive population N, ܰ over estimate N while
ܰ was always consistent and performs better than the other two. ܰ is particularly better with lower recaptures
(‘relisting’) ݊ଵଵ which is the case with elusive events. The Petersen ܰ௦ breaks down in the presence of
elusiveness. The other estimator, ܰ always over estimates, except in few cases. It is therefore recommended
that the proposed estimator ܰ be used for estimating dual system elusive events.
Keywords: Trap Response; Dual System Estimation; Elusive events; Petersen estimator; capture-recapture.
1. Introduction
Dual System Estimation (DSE) is the nomenclature given to two samples Capture-Recapture Method when
applied to populations other than animals (Seber, 1965 and IWGDMF, 1990). The classical method of estimation
for this type of experiment was developed and applied to ecological problem by Petersen in 1896, using tagged
plaice, and Lincoln in 1930 who used band returns to estimate the size of the North American waterfowl
population as reported by Seber (1982a). Thus, the two-sample capture-recapture method is tagged
Lincoln-Petersen methods in some literature (Seber, 1982a; Pollock, 1991; Haines et al., 2000). Since the work of
Petersen and Lincoln, several authors have applied their model and its modified form under varying situations.
Sekar and Deming (1949) for instance, estimated birth and death rates using two lists: the registrars list (R)
and the Interviewers list (I) obtained from a complete house –to – house canvass. They also discussed theoretically
that stratification can be used to improve the Petersen estimates when heterogeneity is thought to affect the
estimates. Shapiro (1949) used the Petersen estimates to estimate Birth registration completeness in the United
States. Birth records on file for infants born during the period December 1, 1939 to March 31, 1940 were matched
against infants cards filled by enumerators and a set of death records on the file for children whose birthdates were
within the test period but who died before the census data April 1, 1940.
Alho (1990) introduced an estimator of the unknown population size in a dual registration process based on a
logistic regression model. His model allows different capture probabilities across individuals and across capture
times. The probabilities are estimated from the observed data using conditional maximum likelihood. Alho
developed his method because the classical estimator is known to be biased under population heterogeneity (Seber,
1982b; Burnham and Overton, 1978; Alho, 1990).
when the recaptures (n11) is small the interval between possible values of ܰ for fixed n1. and n.1 are large and that
A Bayesian modification of the Lincoln index was given by Gaskell and George (1972). They observed that
the formula (2.2) is at best a poor estimator of the total animal population N when n11 >10. They incorporated a
prior based on the belief that the experimenter does begin with an idea about the value of N, this may only be
possible in animal experiment. This is not possible in demographic or epidemiologic elusive events. For other
applications and modifications of the Petersen estimator for estimating animal population see Schwarz and Seber
(1999).
It was discovered that the Petersen Method is sensitive to the marginal totals and that it depends so much on
the sampling effort (Jibasen, 2011). That is, if the sampling effort is poor yielding fewer n11, the Petersen
estimator gets poorer, in line with the observation given by Gaskell and George (1972).
It is known in capture-recapture experiments that whether an individual is caught or not depends on a
variety of circumstances. One of this is trap response in which individual may exhibit an enduring behavioral
response to the first capture. That is, after an individual has been captured once, the individual has a long
1
2. Mathematical Theory and Modeling www.iiste.org
ISSN 2224-5804 (Paper) ISSN 2225-0522 (Online)
Vol.2, No.8, 2012
memory of its first-capture experience and the effect lasts for the remainder of the experiment, leading to a
higher (trap-happy) or lower (trap-shy) capture probability for all subsequent recaptures. Behavior of individuals
towards trap will usually give wrong population estimates; trap-shyness results in over estimates of population
size, while trap-happiness results to underestimation. Trap response will generally affects the size of the second
catch (marginal total). In applying this method to elusive populations, individuals are always on the hide or run
once arrested or even hearing about the presence of law enforcement agents. This is similar to trap-shyness, that
is, do everything to avoid a re-arrest. Thus an individual may not be easily re-arrested, leading to a lower
recapture (‘relisting’) probability. In this work therefore, a novel capture-recapture estimation procedure for an
elusive population is proposed.
2. Methodology
Consider a closed population of size N individuals. Let a sample of size n1. be drawn from N without
replacement, marked and returned back into the population. For simplicity, we call this system 1 as presented in
Table 1 in the appendix. Here, elements of n1. sample may represent a set of drug addicts that were caught by
narcotic officials (system 1), probably reformed and released back into the population. If at the second time,
another sample of size n.1 was drawn from the same closed population without replacement using system 2, the
interest now is to examine the members of the first sample n1. (say, of drug addicts) that were caught the second
time (i.e. n11) (recaptured) by system 2.
The Lincoln-Petersen experiment is the simplest capture-recapture method, for estimating the size N of a closed
population which consists of catching, marking, and releasing a sample (sample 1) of n1 animals. After allowing
the marked to mix with the unmarked, a second sample, n.1 is taken from the population. In demography, this is
known as dual system estimation (Erickson and Kadame, 1985). Equating the proportion of the marked
recovered in the second sample (n11) to the population proportion n1. /N leads to an estimate of N.
Mathematically, we have that
୬భభ
ൌ ୬.
୬.భ ே
(2.1)
which simply leads to the estimate,
ܰ ൌ . .
భభ
(2.2)
If ݊. and ݊. are regarded as constants (that is, a random sample without replacement), then from Table 1 ݊ଵଵ
has a hypergeometric distribution of the form
ቀ . ቁቀ . ቁ
భభ మభ
, ݊ଵଵ ൌ ݉ܽݔሺ0, ݊. െ ݊. ሻ, … , ݉݅݊ሺ݊. , ݊. ሻ
ሺ݊ଵଵ ሻ ൌ ቐ ಿ
ቀ ቁ
.భ
(2.3)
0, ݁ݏ݅ݓݎ݄݁ݐ
Sometimes sample 2 is taken with replacement, in this case ݊ଵଵ has a binomial distribution. According to Seber
(1982a), the use of hypergeometric distribution emphasizes the fact that it is basically the activity of the
experimenter that brings about randomness. However, another approach in which randomness is related to the
activity of the animals considers the N animals in the population as N independent multinomial trials each with
the same probability of belonging to a given capture-recapture category. These categories are; caught in the first
sample (݊ଵଶ ) only, caught in the second sample (݊ଶଵ ) only, caught in both sample (݊ଵଵ ) and caught in neither
sample (݊ଶଶ ).
The assumptions of the Petersen estimator are well known (Seber, 1982a; Pollock, 1991). These are;
i.) The population size is closed so that N is constant.
ii.) For each sample, each individual has the same probability of being included in the sample.
iii.) Marking does not affect the catchability of animals.
iv.) Animals do not lose their marks between samples.
v.) All marks (or tags) are reported on recovery in the second sample.
vi.) The animals are independent of one another as far as catching is concerned.
The third assumption above does not hold in the presence of trap response, similar to elusiveness in human
2
3. Mathematical Theory and Modeling www.iiste.org
ISSN 2224-5804 (Paper) ISSN 2225-0522 (Online)
Vol.2, No.8, 2012
population.
The assumptions for the elusive events can be reformulated as follows:
i.) The population size is closed, that is, no addition is allowed at the time of data collection.
ii.) Individuals can be matched from list to list, that is, individuals will not change their names or identities,
moving from one system to another.
iii.) Catching (listing) does affect the catchability (“listability”) of individuals.
iv.) The listing systems may not be independent.
Solving (2.2) for ݊ଵଵ yields, ݊ଵଵ ൌ . .
ே
Or more generally,
ܧሺ݊ଵଵ ሻ ൌ
. .
ே
(2.4)
Method (2.2) is at its “best” when the recaptures ݊ଵଵ (those re-listed, in terms of epidemiology) follows the
It can be seen that (2.3) is the expected value of the hypergeometric random variable, intuitively, the Petersen
hypergeometric distribution.
For demographic and epidemiologic elusive events, one cannot influence the recaptures, since lists form the
sampling occasions. Moreover, for such events the recaptures are relatively small, yielding low recapture
(re-listing) probabilities. Hence, we seek to estimate N via a Horvitz-Thompson method, where the listing
proposed modeling the capture probabilities of animals. Huggins used a form of the Horvitz-Thompson
probabilities (‘listabilities’) of all individuals is used. This approach was used by Huggins (1991), who
estimator, where the capture probabilities of the animals ̂ are estimated for which
ܰ ൌ ∑ୀଵ
శభ ଵ
ೖ
(2.5)
For dual system estimates (single recaptures), this yields exactly the Petersen estimator (see Jibasen, 2011). That
is,
̂ ൌ 1 െ ∏ଶሺ1 െ ̂௦ ሻ
→ ̂ ൌ 1 െ ሺ1 െ ଵ. ሻሺ1 െ .ଵ ሻ (2.6)
It can be shown that ̂ ൌ
where ܰ is the Petersen estimator (which is ܰ௦ in this work). That is, the
ே
Huggins (1991) method is related to the Petersen estimator by
ܰ௦ ൌ
ො
ೖ
Here we replaced ̂ with another probability ( which we called ‘coverage probability’) given as
∑ೞ ௫ೣ
ൌ ∑ೣ
ೣ ௦
(2.7)
ೣ
(see Seber, 1982b) where, x = 0,1,.., s, is the number of times an individual is listed, ݂௫ is the frequency of
individuals occurring x times and s is the number of systems (sources).
For a two system formulation,
∑ೞ ௫ೣ
̂ൌ ൌ
ೣ
∑ ௦ೣ ௦
(2.8)
ೣ
where r is the number of different individuals listed (caught), n is the total number of individuals on both lists
and s is the number of systems. Following the multinomial setting, the joint probability density function for this
model is given by Jibasen (2011) as;
݂ሺ݊ଵ. , ݊.ଵ , ݊ଵଵ ሻ ൌ ቀ ቁ ቀି. ቁ ቀ . ቁ .ା. ሺ1 െ ሻ ௦ି.ି.
ି
భ. . భభ భభ
(2.9)
3
4. Mathematical Theory and Modeling www.iiste.org
ISSN 2224-5804 (Paper) ISSN 2225-0522 (Online)
Vol.2, No.8, 2012
The maximum likelihood estimator (MLE) of is ̂ൌ
௦
which finally leads to our proposed estimator
ܰ ൌ ∑ ො ൌ
ୀଵ
ଵ
ො
(2.10)
that is, ܰ is based on all listed individuals.
The listing probabilities (‘listabilities’) for this model are a random sample of all individuals in the population,
Another estimator used in this work is the no factor model estimator ܰ (Jibasen, 2011). This estimator is given
as;
ܰ ൌ
మ
ସభభ
(2.11)
Under this model it is assumed that all individuals have equal chance of being listed (caught) regardless of
systems, occasion, or even individual heterogeneity. This assumption is purely unrealistic especially for elusive
events in which a drug addict caught the first time will always developed measures to avoid being caught the
and by different systems. However, the new proposed estimator ܰ has largely catered for such a realistic
second or subsequent times, thereby having different probabilities (chances) of being caught at different times
situation.
3. Simulation Studies
assumed, the marginal totals ݊. and ݊. were fixed, but the recaptures ݊ଵଵ was generated randomly. The
Simulation was carried under the hypergeometric setting 2.3 using equation 2.2, where the population size N was
values assumed for N are 90, 100, 300, 500, 1000, 2000, 3000 with corresponding values of ݊. and ݊. fixed
݊. needed to simulate number of recapture ݊ଵଵ are simply obtained by the difference ܰ െ ݊. . For each triplet
at 50, 50, 150, 260, 450, 900, 1500 and 10, 10, 80, 30, 40, 80, 100 respectively. From the above, the values of
(ܰ, ݊. , ݊. ) as specified above, the simulation scheme was repeated ten times and the total size of the elusive
population N was estimated using the two estimators ܰ , ܰ௦ and the newly proposed estimator ܰ as
considered in this study. The performance of each estimator was assessed using Akaike Information Criterion
(AIC) and the Mean Absolute Deviation (MAD). All the simulations and data analysis were performed within the
environment of R statistical package (www.cran.org).
4. Results
It is observed from Table 2 that our new proposed estimator ܰ provides better estimates of N than either the
Various results from the simulations carried out are presented in Table 2 and Tables A1 to A6 in the appendix.
ܰ or ܰ௦ estimator as evident from the results of the AIC and MAD. However, at the seventh iteration of the
simulation (Table 2) where ݊. ൌ ݊ଵଵ , the ܰ yielded a perfect estimate of N like ܰ in many instances. This
better performance of ܰ at this iteration level could be attributed to chance factor since it is just one out of
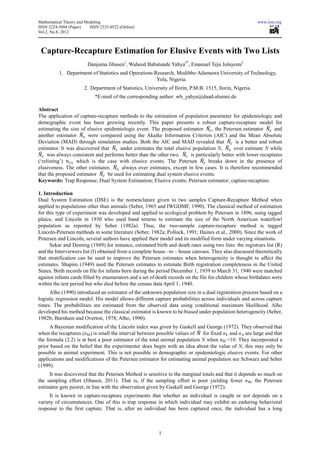
several results obtained. The performances of the three estimators based on their AIC values are presented by the
in Figure 1. The superiority of ܰ over the other two estimators is clearly shown by this plot.
plot of their respective AIC estimates versus the number of times the simulation scheme was repeated as shown
Appendix indicated that the new estimator ܰ consistently performed better than both the Petersen estimator
When the size of the elusive population N increases from 90 to 100, results of AIC and MAD in Table 3 in the
ܰ௦ and ܰ . More specifically, it is observed that as the number of recapture (relisting) ݊ଵଵ gets fewer, both the
ܰ௦ and ܰ estimators get poorer while the ܰ estimator continues to yield better estimates of the intended size
Without loss of generality, various results obtained in this work showed that the new proposed estimator ܰ of
of the elusive population.
the size of elusive population N is more efficient and robust than the other two (ܰ ௦ and ܰ ) based on the AIC
For better understanding of the performances of the three estimators ܰ௦ , ܰ and ܰ under different
and MAD criteria employed as evident from various tables of results (Tables 2 to 8 in the appendix).
simulation schemes as defined by the triplet (ܰ, ݊ଵ. , ݊.ଵ ), we plotted their respective AIC values against the
number of times the simulation was performed (iterations) as presented in Figure 2 in the appendix. Only the
graphs for (300, 150, 80), (500, 260, 30), (1000, 450, 40) and (3000, 1500, 100) schemes based on the results in
in Figure 2 that the AIC values of our new estimator ܰ is relatively smaller and more stable (less variable) than
Tables 4, 5, 6 and 8 respectively are presented in Figure 2 due to space. It is easily observed from the four plots
that of ܰ
௦ and ܰ across all the ten repetitions irrespective the size of the elusive population.
4
5. Mathematical Theory and Modeling www.iiste.org
ISSN 2224-5804 (Paper) ISSN 2225-0522 (Online)
Vol.2, No.8, 2012
5. Discussions and Conclusion
The work here presents a novel estimator of capture-recapture events in elusive population. A thorough
comparison of our proposed estimator with two of the existing ones through simulation studies clearly shows the
population N. Various results from Table 2 and Tables 3 to 8 in the Appendix show that the estimator ܰ
superiority of our estimator over others in terms of better performance at estimating the size of the elusive
always overestimates the size of the elusive population N, ܰ௦ underestimates N while our new proposed
estimator ܰ always performs better in term of the closeness of its estimates to the target population of
elusiveness. Further, the results show that ܰ is a better estimator of the targeted elusive population irrespective
the population size. Also, our proposed estimator performs better with fewer ‘relistings’ ݊ଵଵ , this is the case of
In other words, the Petersen is at its best when the expected value of ݊ଵଵ follows the hyper geometric
elusiveness.
distribution; but the use of hypergeometric distribution emphasizes the fact that it is basically the activity of the
randomness. Thus, Petersen performs very poor with fewer ‘relistings’ ݊ଵଵ which is the case of elusive
experimenter that brings about randomness. Elusive events are such that the experimenter cannot influence
Results from this work suggest that both ܰ and ܰ௦ cannot be used to estimate the size of elusive populations.
population.
The work established that the new proposed ܰ is a better model compared to ܰ and ܰ௦ (the Petersen’s
be used. In such cases our proposed estimator ܰ is a better estimator.
estimator). This turns to suggest that for elusive epidemiologic populations, the popular Petersen’s model cannot
Estimation of these types of Events (ܰ and ܰ௦ ) has been focused towards multiple recaptures in literature, but
some demographic events are such that multiple recaptures may not be possible. This is the case with elusive
populations. Hence, the need for this proposed method for estimating the size of such events.
References
Alho, J.M. (1990). Logistic regression in capture-recapture models. Biometrics 46, 623- 635.
Erickson, E.P. & Kadame, J. B. (1985). Estimating the population in a census year. Journal of the American
Statistical Association 80, 98-109.
Haines, D.E., Pollock, K.H. & Pantula, S. G. (2000). Population Size and Total Estimation When Sampling from
Incomplete List Frames with Heterogeneous Inclusion probabilities. Biometrics 26, 2 121-129
Huggins, R. (1991). Some practical aspects of a conditional likelihood approach to capture experiments.
Biometrics. 47, 725-732.
International Working Group for Disease Monitoring and Forecasting (IWGDMF) (1995a). Capture-Recapture
and Multiple-Record Systems Estimation I: History and Theoretical Development. Am. J. Epidemiol.
142,1047-1058.
Jibasen, D (2011). Capture-recapture Type Models for Estimating the Size of An Elusive Population. An
Unpublished PhD Thesis submitted to the University of Ilorin, Ilorin, Nigeria.
R Development Core Team (2011). R: A language and environment for statistical computing. R foundation for
Statistical computing, Vienna, Austria, (2007), ISBN: 3-900051-07-0, URL http://www.R-project.org
Schwarz, C. J. & Seber, G. A. F. (1999). Estimating animal abundance: Statistical Science 14, 427-456.
Seber, G. A. F.(1965). A note on the multiple-recapture census. Biometrika 52, 249-259
Seber, G. A. F. (1982a). Capture-recapture methods: Encyclopedia of Statistical SciencesVol.1 367-374. Edited
by Samuel, K. and Norman, L.J. New York: John Wiley and sons.
Seber, G. A. F. (1982b). Estimating Animal Abundance and related Parameters, 2nd edition. London: Charles
Griffin & Sons.
Sekar, C. & Deming E.W. (1949). On a Method of Estimating Birth and Death Rates and Extent of Registration.
Journal of the America Stat. Assoc. 44,101-115
Shapiro, S. (1949). Estimating Birth Registration Completeness. Journal of the American Stat. Assoc. 45,
261-264.
Danjuma Jibasen. Dr. Danjuma Jibasen obtained his B.Tech. (Hons.) Statistics at Federal University of
Technology, Yola, Nigeria in 1997. He had his M.Sc. Statistics(with specialty in Biostatistics) in 2003 from
University of Ilorin, Ilorin, Nigeria from where he obtained his Ph.D. in Statistics under the supervision of
Professor E. T. Jolayemi. He is currently a lecturer of statistics at Modibbo Adamawa University of Technology,
Yola, Nigeria. He has a number of scientific publications in reputable academic journals.
Waheed Babatunde Yahya. Dr. Waheed Babatunde Yahya obtained his B.Sc. (Hons.) Statistics and M.Sc.
Statistics degrees from University of Ilorin, Ilorin, Nigeria in 2001 and 2003 respectively. He obtained his Ph.D.
5
6. Mathematical Theory and Modeling www.iiste.org
ISSN 2224-5804 (Paper) ISSN 2225-0522 (Online)
Vol.2, No.8, 2012
in Statistics in 2009 at the Ludwig-Maximilians University of Munich, Munich, Germany under the supervision
of Prof. Dr. Kurt Ulm. His research interests include Categorical data analysis, Biostatistics and analysis of
high-throughput genomic and proteomic data. He taught undergraduate students of Medical Statistics and
Bioinformatics at the Department of Medical Statistics and Epidemiology, Technical University of Munich,
Munich, Germany during the 2007/2008 academic session. He has been teaching Statistics and Biostatistics at
various levels for over a decade at University of Ilorin, Ilorin, Nigeria. He is a Deutscher Akademischer
Austausch Dienst (DAAD) scholar and has published sufficient number of peer reviewed academic papers in
reputed national and international journals.
Emanuel Teju Jolayemi. Professor Emanuel Teju Jolayemi had his B.Sc. (Hons.) Statistics from Ahmadu Bello
University, Zaria, Nigeria in 1976. He obtained his M.Sc. Statistics in 1979 and Ph.D. Biostatistics in 1982
(under the supervision of Professor M. B. Brown) both from University of Michigan, Ann Arbor, U.S.A. He has
been teaching Statistics and Biostatistics at various levels since 1977. He has more than fifty academic
publications in reputed national and international journals to his credit.
Appendix
Table 1: A 2ൈ2 contingency table illustrating capture-recapture scheme from a closed population of size N
individuals using two systems.
System 2
Total
Caught Uncaught
Caught n11 n12 n1.
System 1
Uncaught n21 n22 n2.
Total n.1 n.2 N
Table 2: Table of results of the three estimators (ܰ , ܰ௦ , ܰ ) of elusive population N for simulation scheme with
N = 90, n1. = 50 and n.1 = 10. The AIC values of the estimators at each simulation (iteration) as well as their
respective computed MADs are equally reported in the table.
Iteration ݊ଵଵ ܰ AIC ܰ௦ AIC ܰ AIC
1 7 129 7.141 71 5.366 94 4.272
2 7 129 7.141 71 5.366 94 4.272
3 6 150 9.137 83 4.490 97 4.543
4 8 113 5.760 63 6.112 90 4.010
5 8 113 5.760 63 6.112 90 4.010
6 8 113 5.760 63 6.112 90 4.010
7 10 90 4.000 50 7.124 83 4.490
8 7 129 7.141 71 5.366 94 4.272
9 8 113 5.760 63 6.112 90 4.010
10 5 180 12.197 100 4.759 101 4.824
MAD 44 28 5
6
7. Mathematical Theory and Modeling www.iiste.org
ISSN 2224-5804 (Paper) ISSN 2225-0522 (Online)
Vol.2, No.8, 2012
Table 3 : Table of results of the three estimators (ܰ , ܰ௦ , ܰ ) of elusive population N for simulation scheme
with N = 100, ݊ଵ. = 50 and ݊.ଵ = 10. The AIC values of the estimators at each simulation (iteration) as well as
their respective computed MADs are equally reported in the table.
Iteration ݊ଵଵ ܰ AIC ܰ௦ AIC ܰ AIC
1 4 225 16.29 125 6.018 105 4.348
2 6 150 8.281 83 5.225 97 4.211
3 6 150 8.281 83 5.225 97 4.211
4 7 129 6.327 71 6.101 94 4.476
5 7 129 6.327 71 6.101 94 4.476
6 7 129 6.327 71 6.101 94 4.476
7 7 129 6.327 71 6.101 94 4.476
8 8 113 4.978 63 6.880 90 4.733
9 6 150 8.281 83 5.225 97 4.211
10 5 180 11.29 100 4.000 101 4.063
MAD 48 23 5
Table 4: Table of results of the three estimators (ܰ , ܰ௦ , ܰ ) of elusive population N for simulation scheme with
N= 300, ݊ଵ. = 150 and ݊.ଵ = 80. The AIC values of the estimators at each simulation (iteration) as well as their
respective computed MADs are equally reported in the table.
Iteration ݊ଵଵ ܰ AIC ܰ௦ AIC ܰ AIC
1 52 254 6.698 231 8.106 276 5.456
2 55 240 7.519 218 8.906 266 5.996
3 54 245 7.253 222 8.643 269 5.818
4 49 270 5.786 245 7.254 285 4.904
5 51 259 6.405 235 7.830 279 5.274
6 53 250 6.980 226 8.377 272 5.638
7 57 232 8.030 211 9.424 260 6.351
8 53 250 6.980 226 8.377 272 5.638
9 55 240 7.519 218 8.906 266 5.996
10 55 240 7.519 218 8.906 266 5.996
MAD 52 75 29
Table 5: Table of results of the three estimators (ܰ , ܰ௦ , ܰ ) of elusive population N for simulation scheme with
N = 500, ݊ଵ. = 260 and ݊.ଵ = 30. The AIC values of the estimators at each simulation (iteration) as well as their
respective computed MADs are equally reported in the table.
Iteration ݊ଵଵ ܰ AIC ܰ௦ AIC ܰ AIC
1 17 1237 85.62 459 7.46 514 5.20
2 19 1107 68.92 411 11.43 506 4.55
3 23 914 45.76 339 17.64 492 4.71
4 16 1314 95.88 488 5.06 518 5.53
5 22 956 50.59 355 16.19 495 4.40
6 20 1051 62.06 390 13.13 503 4.24
7 22 956 50.59 355 16.19 495 4.40
8 16 1314 95.88 488 5.06 518 5.53
9 18 1168 76.71 433 9.56 510 4.88
10 20 1051 62.06 390 13.13 503 4.24
MAD 607 89 9
7
8. Mathematical Theory and Modeling www.iiste.org
ISSN 2224-5804 (Paper) ISSN 2225-0522 (Online)
Vol.2, No.8, 2012
Table 6: Table of results of the three estimators (ܰ , ܰ௦ , ܰ ) of elusive population N for simulation scheme with
N = 1000, ݊ଵ. = 450 and ݊.ଵ = 40. The AIC values of the estimators at each simulation (iteration) as well as
their respective computed MADs are equally reported in the table.
Iteration ݊ଵଵ ܰ AIC ܰ௦ AIC ܰ AIC
1 30 2001 117.7 600 38.61 864 16.29
2 29 2070 126.8 621 36.54 867 15.96
3 29 2070 126.8 621 36.54 867 15.96
4 28 2144 136.6 643 34.44 871 15.63
5 24 2501 186.1 750 25.07 886 14.30
6 33 1819 94.4 545 45.04 852 17.27
7 31 1936 109.3 581 40.68 860 16.62
8 22 2728 219.0 818 19.24 894 13.62
9 27 2223 147.3 667 32.28 875 15.30
10 23 2610 201.7 783 22.28 890 13.96
MAD 1210 337 127
Table 7: Table of results of the three estimators (ܰ , ܰ௦ , ܰ ) of elusive population N for simulation scheme with
N = 2000, ݊ଵ. = 900 and ݊.ଵ = 80. The AIC values of the estimators at each simulation (iteration) as well as
their respective computed MADs are equally reported in the table.
Iteration ݊ଵଵ ܰ AIC ܰ௦ AIC ܰ AIC
1 49 4900 353.7 1469 49.74 1769 24.93
2 48 5002 368.2 1500 47.13 1773 24.60
3 57 4212 259.1 1263 67.99 1739 27.59
4 63 3811 206.8 1143 80.48 1716 29.56
5 52 4617 314.2 1385 57.05 1758 25.94
6 60 4002 231.4 1200 74.22 1727 28.58
7 59 4069 240.3 1220 72.15 1731 28.25
8 56 4288 269.2 1286 65.88 1742 27.26
9 55 4365 279.7 1309 63.74 1746 26.93
10 60 4002 231.4 1200 74.22 1727 28.58
MAD 2327 702 257
Table 8: Table of results of the three estimators (ܰ , ܰ௦ , ܰ ) of elusive population N for simulation scheme with
N = 3000, ݊ଵ. = 1500 and ݊.ଵ = 100. The AIC values of the estimators at each simulation (iteration) as well as
their respective computed MADs are equally reported in the table.
Iteration ݊ଵଵ ܰ AIC ܰ௦ AIC ܰ AIC
1 71 9014 784.4 2113 86.04 2922 11.45
2 71 9014 784.4 2113 86.04 2922 11.45
3 65 9846 914.1 2308 67.57 2945 9.26
4 76 8421 694.3 1974 100.21 2903 13.27
5 74 8649 728.6 2027 94.61 2911 12.55
6 67 9552 867.8 2239 73.99 2938 9.99
7 71 9014 784.4 2113 86.04 2922 11.45
8 64 10000 938.5 2344 64.24 2949 8.89
9 55 11636 1205 2727 28.85 2984 5.56
10 64 10000 938.5 2344 64.24 2949 8.89
MAD 6515 770 65
8
9. Mathematical Theory and Modeling www.iiste.org
ISSN 2224-5804 (Paper) ISSN 2225-0522 (Online)
Vol.2, No.8, 2012
14
12
10
AIC values
8
AIC_N0
6
4 AIC_Ns
2 AIC_Nc
0
1 2 3 4 5 6 7 8 9 10
Number of Repetitions
Figure 1: The plot of Akaike Information Criteria (AIC) of the three estimators, ܰ௦ , ܰ and ܰ of the elusive
population N. The plot shows better performance (low AIC values) of our new proposed estimator ܰ over
others.
Figure 2: The plot of the AIC values of each of the estimators ܰ௦ , ܰ and ܰ against the number of times
simulation scheme was repeated for the selected schemes (ܰ, ݊ଵ. , ݊.ଵ ) = {(300, 150, 80), (500, 260, 30), (1000,
450, 40), (3000, 1500, 100)} where N is the assumed size of the elusive population, ݊ଵ. and ݊.ଵ are the total
number of persons (drug addicts) caught by systems 1 and 2 respectively.
9
10. This academic article was published by The International Institute for Science,
Technology and Education (IISTE). The IISTE is a pioneer in the Open Access
Publishing service based in the U.S. and Europe. The aim of the institute is
Accelerating Global Knowledge Sharing.
More information about the publisher can be found in the IISTE’s homepage:
http://www.iiste.org
The IISTE is currently hosting more than 30 peer-reviewed academic journals and
collaborating with academic institutions around the world. Prospective authors of
IISTE journals can find the submission instruction on the following page:
http://www.iiste.org/Journals/
The IISTE editorial team promises to the review and publish all the qualified
submissions in a fast manner. All the journals articles are available online to the
readers all over the world without financial, legal, or technical barriers other than
those inseparable from gaining access to the internet itself. Printed version of the
journals is also available upon request of readers and authors.
IISTE Knowledge Sharing Partners
EBSCO, Index Copernicus, Ulrich's Periodicals Directory, JournalTOCS, PKP Open
Archives Harvester, Bielefeld Academic Search Engine, Elektronische
Zeitschriftenbibliothek EZB, Open J-Gate, OCLC WorldCat, Universe Digtial
Library , NewJour, Google Scholar