A comparative study of the scintillation detector na i(tl) in two sizes
•
0 likes•518 views

International peer-reviewed academic journals call for papers, http://www.iiste.org/Journals
![Advances in Physics Theories and Applications www.iiste.org
ISSN 2224-719X (Paper) ISSN 2225-0638 (Online)
Vol.21, 2013
31
PhotonEnergy(KeV)
Fig. ( 2 ) Parts of the system detect
Scintillating Crystals are used to detect the energy and intensity level of γ ray. The crystals are used as a key
functional material in modern science and technology. Its application can be found in various occasions such as
airport, railway station, customs, port as well as oil field and geographic exploration where detection is required
(Knoll,2006).
NaI:TI Crystal and NaI Detector
NaI is a kind of scintillation crystal with good properties. It has a very high luminescence efficiency and is
available in single crystals or polycrystalline forms in a wide variety of sizes and geometries. The material
exhibits no significant self absorption of the scintillation light and has good resolution ability to X-ray and γ-ray.
of all available scintillators, NaI is the most extensively used material. It is widely used in nuclear medicine, well
logging, environmental monitoring, high energy physics and in many other applications(Knoll,2006,
Sabharwal,et.al.,2008).
The NaI(Tl) detector consist of two pants , the NaI(Tl) crystal and the photo multiplier , the detection
system consist of two amplifiers , pave and main , the job of this amplifiers is shaping the electronic signal,
amplification and release the electronic noise .The electronic signals go to the multichannel analyzer and show
the result as an energy spectrum as shown in Fig. (2) (Salgado,et.al.,2012).
The Detection system calibration
Two calibration were done for the gamma ray nuclear detection system , the first for the detection
efficiency and the second is the energy , by using a standrad radioactive sources putted in a container of 0.25 L
volume .
The calculate efficiency ( ξ ) is given by [ 6 ]
……………. ( 1 )
N: count rate under photo peak position .
T : time measurement .
A : activity of radioactive sources using of calibration .
Iγ : relative intensity of each energy source of the energies of the radioactive
Peak Position ( ch.no )
Fig. ( 3 ) calibration system energy
0 500 1000 1500 2000 2500 3000
Peak Position (ch)
0
200
400
600
800
1000
1200
1400
1600
1800
2000
ξ = =](data:image/gif;base64,R0lGODlhAQABAIAAAAAAAP///yH5BAEAAAAALAAAAAABAAEAAAIBRAA7)
Recommended
More Related Content
What's hot
What's hot (20)
Similar to A comparative study of the scintillation detector na i(tl) in two sizes
Similar to A comparative study of the scintillation detector na i(tl) in two sizes (20)
More from Alexander Decker
More from Alexander Decker (20)
Recently uploaded
Recently uploaded (20)
A comparative study of the scintillation detector na i(tl) in two sizes
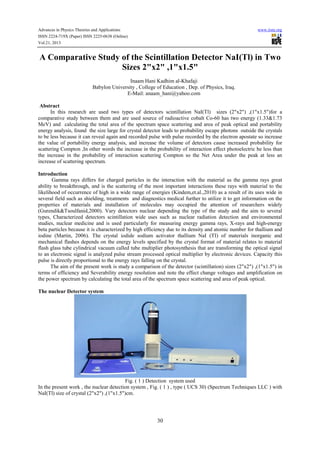
- 1. Advances in Physics Theories and Applications www.iiste.org ISSN 2224-719X (Paper) ISSN 2225-0638 (Online) Vol.21, 2013 30 A Comparative Study of the Scintillation Detector NaI(Tl) in Two Sizes 2"x2" ,1"x1.5" Inaam Hani Kadhim al-Khafaji Babylon University , College of Education , Dep. of Physics, Iraq. E-Mail: anaam_hani@yahoo.com Abstract In this research are used two types of detectors scintillation NaI(Tl) sizes (2"x2") ,(1"x1.5")for a comparative study between them and are used source of radioactive cobalt Co-60 has two energy (1.33&1.73 MeV) and calculating the total area of the spectrum space scattering and area of peak optical and portability energy analysis, found the size large for crystal detector leads to probability escape photons outside the crystals to be less because it can reveal again and recorded pulse with pulse recorded by the electron apostate so increase the value of portability energy analysis, and increase the volume of detectors cause increased probability for scattering Compton ,In other words the increase in the probability of interaction effect photoelectric be less than the increase in the probability of interaction scattering Compton so the Net Area under the peak at less an increase of scattering spectrum. Introduction Gamma rays differs for charged particles in the interaction with the material as the gamma rays great ability to breakthrough, and is the scattering of the most important interactions these rays with material to the likelihood of occurrence of high in a wide range of energies (Kindem,et.al.,2010) as a result of its uses wide in several field such as shielding, treatments and diagnostics medical further to utilize it to get information on the properties of materials and installation of molecules may occupied the attention of researchers widely (Gurendik&Tsoulfanid,2000). Vary detectors nuclear depending the type of the study and the aim to several types, Characterized detectors scintillation wide uses such as nuclear radiation detection and environmental studies, nuclear medicine and is used particularly for measuring energy gamma rays, X-rays and high-energy beta particles because it is characterized by high efficiency due to its density and atomic number for thallium and iodine (Martin, 2006). The crystal iodide sodium activator thallium NaI (TI) of materials inorganic and mechanical flashes depends on the energy levels specified by the crystal format of material relates to material flash glass tube cylindrical vacuum called tube multiplier photosynthesis that are transforming the optical signal to an electronic signal is analyzed pulse stream processed optical multiplier by electronic devices. Capacity this pulse is directly proportional to the energy rays falling on the crystal. The aim of the present work is study a comparison of the detector (scintillation) sizes (2"x2") ,(1"x1.5") in terms of efficiency and Severability energy resolution and note the effect change voltages and amplification on the power spectrum by calculating the total area of the spectrum space scattering and area of peak optical. The nuclear Detector system Fig. ( 1 ) Detection system used In the present work , the nuclear detection system , Fig. ( 1 ) , type ( UCS 30) (Spectrum Techniques LLC ) with NaI(Tl) size of crystal (2"x2") ,(1"x1.5")cm.
- 2. Advances in Physics Theories and Applications www.iiste.org ISSN 2224-719X (Paper) ISSN 2225-0638 (Online) Vol.21, 2013 31 PhotonEnergy(KeV) Fig. ( 2 ) Parts of the system detect Scintillating Crystals are used to detect the energy and intensity level of γ ray. The crystals are used as a key functional material in modern science and technology. Its application can be found in various occasions such as airport, railway station, customs, port as well as oil field and geographic exploration where detection is required (Knoll,2006). NaI:TI Crystal and NaI Detector NaI is a kind of scintillation crystal with good properties. It has a very high luminescence efficiency and is available in single crystals or polycrystalline forms in a wide variety of sizes and geometries. The material exhibits no significant self absorption of the scintillation light and has good resolution ability to X-ray and γ-ray. of all available scintillators, NaI is the most extensively used material. It is widely used in nuclear medicine, well logging, environmental monitoring, high energy physics and in many other applications(Knoll,2006, Sabharwal,et.al.,2008). The NaI(Tl) detector consist of two pants , the NaI(Tl) crystal and the photo multiplier , the detection system consist of two amplifiers , pave and main , the job of this amplifiers is shaping the electronic signal, amplification and release the electronic noise .The electronic signals go to the multichannel analyzer and show the result as an energy spectrum as shown in Fig. (2) (Salgado,et.al.,2012). The Detection system calibration Two calibration were done for the gamma ray nuclear detection system , the first for the detection efficiency and the second is the energy , by using a standrad radioactive sources putted in a container of 0.25 L volume . The calculate efficiency ( ξ ) is given by [ 6 ] ……………. ( 1 ) N: count rate under photo peak position . T : time measurement . A : activity of radioactive sources using of calibration . Iγ : relative intensity of each energy source of the energies of the radioactive Peak Position ( ch.no ) Fig. ( 3 ) calibration system energy 0 500 1000 1500 2000 2500 3000 Peak Position (ch) 0 200 400 600 800 1000 1200 1400 1600 1800 2000 ξ = =
- 3. Advances in Physics Theories and Applications www.iiste.org ISSN 2224-719X (Paper) ISSN 2225-0638 (Online) Vol.21, 2013 32 And the energy resolution ( E.R ) is given by , fig. ( 3 ) , by using Cs-137 source (Sabharwal,et.al.,2008). % = . . . × 100 % F.W.H.M : Full width at high maximum . Ch .no : photo peak position . Results and Discussion To find out the effect of crystal size detector (scintillation) on the resulting spectrum was calculated the total area of the spectrum (T.A) , a scattering area (Sc.A) and Photo peak (Ph.P) and N, G refer to the Net and Gross respectively. 1- Study the effect of voltage on the energy spectrum To investigate the effect of voltages on the energy spectrum show table (1) accounts process for both detector NaI(Tl) and source radioactive cobalt-60 which sends two photons have energy (1.333 &1.73 MeV), effectiveness radiological (1µCi) and half-life (5.27 year), with the installation of the time on (200) sec and the distance between the radioactive source and detector NaI(Tl) (15) cm at amplification on (2) by changing the voltage (V) (500-700) volt. Table (1) shows the accounts process for the source of radioactive cpbalt-60 at amplification (2) for both detectors NaI(Tl) 1"x1.5",(2"x2") 2Amp Co-60 Detector 1"x1.5" E.R2E.R1CF.W.H.M Ph.P2 CF.W.H.M Ph.P1Sc.AT.A V NGNGNGNG 3.1984.048104033770114791437741141316696201932032822867500 2.4822.61180445101517031609421483234221400292562972133461530 1.9522.148250949149324362234482870487232508434254798551891550 Detector 2"x2" E.R2E.R1CF.W.H.M Ph.P2 CF.W.H.M Ph.P1Sc.AT.A V NGNGNGNG ————————————74657595500 7.1437.56715611143528031321021603877547782571561015893550 6.2966.809270171950299023516220838989932137662092521100600 5.2046.2184422321453021386242253395717083217542851928886650 4.4316.3126773022323053602382286407023099292203564936648700 Seen from table (1) that increased voltages lead to increasing every(T.A) and (Sc.A) as in Figure (4), which shows the relationship between voltage and the total area of both detector by using source cobalt-60 at amplification (2), and notes in detector 2"x2" be the spectrum does not appear at first clearly but gradually begins to emerge while the energy resolution decreases with increasing voltage for both detector as shown in Figure (5),(6). Fig. (4) the relationship between the voltage and the total area of the spectrum at amplification (2) for both the detectors (1"x1.5") ,(2"x2") using the source of cobalt-60 5000 13000 21000 29000 37000 45000 53000 450 480 510 540 570 600 630 660 690 720 750 T.A(count/sec) V(volt) 1"X1.5" 2"X2"
- 4. Advances in Physics Theories and Applications www.iiste.org ISSN 2224-719X (Paper) ISSN 2225-0638 (Online) Vol.21, 2013 33 We note from Figure (4) that the relationship between voltage and the total area of the spectrum is positive relationship was found that voltages in detector 1"x1.5" start of (500 V) and stand at (550 V) while in detector 2"x2" start of( 500 V) and ends at (700 V). We find that the total area of the spectrum increases with increasing voltage for both detector, but the rate of increase using detector (1"x1.5") be greater than detector (2"x2"), because the increased volume of detector means increasing the number of electrons reaching the anode photomultiplier and then increase capacity pulse emerging from detector which makes the necessary voltages for detector (2"x2") is greater than the voltage required for the detector (1"x1.5") using the same amplification, so the peak have emerged cobalt-60 detector 1"X1.5" more distinctive, less interference and higher than the detector 2"X2" and this means that the number of photons that interact in three ways for detector 2"X2" larger than detector 1"x1.5" (A-Taie,2001), as well as increased voltage leads to change Photo peak position and exit it channel axis so the detector (1"x1.5") not spectrum appears when you increase the voltage more than 550 V, while the spectrum is a clear in detector (2"X2") because of the large crystal size compared to the size of detector (1"X1.5") this result is consistent with the findings of the (Al-Araji,1998) when he studied the effect of crystal size detector NaI (TI) sizes (3"X3") and (1"X1.5") on the energy spectrum and found that the size difference detector leads to increased capacity pulse emerging from detector (3"X3") and that appear with a capacity greater than the detector (1"X1.5") which leads to offset for its peaks where increasing both T.A and Sc.A only E.R decreasing voltages increase (Sidhu,2000). Fig. (5) the relationship between the voltage and energy resolution at amplification (2) for detector (1"x1.5")using a source of cobalt-60 Fig. (5) the relationship between the voltage and energy resolution at amplification (2) for detector (2"x2") using a source of cobalt-60 Seen from Figures (5)&(6) that the relationship between voltage and energy resolution is an inverse relationship in other words with increasing voltage increases (F.W.H.M) which leads to the decrease in energy resolution and thus an event improvement in discrimination and separation of peaks, (Knoll,2000) where the detector (1"x1.5") less than it is in the detector( 2"x2") which leads to increased efficiency of detector (2"x2"), this he found (Al-hawamdeh,2010), who studied effect mixing radioactive sources on the spectra nuclear using 0 1 2 3 4 5 490 500 510 520 530 540 550 560 E.R(%) V(volt) E.R1 E.R2 4 5 6 7 8 450 500 550 600 650 700 E.R(%) V(volt) E.R1 E.R2
- 5. Advances in Physics Theories and Applications www.iiste.org ISSN 2224-719X (Paper) ISSN 2225-0638 (Online) Vol.21, 2013 34 NaI (Tl) and effect voltages on the spectrum energy and his found that the T.A and Sc.A increasing with increase voltages as well as increase the photo peak leading to an offsets peak from location to the location of the top of the channel axis while viability analysis energy decreases due to the increased width of the channel. 2- Study the effect of amplification on the energy spectrum To see the effect of amplification on the energy spectrum show table (2) accounts process for both detector NaI(Tl) by using source radioactive cobalt-60 with the installation of the time on (200) sec and the distance between the radioactive source and detector NaI(Tl) (15) cm at voltage on (500 volt) by changing the amplification (1-64) (Amp). Table (2) shows the accounts process for the of source radioactive cobalt-60 at voltage on (500 volt) for both detectors NaI(Tl) 1"x1.5",(2"x2") 2Amp Co-60 Detector 1"x1.5" E.R2E.R1CF.W.H.M Ph.P2 CF.W.H.M Ph.P1Sc.AT.A V NGNGNGNG 4.0234.113522218601154462197521413104271370314689164361 3.753.1731040397701147914297411413166962019320328228672 2.1482.23120024330210711748395151545191142341023056261264 1.2371.2793799472355336632834232964961342034443046987529188 Detector 2"x2" E.R2E.R1CF.W.H.M Ph.P2 CF.W.H.M Ph.P1Sc.AT.A V NGNGNGNG ————————————62791 ————————————746575952 6.4336.803171111053234314710146546036546944616696167764 6.3047.23734922154127733042220253733128711769224642249298 4.7485.263695331733273160832198436372499829786358743672016 2.9523.27813213922323053115938238238223296340239431234736532 We note at table (2) that increasing every(T.A) , (Sc.A)and (Ph.P) with increased amplification as in Figure (6), while possibility analysis of energy less as in Figures (7)&(8), and also noted that in the detector 1"x1.5" does not appear spectrum at amplification (32) while being clear in the detector "2x2". Fig. (6) the relationship between amplification and the total area of the spectrum at voltage (500 volt) for both detectors (1"x1.5"),(2"x2") using a source of cobalt-60 We note from Figure (6) the relationship between the amplification and the total area of the spectrum using the source cobalt-60 is a direct correlation to both detectors NaI(Tl) where the rate of increase using detector (1"x1.5") bigger it when using detector (2"x2") because of effect gain amplified which corresponds to the effect voltages where changing the location photo peak change gain and remain the area under the peak fixed although 79 5079 10079 15079 20079 25079 30079 35079 40079 45079 50079 55079 0 5 10 15 20 25 30 35 T.A(count/sec) Amp 1"x1.5" 2"x2"
- 6. Advances in Physics Theories and Applications www.iiste.org ISSN 2224-719X (Paper) ISSN 2225-0638 (Online) Vol.21, 2013 35 distributed over a larger area in the case of increase profitability (Al-hawamdeh,2010), which leads to lower count rate at the site of the peak, and this is consistent with the findings of the (A-Dahan,2002) show where area under the spectrum for detector (2"x2") is larger detector (1"x1.5") and this means that the number of photons that interact with the detector (2"x2") is greater than the number of photons that interact with the detector (1"x1.5"). Fig. (7) the relationship between amplification and energy resolution at voltage (500 volt) for detectors (1"x1.5")using a source of cobalt-60 Fig. (8) the relationship between amplification and energy resolution at voltage (500 volt) for detectors (2"x2")using a source of cobalt-60 We Note from Figures (7)&(8) that the relationship between the amplification and energy resolution is an counterproductive because of increasing the display of photo peak which lead to the decrease of energy analysis capability Mirela &Gheorghe,2011). Conclusions 1- The large size of the crystal detector leads to increased capacity pulse emerging from detector (2"x2") which appear with a capacity greater than the detector (1"x1.5") leading to an offset for their peaks where increasing both (T.A) and (Sc.A). 2- present study showed that the energy resolution less to increase the number of channels and voltage relationship exponential decreasing they are in detector (1"x1.5") less than it is in detector (2"x2").while increasing photo peak Location to increase the number of channels and the voltage, linear relationship. 3- At increase the size of crystal, the Photo peak increases too, because the number of photons entering the crystal detector (2"x2") be the largest and photo peak higher than at detector (1"x1.5"). 4- Increase the amplification means increasing the number of pulses generated inside the detector and thus increasing (T.A), (Sc.A) and (Ph.P) due to increased capacity pulse that led to the widening spectrum and creep photo peak position and thus exit the peak from the axis of the channel, while increasing amplification lead to increased (FWHM) in other words increase width photo peak that leads to decreases portability energy analysis (E.R). . 0 2 4 6 0 2 4 6 8 10 E.R(%) Amp E.R1 E.R2 线性线性线性线性 (E.R2) 指数指数指数指数 (E.R2) 1 3 5 7 0 5 10 15 20 25 30 E.R(%) Amp E.R1 E.R2
- 7. Advances in Physics Theories and Applications www.iiste.org ISSN 2224-719X (Paper) ISSN 2225-0638 (Online) Vol.21, 2013 36 References 1- Joel Kindem, Chuanyong Bai, and Richard Conwell, "CsI(Tl)/PIN Solid state Detectors for Combined High Resolution SPECT and CT Imaging", IEEE Journal, PP.1987-1990 ,2010. 2- M.Gurendik &N.Tsoulfanid,Nucl.Sci.Teach.,Vol.131,P.332,2000. 3- Martin, J. E. " Physics for Radiation Protection", Wiley – Vch Verlag Gmbh & Co. KGaA , Weinheim, 2nd ,2006 4- G., Knoll, " Nuclear and Particle Physics " , John Wiley, USA,2006. 5- C.M,Salgado,L.E.B, Brandao , C.M.N.A, Pereira, and C.C, Conti, "Validation of a NaI(Tl) detector's model developed with MCNP-X code" ,Elsevier Journal, Vol.59, PP. 19-25, 2012. 6- A.D. Sabharwal, M.Singh, B.Singh and B.S.Sandhu,"Response Function of NaI(Tl) Detectors and multi backscattering of Gamma Rays in Alumium",Vol.66,No.10,2008. 7- Fadhil Ismail Sharrad A-Taie,"A Study the Effect of Different Magnetic Fields on the Scintillation Detector NaI(Tl)", M .Sc, University of Babylon, College of Science,2001. 8- Adnan Hammoud Mohammed Al-Araji,"Study of NaI(Tl) Scintillation Detector Pulse and Photo Sensitive Pulse Height Analyzer-Desiging", M .Sc, University of Babylon, College of Science,1998. 9- G.S.Sidhu,J.Radiol.Pro.,Vol.20,P.53,2000. 10- A.D. Sabharwal, M.Singh, B.Singh and B.S.Sandhu,"Response Function of NaI(Tl) Detectors and multi backscattering of Gamma Rays in Alumium",Vol.66,No.10,2008. 11- Hussein Ahmed Ali Al-hawamedh, "A study of the Effect of Mixing Radiation Sources on the Nuclear Spectra Using the Scintillation Detector NaI(Tl). 12- G.,Knoll," Radiation Detection and Measurement " , John Willey & Sons , New York , Third edition ,2000. 13- Nawras Mohammad Shaheed A-Dahan," The Effect of the Scattered photons from the Surrounding on the Energy Spectrum of the Scintillation Detector NaI(Tl) ", M.Sc, University of Babylon, College of science,2002. 14- Mirela Angela Saizu and Gheorghe Cata-danll,"Lanthanum Bromide Scintillation Detector for Gamma Spectrometry Applied in Internal Radioactive Contamination Measurements" ,U.P.B.Sci.Bull., Series A,Vol.73, Iss.4, 2011.
- 8. This academic article was published by The International Institute for Science, Technology and Education (IISTE). The IISTE is a pioneer in the Open Access Publishing service based in the U.S. and Europe. The aim of the institute is Accelerating Global Knowledge Sharing. More information about the publisher can be found in the IISTE’s homepage: http://www.iiste.org CALL FOR PAPERS The IISTE is currently hosting more than 30 peer-reviewed academic journals and collaborating with academic institutions around the world. There’s no deadline for submission. Prospective authors of IISTE journals can find the submission instruction on the following page: http://www.iiste.org/Journals/ The IISTE editorial team promises to the review and publish all the qualified submissions in a fast manner. All the journals articles are available online to the readers all over the world without financial, legal, or technical barriers other than those inseparable from gaining access to the internet itself. Printed version of the journals is also available upon request of readers and authors. IISTE Knowledge Sharing Partners EBSCO, Index Copernicus, Ulrich's Periodicals Directory, JournalTOCS, PKP Open Archives Harvester, Bielefeld Academic Search Engine, Elektronische Zeitschriftenbibliothek EZB, Open J-Gate, OCLC WorldCat, Universe Digtial Library , NewJour, Google Scholar