Model Call Girl in Tilak Nagar Delhi reach out to us at 🔝9953056974🔝
PRESENTATION QC (2).pptx
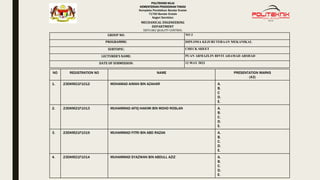
1. POLITEKNIK NILAI
KEMENTERIAN PENDIDIKAN TINGGI
Kompleks Pendidikan Bandar Enstek
71760 Bandar Enstek
Negeri Sembilan
MECHANICAL ENGENEERING
DEPARTMENT
DJF51082 QUALITY CONTROL
GROUP NO: NO 3
PROGRAMME: DIPLOMA KEJURUTERAAN MEKANIKAL
SUBTOPIC: CHECK SHEET
LECTURER’S NAME: PUAN ARMAZLIN BINTI AHAMAD ARSHAD
DATE OF SUBMISSION: 12 MAY 2023
NO REGISTRATION NO NAME PRESENTATION MARKS
(A3)
1. 23DKM21F1012 MOHAMAD AIMAN BIN AZAHAR A.
B.
C
D.
E.
2. 23DKM21F1013 MUHAMMAD AFIQ HAKIMI BIN MOHD ROSLAN A.
B.
C.
D.
E.
3. 23DKM21F1019 MUHAMMAD FITRI BIN ABD RAZAK A.
B.
C.
D.
E.
4. 23DKM21F1014 MUHAMMAD SYAZWAN BIN ABDULL AZIZ A.
B.
C.
D.
E.
2. i) INTRODUCTION
■ Defination of quality.
- level of achievement in customer need.
- to control the quality of products or services in ensuring customer’s satisfaction and expectation.
Important of quality to customer
- Longevity
- fulfill the need
- solving the problem
- cost
- security
- usability
- efficiency
3. ■ Importance of quality to company.
- Competition
- fulfill the customer’s expectation
- business reputation
- customer’s loyalty
■ Definition of quality control
- technique or activities used to meet, reach, support and enhance the quality of
products or services.
-
4. ■ Objectives of quality control
- to achieve acceptable levels of products from the time of shipment until the time
of consumption.
- to achieve the quality of products according to specifications.
- to conform the period of completion and delivery of products.
- to monitor the raw materials, process and finished products.
■ Advantages of quality control
- improved the standard
- increased production under optimum condition.
- reduced production bottleneck.
5. ■ Tools and Technique for Process Improvement.
- To make rational decisions using data obtained on the product, or process, or from the
consumer, organizations use certain graphical tools.
- These methods help us learn about the characteristics of a process, its operating state
of affairs and the kind of output we may expect from it.
- Graphical methods are easy to understand and provide comprehensive information;
they are a viable tool for the analysis of product and process data.
- These tools are effect on quality improvement.
6. - The nine quality control tools are:
1. Pareto Chart
2. Cause and Effect Diagram
3. Check Sheet
4. Process Flow
5. Scatter Diagram
6. Histogram
7. Brainstorming
8. Matrix Analysis
9. Quality Control Circle
7. ii) Explanation
CHECK SHEET
■ Introduction ;
• Check sheets aren’t mandatory to construct Pareto charts. However, because
check sheets require you to standardize your list and definitions of
nonconformities, they provide several benefits.
• list of items checked that allows data collected quickly and easily.
• helps calculate the frequency of a problem
• suitable for quantitative analysis
• data must be rearranged from high frequency to low frequency.
8. Elaboration
When to use the check sheet ;
When data can be observed and collected repeatedly by the same person or at the
same location
When collecting data on the frequency or patterns of events, problems, defects,
defect location, defect causes, or similar issues
When collecting data from a production process
Why check sheet is important ;
A Check Sheet is an important tool for effective data collection and analysis. It is a
form used to collect required data in a systematic and organized manner. A Check
Sheet is a data collection tool that usually identifies where and how often
problems appear in a product or service.
9. ■ Check sheet procedure ;
1) Decide what event or problem will be observed. Develop operational definitions.
2) Decide when data will be collected and for how long.
3) Design the form. Set it up so that data can be recorded simply by making check
marks or X's or similar symbols and so that data do not have to be recopied for
analysis.
4) Label all spaces on the form.
5) Test the check sheet for a short trial period to be sure it collects the appropriate
data and is easy to use.
6) Each time the targeted event or problem occurs, record data on the check sheet.
10. ADVANTAGES DISADVANTAGES
1. To provide documentary evidence of data
collection
1. if data is to be collected at previously
unfamiliar or atypical locations, data quality
and thus evaluation can suffer,
2. Helps to create histograms, bar graphs, and
Pareto charts.
2. Cannot reveal any changes overtime.
3. Monitor the process performance and also
easy to use.
3. Need to analyse several sheets arranged in
chronological order to determine the trend.
4. To provide a base for future reference. 4. Possibility of checks not entered by data
collector.
Advantages and disadvantages of check
sheet.
11. ■ Check sheet type :
1. Process probability distribution check sheet
The main point of the sheet is to give you a visual representation of the probabilistic
distribution of certain factors in the execution of the process, something which can
become very clear and noticeable with a quick glance at a process probability
distribution sheet. An important point when working with this type of sheet is to set
the appropriate upper and lower limits according to the specification.
12. 2. Defect type sheet
The defect type sheet is a simple type of check sheet used to mark the occurrence of a specific defect,
allowing you to easily count them later on. That way, you can just plug the data into a statistical
analysis tool and you’ll get an easy overview of the current state of defects in your project.
13. 3. Defect location sheet
Similar to the above, but focused specifically on tracking the location where different defects occur.
This can be an extremely powerful tool when combined with the defect type sheet, and it’s not
uncommon to see both used alongside each other in organizations during phases of seeking out and
eliminating causes of defects. When it comes to simple, but powerful statistical tools that can help
you get the full picture of your current situation, combining a defect location sheet with a defect type
sheet can give you a lot of useful information with relatively little effort.
14. 4. Defect cause sheet
The defect cause sheet tracks exactly what its name implies what caused each defect in your
process, using the same format as the Defect type sheet above. This is not always critical
information, depending on what exactly you’re looking for, but if you’re running root cause analysis or
something along those lines, the information collected from a defect cause sheet can be handy down
the road.
15. TALLY CHARTS
• Tables that record the frequency with which different events are observed.
• The collected data is quickly understood as it is displayed in an easy-to-count
groups of five.
COMMON APPLICATION:
• Capturing data related to customer complaints
• Counting the defects produced by any single machine.
16. Show how subtopic chosen can be used to
improve the quality process.
iii) Example
17. A check sheet is a simple and effective tool that can be used to improve the quality control
process in several ways:
1. Standardization: Check sheets can be used to standardize data collection, making it easier to
identify and measure quality control issues. By standardizing data collection, it becomes
possible to compare results over time and across different locations or processes.
2. Tracking: Check sheets allow for the tracking of specific quality control metrics over time. This
makes it possible to identify trends and patterns, and to track progress towards meeting quality
control goals.
3. Root cause analysis: Check sheets can be used to collect data on the occurrence of specific
quality control issues. This data can be analyzed to identify the root causes of the problems,
which can then be addressed and resolved.
18. 4. Continuous improvement: Check sheets are an effective tool for continuous improvement. By
collecting data and analyzing it over time, it is possible to identify opportunities for improvement and
to make changes that will lead to better quality control outcomes.
5. Employee engagement: Check sheets can be used to engage employees in the quality control
process. By involving employees in data collection and analysis, they become more invested in the
quality control process and are more likely to identify and address quality control issues.
Overall, check sheets are an effective tool for improving the quality control process. By standardizing
data collection, tracking quality control metrics, identifying root causes of problems, and engaging
employees in the process, check sheets can help organizations to improve the quality of their
products or services, reduce costs, and increase customer satisfaction.