Recommended

Recommended
More Related Content
What's hot
What's hot (18)
Similar to Undergraduate research poster presentation
Similar to Undergraduate research poster presentation (20)
Recently uploaded
Recently uploaded (20)
Undergraduate research poster presentation
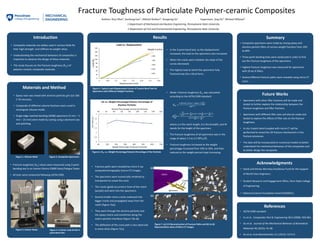
- 1. Results (a) (b) (c) (d) • In the 3-point bend test, as the displacement increased, the load on the specimens also increased. • When the cracks were initiated, the slope of the curves decreased. • The highest load at which the specimens fully fractured was the critical force. • Mode I fracture toughness KIc was calculated according to the ASTM E399 standard: 𝐾𝐼𝑐 = 𝑐𝑟𝑖𝑡𝑖𝑐𝑎𝑙 𝑓𝑜𝑟𝑐𝑒 ∗ 𝑠𝑝𝑎𝑛 ∗𝑓( 𝑎 𝑊 ) 𝑏𝑊1.5 f( 𝑎 𝑊 ) = 3 𝑎 𝑊 (1.99− 𝑎 𝑊 (2.15−3.93 𝑎 𝑊 +2.7 ( 𝑎 𝑊 )2) 2(1+2 𝑎 𝑊 )(1− 𝑎 𝑊 )2 where a is the notch length, b is the breadth, and W stands for the height of the specimen. • The fracture toughness of all specimens was in the range of about 1.5 to 2.5 MPa m. • Fracture toughness increased as the weight percentage increased from 10% to 20%, and then reduced as the weight percent kept increasing. • Fracture paths were revealed by micro X-ray computed tomography (micro-CT) images. • The specimens were numerically rendered as transparent to reveal the crack. • The cracks (gold) occurred in front of the notch (purple) and went into the specimens. • Several smaller micro-cracks coalesced into bigger cracks and propagated away from the notch (Figure 7(a)). • They went through the alumina particles and the epoxy matrix and sometimes along the matrix-particle interfaces (Figure 7(b-d)). • The deflection of the crack path is also observed in some slices (Figure 7(c)). Figure 5. Typical Load-Displacement Curves of 3-point Bend Test for Specimens with Different Weight Fractions Figure 6. 𝐊 𝐈𝐜 v.s. Weight Percentage/Volume Percentage of the Particles Figure 7. (a) 3-D Reconstruction of Fracture Paths and (b) to (d) Representative slices of Micro-CT Images Fracture Toughness of Particulate Polymer-ceramic Composites • Composite materials are widely used in various fields for their high strength- and stiffness-to-weight ratios. • Understanding the mechanical behaviors of composites is important to advance the design of these materials. • This study focuses on the fracture toughness (KIc) of polymer-ceramic composite materials. Introduction Authors: Ruyi Man1 , Jiacheng Gao1 , Abhinit Kothari1 , Kangning Su1 Supervisors: Jing Du1 , Michael Hillman2 1 Department of Mechanical and Nuclear Engineering, Pennsylvania State University 2 Department of Civil and Environmental Engineering, Pennsylvania State University Acknowledgments • David and Shirley Wormley Excellence Fund for the Support of World Class Engineers; • Student Research and Engagement Office, Penn State College of Engineering; • National Science Foundation Award #1826221. Future Works • Specimens with other filler fractions will be made and tested to further explore the relationship between the fracture toughness and filler fractions. • Specimens with different filler sizes will also be made and tested to explore the effects of filler size on the fracture toughness. • In situ 3-point bend coupled with micro-CT will be performed to reveal the 3D fracture mechanisms in the fracture processes. • The data will be incorporated to numerical models to better understand the mechanical behaviors of the composites and to better design the composite. Materials and Method • Fracture toughness (KIc) values were measured using 3-point bending test in an Instron Electro E3000 Static/Fatigue Tester. • All tests were conducted following ASTM E399. Figure 1. Silicone Mold Figure 3. Instron Tester Figure 4. A Closer Look At the 3- point Bend Test Figure 2. Composite Specimens Summary • Composite specimens were made by mixing epoxy and alumina particle fillers of various weight fractions from 10% to 60%. • Three-point bending tests were conducted in order to find out the fracture toughness of the specimens. • Highest fracture toughness was measured for specimens with 20 wt.% fillers. • Several different fracture paths were revealed using micro-CT scans. References • ASTM E399 standard • Fu et al. Composites Part B: Engineering 39.6 (2008): 933-961. • Du et al. Journal of the Mechanical Behavior of Biomedical Materials 46 (2015): 41-48. • Du et al. Acta Biomaterialia, 9.2 (2013): 5273-9. • Epoxy resin was mixed with alumina particles grit size 180 (~76 microns). • Composite of different volume fractions were cured in rectangular silicone molds. • Single edge notched bending (SENB) specimens (5 mm × 5 mm × 25 mm) were made by cutting using a diamond saw and polishing. Weight Fraction Notch Cracks Specimen Notch 100 µm (MPam)