The Utilization of Machine Learning for The Prediction of CSX Index and Tax Revenues in Cambodia

ABSTRACT: The machine learning model LSTM was applied and compared with the linear regression machine learning model for the CSX index of the Cambodia Securities Exchange. The time span covered in this study was from February 1, 2019, to October 12, 2023, totaling 1146 days. Out of these, 917 days were classified as Train data, accounting for 80% of the total sample size, while 229 days were classified as Test data. Additionally, the same techniques were used to forecast the tax revenues of the Royal Government of Cambodia, which were collected by the General Department of Taxation. Despite using monthly data, the tax revenues were analyzed over a longer period of 25 years, starting from January 1998 to August 2023. The Train data consisted of 247 months, equivalent to 80% of the total sample size, while the Test data accounted for 61 months, approximately 20% of the total sample size. The machine learning model, LSTM, demonstrated superior performance over the linear regression machine learning model in predicting the daily movement of the CSX Index of the Cambodia Securities Exchange, as evidenced by the root mean square error. The Test data revealed that the estimated root mean square error of the linear regression machine learning was 64.78, while the LSTM machine learning produced a lower error of 33.08. However, when applied to tax revenues data, the linear regression machine learning outperformed the LSTM machine learning, with estimated root mean square errors of 219.31 and 1601.87, respectively. KEYWORDS: CSX Index, Tax Revenues, Machine Learning, Linear Regression, LSTM

Recommended
Recommended
More Related Content
Similar to The Utilization of Machine Learning for The Prediction of CSX Index and Tax Revenues in Cambodia
Similar to The Utilization of Machine Learning for The Prediction of CSX Index and Tax Revenues in Cambodia (20)
More from AJHSSR Journal
More from AJHSSR Journal (20)
Recently uploaded
Recently uploaded (20)
The Utilization of Machine Learning for The Prediction of CSX Index and Tax Revenues in Cambodia
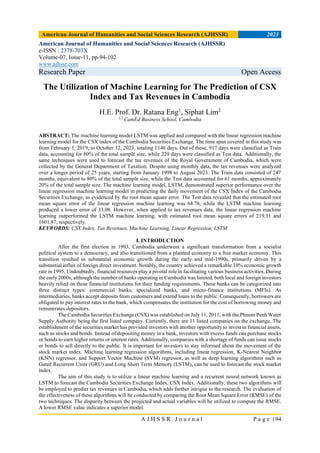
- 1. American Journal of Humanities and Social Sciences Research (AJHSSR) 2023 A J H S S R J o u r n a l P a g e | 94 American Journal of Humanities and Social Sciences Research (AJHSSR) e-ISSN : 2378-703X Volume-07, Issue-11, pp-94-102 www.ajhssr.com Research Paper Open Access The Utilization of Machine Learning for The Prediction of CSX Index and Tax Revenues in Cambodia H.E. Prof. Dr. Ratana Eng1 , Siphat Lim2 1,2 CamEd Business School, Cambodia ABSTRACT: The machine learning model LSTM was applied and compared with the linear regression machine learning model for the CSX index of the Cambodia Securities Exchange. The time span covered in this study was from February 1, 2019, to October 12, 2023, totaling 1146 days. Out of these, 917 days were classified as Train data, accounting for 80% of the total sample size, while 229 days were classified as Test data. Additionally, the same techniques were used to forecast the tax revenues of the Royal Government of Cambodia, which were collected by the General Department of Taxation. Despite using monthly data, the tax revenues were analyzed over a longer period of 25 years, starting from January 1998 to August 2023. The Train data consisted of 247 months, equivalent to 80% of the total sample size, while the Test data accounted for 61 months, approximately 20% of the total sample size. The machine learning model, LSTM, demonstrated superior performance over the linear regression machine learning model in predicting the daily movement of the CSX Index of the Cambodia Securities Exchange, as evidenced by the root mean square error. The Test data revealed that the estimated root mean square error of the linear regression machine learning was 64.78, while the LSTM machine learning produced a lower error of 33.08. However, when applied to tax revenues data, the linear regression machine learning outperformed the LSTM machine learning, with estimated root mean square errors of 219.31 and 1601.87, respectively. KEYWORDS: CSX Index, Tax Revenues, Machine Learning, Linear Regression, LSTM I. INTRODUCTION After the first election in 1993, Cambodia underwent a significant transformation from a socialist political system to a democracy, and also transitioned from a planned economy to a free market economy. This transition resulted in substantial economic growth during the early and mid-1990s, primarily driven by a substantial influx of foreign direct investment. Notably, the country achieved a remarkable 10% economic growth rate in 1995. Undoubtedly, financial resources play a pivotal role in facilitating various business activities. During the early 2000s, although the number of banks operating in Cambodia was limited, both local and foreign investors heavily relied on these financial institutions for their funding requirements. These banks can be categorized into three distinct types: commercial banks, specialized banks, and micro-finance institutions (MFIs). As intermediaries, banks accept deposits from customers and extend loans to the public. Consequently, borrowers are obligated to pay interest rates to the bank, which compensates the institution for the cost of borrowing money and remunerates depositors. The Cambodia Securities Exchange (CSX) was established on July 11, 2011, with the Phnom Penh Water Supply Authority being the first listed company. Currently, there are 11 listed companies on the exchange. The establishment of the securities market has provided investors with another opportunity to invest in financial assets, such as stocks and bonds. Instead of depositing money in a bank, investors with excess funds can purchase stocks or bonds to earn higher returns or interest rates. Additionally, companies with a shortage of funds can issue stocks or bonds to sell directly to the public. It is important for investors to stay informed about the movement of the stock market index. Machine learning regression algorithms, including linear regression, K-Nearest Neighbor (KNN) regressor, and Support Vector Machine (SVM) regressor, as well as deep learning algorithms such as Gated Recurrent Units (GRU) and Long Short Term Memory (LSTM), can be used to forecast the stock market index. The aim of this study is to utilize a linear machine learning and a recurrent neural network known as LSTM to forecast the Cambodia Securities Exchange Index, CSX Index. Additionally, these two algorithms will be employed to predict tax revenues in Cambodia, which adds further intrigue to the research. The evaluation of the effectiveness of these algorithms will be conducted by comparing the Root Mean Square Error (RMSE) of the two techniques. The disparity between the projected and actual variables will be utilized to compute the RMSE. A lower RMSE value indicates a superior model.
- 2. American Journal of Humanities and Social Sciences Research (AJHSSR) 2023 A J H S S R J o u r n a l P a g e | 95 This paper consists of five sections. The topic is introduced in the first section, followed by an extensive review of literature in the second section. Section three presents the methodology adopted in the study. The fourth section discusses the results and discussion, and the final section provides a concluding remark. II. LITERATURE REVIEW According to Seethalakshmi (2018), the forecasting of stock market prices is considered a regression use case due to the continuous nature of stock prices. In their study, Di Persio and Honchar (2017) utilized a recurrent neural network (RNN) to forecast Google stock prices. RNN, LSTM, and GRU are the three most efficient neural networks for sequential data. RNN is typically used for historical data, while LSTM and GRU are capable of avoiding the vanishing gradient problem through the use of forget, reset, and update gates. GRU has been found to be faster due to its operation on reset and update gates. Forecasting stock prices and predicting market trends pose significant challenges. Over the years, numerous solutions have been proposed by researchers to tackle these challenges (Obthong et al., 2020; Polamuri et al., 2019), and the following methods are briefly outlined. Machine learning (ML), deep learning, time series forecasting, and ensemble algorithms are among the most widely adopted approaches for addressing these issues. Ensemble algorithms have demonstrated the ability to enhance accuracy and reduce RMSE. Additionally, Hadoop architectures have proven effective in handling large volumes of stock data (Jose et al., 2019), while deep learning algorithms have shown promise in predicting financial markets (Hu et al., 2021). LSTM, a unique type of RNN, has been successfully employed in stock forecasting to overcome long-term dependency (Qiu et al., 2020; Banik et al., 2022). However, RNN-based architectures often encounter challenges such as the vanishing gradient and exploding gradient problems, which necessitate careful consideration (Li and Pan, 2021; Zhu, 2020). Khan et al. (2020) utilized linear regression and random forest techniques to achieve accuracy rates ranging from 80% to 98% (Khan et al., 2020). In a similar vein, Xu et al. (2020) employed bagging ensemble learning techniques to make predictions about Chinese stocks. This methodology involves the integration of a two-stage prediction model, namely ensemble learning SVM and random forest (RF), with KNN to cluster it with ten technical indicators. Another proposed approach utilizes Ensemble LSTM with convolution neural network (CNN) on stock indexes to train adversarial networks, which can aid in forecasting high-frequency stock and offers benefits such as adversarial training, reduction of direction prediction loss, and forecast error loss (Zhou et al. 2018). To enhance the effectiveness of the ensemble model of eXtreme gradient boosting (XG-Boost) and LSTM, XG-Boost is utilized to select features applied to high-dimensional time series data, and LSTM is employed for stock price forecasting (Vuong et al. 2022). Machine learning ensemble methods have not only contributed to the enhancement of forecasting performance, but they have also demonstrated promising results in the realm of neural network blending ensemble models, as observed in certain research studies. In a study conducted by Yang (2019), a model comprising two layers of RNN was implemented. The first layer employed a blending ensemble algorithm based on LSTM, while the second layer utilized GRU. This model exhibited the lowest RMSE value of 186.32, accompanied by a precision rate of 60% and an F1-score of 66.47, as reported by Li and Pan (2021). Due to the influence of news and global events on stock prices, relying solely on price variation is insufficient for the training of machine learning models. Additionally, artificial ANN and LSTM-based deep learning techniques can be trained using both price values and text data. The Word2vec algorithm utilizes a neural network model to extract word associations from a vast text corpus. Once trained, this model is capable of identifying synonymous words or suggesting additional words to complete an incomplete sentence (Kumar and Ningombam 2018; Reddy et al. 2020). In an alternative methodology put forth by Li et al. (2020), an examination of past data through technical analysis and a comprehensive analysis utilizing a deep learning technique were undertaken to yield enhanced returns. In this context, the LSTM model was selected for prediction purposes due to its ability to retain memory and its lack of susceptibility to the vanishing gradient problem. Comparable research has been presented in the works of Agrawal et al. (2022), Sathish Kumar et al. (2020), and Umer et al. (2019). III. METHODOLOGY Linear Regression Machine Learning is a field within Artificial Intelligence that concentrates on creating algorithms and statistical models capable of acquiring knowledge from data and making predictions. Linear regression, a supervised machine-learning algorithm, falls under the umbrella of Machine Learning. It learns from labeled datasets and maps the data points to the most optimized linear functions, enabling accurate predictions on new datasets. Linear regression is utilized in the prediction of stocks or financial markets to anticipate the future stock price regression. This technique employs a model that is based on one or more attributes, such as closed price, open price, volume, etc., to forecast the stock price. The objective of regression modeling is to replicate the linear relationship between the dependent and independent variables. The linear regression model generates a line of
- 3. American Journal of Humanities and Social Sciences Research (AJHSSR) 2023 A J H S S R J o u r n a l P a g e | 96 best fit that describes the association between the independent factors and the dependent variable. When plotting the values of the dataset on a graph, a straight line is mathematically fitted between the points in order to minimize the square of the distance or difference between each point and the line. The hypothesis line is then utilized to forecast the value of y for each given x. This forecasting technique is commonly referred to as linear regression (Dospinescu and Dospinescu, 2019). Long Short-Term Memory Deep learning models have gained significant traction across various domains of science and engineering. Their utilization is particularly prevalent in the field of stock price forecasting and trend prediction, owing to their proficiency in capturing intricate patterns, managing substantial data volumes, and facilitating feature learning and representation. Moreover, their adaptability to dynamic market conditions further enhances their appeal. Within this subsection, we will delve into an exploration of several prominent deep learning models within the finance domain. The LSTM model is a sophisticated variant of the RNN, which is a deep learning algorithm. The LSTM model is capable of processing lengthy sequences of data units by retaining the data sequence, which can be utilized for future inputs. A general LSTM cell structure is depicted in Figure 1. It consists of three gates, namely the input gate, the forget gate, and the output gate. The sigmoid activation function is employed by all of the gates. Figure 1. LSTM Structure Input gate (New information in cell state): 𝑖𝑔𝑎 = 𝜎(𝑊𝑖𝑝[ℎ𝑡−1, 𝑋𝑐] + 𝑏𝑖) Forget gate (Useless information is eliminated): 𝑓𝑔𝑎 = 𝜎(𝑊𝑓𝑔[ℎ𝑡−1, 𝑋𝑐] + 𝑏𝑓) Output gate (Activation to last block of final output): 𝑂𝑝𝑔 = 𝜎(𝑊 𝑜𝑝[ℎ𝑡−1, 𝑋𝑐] + 𝑏𝑜) The sigmoid function, denoted as s, is utilized in conjunction with the neuron gate weight, Wx, the preceding LSTM block result, ht-1, the input, Xt, and the bias, bx. Figure 1 illustrates that the upper portion of the memory line in each cell can be connected to the transport line through the assistance of the model. This connection facilitates the handling of data from the previous memory to the current memory. Each LSTM node is equipped with a set of cells dedicated to storing the data stream (Pramod and Pm 2021). To ensure ample training time for a recursive network and the establishment of long-distance causal links, LSTM maintains errors at a consistent level (Mukherjee et al. 2021). In various instances, neural networks and deep neural networks have demonstrated superior forecasting performance compared to other machine learning models. However, in the realm of predicting financial distress, the logistic regression model has exhibited better outcomes when compared to neural networks (Zizi et al. 2021). In this algorithm, the weights for each long short-term memory data point are adjusted through stochastic gradient descent. It has been observed that LSTM is capable of handling long-term dependencies more effectively than any other neural network algorithm (Pramod and Pm, 2021). LSTM is a sophisticated type of RNN and is a deep learning technique. It is widely used in stock forecasting and when combined with sentiment analysis, it yields better results than without sentiment analysis (Shahi et al., 2020).
- 4. American Journal of Humanities and Social Sciences Research (AJHSSR) 2023 A J H S S R J o u r n a l P a g e | 97 Data The CSX Index, a daily stock market index, is utilized for conducting forecasting within the time span of February 1, 2019, to October 12, 2023. The data for the CSX Index is obtained from the Cambodia Securities Exchange and is divided into the Train and Test data. The study period encompasses a total of 1146 days, with 917 days classified as Train data, accounted for 80% of the total sample size, and 229 days classified as Test data. In terms of Tax revenues, monthly data is analyzed from January 1998 to August 2023, covering a span of 308 months. Similar to the CSX Index data series, 80% of the total sample size, equivalent to 247 months, are classified as Train data, while the remaining 20% (61 months) are classified as Test data. The data related to tax revenues are collected from the Ministry of Economy and Finance. Performance Measures The evaluation of forecasting performance utilized the test data for both CSX Index and Tax Revenues series. The measurement of 𝑌 ̂ forecast and its corresponding 𝑇 test data values of 𝑌 are conducted through the implementation of the following formula: Mean Square Error (MSE) 𝑀𝑆𝐸 = ∑(𝑌𝑡 − 𝑌 ̂𝑡) 2 𝑇 Root Mean Square Error (RMSE) 𝑅𝑀𝑆𝐸 = √∑(𝑌𝑡 − 𝑌 ̂𝑡) 2 𝑇 Correlation Coefficient 𝑟2 = ∑(𝑌𝑡 − 𝑌 ̅)(𝑌 ̂𝑡 − 𝑌 ̂ ̅) √∑(𝑌𝑡 − 𝑌 ̅)2(𝑌 ̂𝑡 − 𝑌 ̂ ̅) 2 IV. RESULTS AND DISCUSSION The study encompasses a total sample size of 1146 days for the CSX Index series. On a daily basis, there are four quoted data series: Open, High, Low, Close, and Volume. However, the focus of the CSX Index forecasting lies solely on the Close index. Throughout the study period, the average, minimum, and maximum values for the Close index are 578, 449, and 871, respectively. The 25th percentile is 488, the 50th percentile is 571, and the 75th percentile is 647. Additionally, the standard deviation is calculated to be 99. Table 1. Descriptive Statistic, CSX Index CSX Open High Low Close Volume count 1146 1146 1146 1146 1.15E+03 mean 578 582 574 578 1.37E+05 std 99 101 97 99 1.11E+06 min 449 451 442 449 3.39E+02 25% 488 489 486 488 1.64E+04 50% 570 576 566 571 4.97E+04 75% 647 651 644 647 9.72E+04 max 871 877 869 871 3.26E+07 The Open data series displays an average index of 578, with a minimum index of 449 and a maximum index of 871. The standard deviation of the Open data is 99. Additionally, the 25th, 50th, and 75th percentiles of the Open data series are 488, 570, and 675, respectively. The High data, on the other hand, showcases an average index of 582, accompanied by a minimum index of 451 and a maximum index of 877. The High data series also demonstrates a standard deviation of 101. Furthermore, for the High data, the 25th, 50th, and 75th percentiles of the series are 489, 576, and 651, respectively. Moreover, the Low data exhibits an average index of 574, with a minimum index of 442 and a maximum index of 869. The standard deviation of the Low data is 101. The 25th, 50th, and 75th percentiles of the Low data series are 486, 566, and 644, correspondingly.
- 5. American Journal of Humanities and Social Sciences Research (AJHSSR) 2023 A J H S S R J o u r n a l P a g e | 98 Figure 2. Box, CSX Index The data has been divided into two time periods, namely Train and Test. The Train period represents 80% of the total sample size, while the Test period represents the remaining 20%. The results obtained from the implementation of the linear regression machine learning algorithm reveal that during the Train period, the R- square value is 0.60, the mean square error (MSE) is 3949.27, and the root mean square error (RMSE) is 62.84. Similarly, during the Test period, the R-square, MSE, and RMSE values are 0.57, 4196.80, and 64.78, respectively. Figure 3. Machine Learning Regression Algorithm, CSX Index The Test period demonstrated improved predicted results for the CSX Index when utilizing the Long Short-Term Memory (LSTM) algorithm, as indicated by the reduction in RMSE from 64.78 to 33.08. This outcome highlights the superior performance of the deep learning LSTM algorithm compared to the linear regression machine learning approach in predicting the CSX Index. Table 2. Linear Machine Learning Results, CSX Index Metric Train Test R-square 0.60 0.57 Mean Square Error (MSE) 3949.27 4196.80 Root Mean Square Error (RMSE) 62.84 64.78
- 6. American Journal of Humanities and Social Sciences Research (AJHSSR) 2023 A J H S S R J o u r n a l P a g e | 99 In addition to utilizing machine learning to forecast the CSX Index, this research also employed the same methodology to predict the tax revenues of the Royal Government of Cambodia, which are collected by the General Department of Taxation (GDT). The study spanned from January 1998 to August 2023, encompassing a total of 308 months. On average, the monthly tax revenue amounted to 665.83 billion Riel. The standard deviation was calculated to be 633.06 billion Riel. Furthermore, the minimum tax revenue recorded was 41.08 billion Riel, while the maximum reached 3426.51 billion Riel. The 25th, 50th, and 75th percentiles were determined to be 121.28 billion Riel, 412.68 billion Riel, and 1104.35 billion Riel, respectively. Figure 4. Deep Learning Algorithm, CSX Index Figure 5. Machine Learning Regression Algorithm, Tax Revenues The tax revenue machine learning regression algorithm was analyzed in Figure 5, showing a linear predicted line that moved along the actual data during the study period. Further analysis revealed an R-square of 0.79 during the Train period, with a mean square error of 88409.23 and a root mean square error of 297.34. Notably, the Test period showed an increase in R-square from 0.79 to 0.84, and a reduction in root mean square error from 297.34 to 219.31 compared to the Train period.
- 7. American Journal of Humanities and Social Sciences Research (AJHSSR) 2023 A J H S S R J o u r n a l P a g e | 100 Table 3. Linear Machine Learning Results, Tax Revenues Metric Train Test R-square 0.79 0.84 Mean Square Error (MSE) 88409.23 48095.20 Root Mean Square Error (RMSE) 297.34 219.31 After transitioning from the linear regression machine learning algorithm to deep learning, specifically LSTM, the algorithm's predictability has diminished. This decline is evident in the significant increase of the root mean square error from 219.31 to 1601.87. Based on these findings, it can be inferred that the linear regression machine learning algorithm outperforms the deep learning algorithm which is the LSTM. Figure 6. Deep Learning Algorithm, Tax Revenues V. CONCLUSION REMARKS Stock market prediction has become increasingly challenging for investors, despite significant efforts made over the past two decades to develop and improve time-series and machine learning forecasting models. In this study, the machine learning model LSTM was applied and compared with the linear regression machine learning model for the CSX index of the Cambodia Securities Exchange. The time span covered in this study was from February 1, 2019, to October 12, 2023, totaling 1146 days. Out of these, 917 days were classified as Train data, accounting for 80% of the total sample size, while 229 days were classified as Test data. Additionally, the same techniques were used to forecast the tax revenues of the Royal Government of Cambodia, which were collected by the General Department of Taxation. Despite using monthly data, the tax revenues were analyzed over a longer period of 25 years, starting from January 1998 to August 2023. The Train data consisted of 247 months, equivalent to 80% of the total sample size, while the Test data accounted for 61 months, approximately 20% of the total sample size. The forecasted tax revenues provided valuable information for the General Department of Taxation in preparing the government budget. To evaluate the performance of the proposed models, root mean square error and correlation coefficient were used as performance measures. The machine learning model, LSTM, demonstrated superior performance over the linear regression machine learning model in predicting the daily movement of the CSX Index of the Cambodia Securities Exchange, as evidenced by the root mean square error. The Test data revealed that the estimated root mean square error of the linear regression machine learning was 64.78, while the LSTM machine learning produced a lower error of 33.08. However, when applied to tax revenues data, the linear regression machine learning outperformed the LSTM machine learning, with estimated root mean square errors of 219.31 and 1601.87, respectively. This study utilizes a specific set of machine learning models. However, it is important to note that other relevant models can also be employed to achieve the same purposes. Additionally, various econometric models, such as ARIMA, SARIMA, ARIMAX, ARCH, GARCH, TARCH, and PARCH models, can be combined with machine learning models to enhance forecasting accuracy. These models can be applied not only to stock market indices but also to tax revenues. It is worth mentioning that this study solely relies on index data for forecasting purposes. Future research endeavors may consider incorporating share price data from companies listed in the Cambodia Securities Exchange to provide valuable insights for prospective investors in their investment decisions.
- 8. American Journal of Humanities and Social Sciences Research (AJHSSR) 2023 A J H S S R J o u r n a l P a g e | 101 REFERENCES [1]. Agrawal, Manish, Piyush Kumar Shukla, Rajit Nair, Anand Nayyar, and Mehedi Masud. 2022. Stock Prediction Based on Technical Indicators Using Deep Learning Model. Computers, Materials & Continua 70: 287–304 [2]. Banik, Shouvik, Nonita Sharma, Monika Mangla, Sachi Nandan Mohanty, and Selvarajan Shitharth. 2022. LSTM based decision support system for swing trading in stock market. Knowledge-Based Systems 239: 107994 [3]. Di Persio, Luca, and Oleksandr Honchar. 2017. Recurrent neural networks approach to the financial forecast of Google assets. International Journal of Mathematics and Computers in Simulation 11: 7–13 [4]. Hu, Zexin, Yiqi Zhao, and Matloob Khushi. 2021. A survey of forex and stock price prediction using deep learning. Applied System Innovation 4: 9 [5]. Jose, Jithina, Suja Cherukullapurath Mana, and B. Keerthi Samhitha. 2019. An Efficient System to Predict and Analyze Stock Data using Hadoop Techniques. International Journal of Recent Technology and Engineering (IJRTE) 8: 1039–43 [6]. Khan,Wasiat, Mustansar Ali Ghazanfar, Muhammad Awais Azam, Amin Karami, Khaled H. Alyoubi, and Ahmed S. Alfakeeh. 2020. Stock market prediction using machine learning classifiers and social media, news. Journal of Ambient Intelligence and Humanized Computing 13: 3433–56 [7]. Kumar, Saurav, and Dhruba Ningombam. 2018. Short-Term Forecasting of Stock Prices Using Long Short Term Memory. Paper presented at 2018 International Conference on Information Technology (ICIT), Hong Kong, China, December 29–31 [8]. Li, Audeliano Wolian, and Guilherme Sousa Bastos. 2020. Stock Market Forecasting Using Deep Learning and Technical Analysis: A Systematic Review. IEEE Access 8: 185232–242 [9]. Li, Yang, and Yi Pan. 2021. A novel ensemble deep learning model for stock prediction based on stock prices and news. International Journal of Data Science and Analytics 13: 139–49 [10]. Mukherjee, Somenath, Bikash Sadhukhan, Nairita Sarkar, Debajyoti Roy, and Soumil De. 2021. Stock market prediction using deep learning algorithms. CAAI Transactions on Intelligence Technology 8: 82– 94 [11]. Obthong, Mehtabhorn, Nongnuch Tantisantiwong, Watthanasak Jeamwatthanachai, and Gary Wills. 2020. A Survey on Machine Learning for Stock Price Prediction: Algorithms and Techniques. Paper presented at 2nd International Conference on Finance, Economics, Management and IT Business, Prague, Czech Republic, May 5–6 [12]. Polamuri, Subba Rao, Kudipudi Srinivas, and A. Krishna Mohan. 2019. Stock Market Prices Prediction using Random Forest and Extra Tree Regression. International Journal of Recent Technology and Engineering 8: 1224–28 [13]. Pramod, B. S., and Mallikarjuna Shastry Pm. 2021. Stock Price Prediction Using LSTM. Test Engineering and Management 83: 5246–51 [14]. Pramod, B. S., and Mallikarjuna Shastry Pm. 2021. Stock Price Prediction Using LSTM. Test Engineering and Management 83: 5246–51 [15]. Qiu, Jiayu, Bin Wang, and Changjun Zhou. 2020. Forecasting stock prices with long-short term memory neural network based on attention mechanism. PLoS ONE 15: e0227222 [16]. Reddy, Niveditha N., E. Naresh, and Vijaya Kumar B. P. 2020. Predicting Stock Price Using Sentimental Analysis Through Twitter Data. Paper presented at 2020 IEEE International Conference on Electronics, Computing and Communication Technologies (CONECCT), Bangalore, India, July 2–4 [17]. Sathish Kumar, R., R. Girivarman, S. Parameshwaran, and V. Sriram. 2020. Stock Price Prediction Using Deep Learning and Sentimental Analysis. JETIR 7: 346–54 [18]. Seethalakshmi, Ramaswamy. 2018. Analayis of stock market predictor variables using linear regression. International Journal of Pure and Applied Mathematics 119: 369–78. [19]. Shahi, Tej Bahadur, Ashish Shrestha, Arjun Neupane, and William Guo. 2020. Stock Price Forecasting with Deep Learning: A Comparative Study. Mathematics and Computer Science 8: 1441 [20]. Umer, Muhammad, Muhammad Awais, and Muhammad Muzammul. 2019. Stock Market Prediction Using Machine Learning (ML) Algorithms. ADCAIJ Advances in Distributed Computing and Artificial Intelligence Journal 8: 97–116 [21]. Vuong, Pham Hoang, Trinh Tan Dat, Tieu Khoi Mai, and Pham Hoang Uyen. 2022. Stock-Price Forecasting Based on XGBoost and LSTM. Computer Systems Science & Engineering 40: 237–46 [22]. Xu, Ying, Cuijuan Yang, Shaoliang Peng, and Yusuke Nojima. 2020. A hybrid two-stage financial stock forecasting algorithm based on clustering and ensemble learning. Applied Intelligence 50: 3852–67
- 9. American Journal of Humanities and Social Sciences Research (AJHSSR) 2023 A J H S S R J o u r n a l P a g e | 102 [23]. Yang, Liu. 2019. Novel volatility forecasting using deep learning-long short term memory recurrent neural networks. Expert Systems with Applications 132: 99–109 [24]. Zhou, Xingyu, Zhisong Pan, Guyu Hu, Siqi Tang, and Cheng Zhao. 2018. Stock Market Prediction on High-Frequency Data Using Generative Adversarial Nets. Mathematical Problems in Engineering 2018: 4907423 [25]. Zhu, Yongqiong. 2020. Stock price prediction using the RNN model. Journal of Physics Conference Series 1650: 032103 [26]. Zizi, Youssef, Amine Jamali-Alaoui, Badreddine El Goumi, Mohamed Oudgou, and Abdeslam El Moudden. 2021. An Optimal Model of Financial Distress Prediction: A Comparative Study between Neural Networks and Logistic Regression. Risks 9: 200