SlideShare a Scribd company logo
1 of 30
Download to read offline
811
Echocardiographic
Evaluation of Coronary
Artery Disease
Stephanie A. Coulter
oronary artery disease (CAD) is the most prevalent of
cardiac diseases. Routine evaluation of patients with
suspected or known CAD nearly always includes
echocardiography. Echocardiography is a versatile, low-cost,
and portable technique that is available clinically in nearly
all medical centers and subsequently is the most widely uti-
lized cardiac testing modality. The diagnosis of CAD by
echocardiography is based on the concept that acute myocar-
dial ischemia or infarction produces a detectable impairment
in regional left ventricular (LV) mechanical function. Identi-
fication of patients with suspected CAD and acute coronary
syndrome is one of the primary indications for echocardiog-
raphy. Assessment of global LV systolic function and detec-
tion of the presence and extent of regional myocardial
dysfunction are routine clinical indications for echocardiog-
raphy. This method also has an important prognostic value
in patients with acute and chronic CAD. When combined
with exercise or pharmacologic stress testing, echocardiog-
raphy can identify patients with myocardial ischemia and
viability. Because echocardiography can provide a compre-
hensive assessment of cardiac structure, function and possi-
bly perfusion at the bedside, it is likely to be the technique
of choice for years to come.
Measurement of Regional Myocardial Function
Regional Wall-Motion Abnormalities
Regional systolic and diastolic function can be characterized
by measuring one or more of the following parameters: the
timing of regional events, regional myocardial thickening
and thinning, and the velocity and direction of regional myo-
cardial motion.1
With echocardiography, a regional wall-
motion abnormality (RWMA) is characterized as a localized
decrease in the rate and amplitude of endomyocardial motion.
These abnormalities are accompanied by a reduction
in myocardial thickening during systolic contraction and
by thinning of the myocardial segment after a transmural
myocardial infarction (MI). The loss of systolic wall
thickening is more specific for myocardial ischemia than
is the detection of a resting RWMA2–5
because cardiac
rotation, translational motion during contraction of border-
ing segments, and loading conditions affect the latter finding.
An RWMA is not specific for coronary ischemia and also
occurs with a previous MI, a previous sternotomy, myocar-
ditis, cardiomyopathies, left bundle branch block, and
preexcitation.
The American Association of Echocardiography rec-
ommends a 16-segment standardized format for describing
RWMAs.5
To update and unify reporting of wall-motion
analysis among disparate cardiac-imaging modalities, in
2002 the American Heart Association (AHA) issued a state-
ment on myocardial segmentation and nomenclature that
revised the format to include 17 segments (Figs. 35.1 and
35.2).6
In both the 16- and 17-segment formats, the ventricle
is divided into roughly equal thirds perpendicular to the
apical long axis of the heart (basal, midventricular, and apical
on short-axis imaging). The basal segments extend from the
mitral annulus to the tips of the papillary muscles at end-
diastole. The midcavitary segments extend the length of the
papillary muscle. The apical view begins just beyond the
papillary muscles and extends to just before the end of
the cavity. The 17th segment encompasses the true apex, or
apical cap, which includes the portion of the apical myocar-
dium not bordered by the ventricular cavity.
3
5
Measurement of Regional Myocardial Function . . . . . . 811
Assessment of Coronary Ischemia/Acute Myocardial
Infarction . . . . . . . . . . . . . . . . . . . . . . . . . . . . . . . . . . . 813
Location of Acute Myocardial Infarction . . . . . . . . . . . . 814
Extent of Acute Myocardial Infarction . . . . . . . . . . . . . . 815
Acute Complications of Acute Myocardial
Infarction . . . . . . . . . . . . . . . . . . . . . . . . . . . . . . . . . . . 815
Chronic Complications After a Myocardial
Infarction . . . . . . . . . . . . . . . . . . . . . . . . . . . . . . . . . . . . . 819
Prognosis in Acute Myocardial Infarction and
Chronic Coronary Artery Disease . . . . . . . . . . . . . . . 821
Stress Echocardiography: Assessment of Ischemic
and Viable Myocardium . . . . . . . . . . . . . . . . . . . . . . . 823
C
CAR035.indd 811CAR035.indd 811 11/29/2006 3:33:06 PM11/29/2006 3:33:06 PM
812 c h a p t e r 35
Four chamber
Apical cap
Apical
lateral
Mid
anterolateral
Basal
anterolateral
Basal
inferoseptum
Apical
septum
Mid
inferoseptum
Two chamber
Apical cap
Apical
inferior
Mid
inferior
Basal
inferior
Apical
anterior
Mid
anterior
Basal
anterior
Long axis
Apical cap
Apical
lateral
Mid
inferolateral
Basal
inferolateral Basal
anteroseptum
Mid
anteroseptum
Apical
anterior
Anterior Anterior
Anterior
Base Mid Apex
Antero-
septum
Antero-
septum
Infero-
septum
Infero-
septum
Interior Interior
Interior
Infero-
lateral
Infero-
lateral
Antero-
lateral
Antero-
lateral
LateralSeptal
1 2
4
5
6
2
1
3
3
4 5 6
1. basal anterior 7. mid anterior
Left ventricular segmentation
8. mid anteroseptal2. basal anteroseptal
3. basal inferoseptal 9. mid inferoseptal
4. basal inferior
5. basal inferolateral
6. basal anterolateral
10. mid inferior
11. mid inferolateral
12. mid anterolateral
17. apex
16. apical lateral
15. apical anferior
13. apical anterior
4
5
11
10
159
3
2
8
14 17 16
13 12
6
7
1
14. apical septal
ommended a four-point wall-motion scoring system,8,9
but
the American Society of Echocardiography (ASE) recently
continued to advocate a five-point scoring system, which
included the discrimination of aneurysmal segments.7
The
16-segment format is recommended for evaluating regional
LV dysfunction with two-dimensional (2D) echocardiogra-
phy, because the 17th apical segment does not exhibit inward
motion.7
Although the coronary artery blood supply to the
myocardial segments varies, the typical relationship between
the three coronary arteries and the myocardial segments is
illustrated in Figure 35.3.
Regional Myocardial Doppler Velocities
Differentiation of passive motion from active myocardial
shortening or thickening is limited by the temporal resolu-
tion (about 90ms) required to detect differences in motion
with the unaided human eye.10
Measurement of the speed of
motion of low-frequency myocardial tissue can be obtained
with pulsed-wave tissue Doppler imaging (TDI), which ex-
cludes the high-frequency velocities of the rapidly moving
blood. Assessment of peak regional myocardial velocities
with TDI techniques can be achieved in simultaneous seg-
ments at high frame rates. The accuracy of tissue Doppler
imaging is limited by translational motion and tethering
effects.11–16
Clinical limitations of this technique are attrib-
uted to the complexity of myofiber orientation, which creates
motion in three dimensions: longitudinal shortening (base >
middle > apex), radial thickening (all segments), and circum-
ferential rotation (apex). Ability to image in only one plane
and misalignment of the Doppler probe with the vector of
cardiac motion diminish the accuracy of Doppler velocity
imaging and may limit its clinical applicability at this time.17
Strain imaging is a method for calculating regional myocar-
dial function from TDI velocity data, which theoretically is
FIGURE 35.1. Analysis of wall motion. The left ventricle (LV) can be
divided into 17 segments and identified by a series of longitudinal
views: 1, apical four chamber; 2, apical two chamber; 3, apical long
axis, or a series of short-axis views; 4, base (short axis at the tips of the
mitral leaflets); 5, mid-cavity (short axis at the papillary muscles); and
6, apex (short axis beyond the papillary muscles but before cavity
ends). The longitudinal and short-axis views overlap and complement
each other. The apical cap, the 17th segment, can be appreciated only
by echocardiography with contrast opacification of the LV cavity. A
16-segment model can be used without the apical cap. long axis;
apical four chamber; apical three chamber; apical two chamber.
FIGURE 35.2. Display, on a circumferential polar plot, of the 17
myocardial segments and the recommended nomenclature for
tomographic imaging of the heart.
The wall-motion score index is an expression of regional
LV function that is directly proportional to the severity and
extent of an RWMA. Each myocardial segment is scored on
a scale of 1 to 5, according to a qualitative assessment of
regional function and systolic thickening (normal, 1; hypo-
kinesis, 2; akinesis, negligible thinning, 3; dyskinesis,
paradoxical systolic motion, 4; and aneurysm, diastolic
deformation, 5) (Table 35.1). The composite score, divided by
the number of segments, provides a semiquantitative evalu-
ation of regional wall motion.5,7
Previous authors have rec-
CAR035.indd 812CAR035.indd 812 11/29/2006 3:33:06 PM11/29/2006 3:33:06 PM
ec hoc a r diog r a p h ic eva luat ion of corona ry a rt e ry dise a se 813
not confounded by translational movement or tethering.17
Strain rates reflect the speed of regional myocardial longitu-
dinal deformation and are calculated from myocardial TDI
velocities measured at two locations separated by a given
distance.7
The longitudinal segmental strain rate is uniform
throughout all segments, whereas TDI is greatest at the base
and deteriorates as the motion becomes more circumferen-
tial toward the apex.12,15,18
With ultrasonic strain-rate imaging,
both the amount of deformation (strain) and the rate of local
deformation (strain rate) can be quantified.13
Myocardial Performance Index
The myocardial performance index (MPI) provides a nonin-
vasive, semiquantitative assessment of global LV function,
incorporating systolic and diastolic function. The MPI is the
sum of the diastolic intervals, isovolumic relaxation time,
and isovolumic contraction time, divided by the systolic LV
ejection time. The MPI is reproducible and less dependent on
the heart rate and preload than are traditional Doppler mea-
surements.19,20
In the normal heart isovolumic diastolic times
shorten with increasing contractility.21,22
With ischemia, the
MPI has been shown to deteriorate as the isovolumic relax-
ation time increases relative to ejection times.23
In patients
with known LV dysfunction after an acute MI who were
enrolled in the Survival and Ventricular Enlargement (SAVE)
trial,24
an MPI of >0.5 was associated with a larger infarct
size and reduced baseline LV systolic function. The MPI was
also identified as an independent predictor for cardiovascular
events after an MI in patients with LV systolic dysfunction.
Because diastolic abnormalities precede the development of
systolic alterations in the ischemic cascade, the MPI may be
more sensitive for the detection of myocardial ischemia. It
has been utilized with dobutamine stress echocardiography
(DSE) for the detection of ischemia after an MI. The MPI
provided added prognostic value to DSE and accurately
reflected the LV contractile state during low-dose DSE.23
The
MPI may reflect the overall LV functional reserve.
Unfortunately, systolic wall motion and thickening is
often difficult to detect and quantify. Doppler techniques
lack clinical applicability, and determining the myocardial
performance index is time-consuming. Therefore, 2D gray-
scale echocardiographic assessment remains the standard
clinical modality for detecting RWMAs.
Assessment of Coronary Ischemia/Acute
Myocardial Infarction
The echocardiographic evaluation of coronary ischemia and
of regional myocardial dysfunction during an MI varies
widely over a range of coronary blood flows.25
Regional wall-
motion abnormalities occur with coronary artery stenosis of
>85% at rest and >50% during exercise or hyperemia.7
They
arise within seconds after a coronary occlusion is induced
TABLE 35.1. 1. Wall motion score
Score Wall motion Definition
1 Normal/hyperkinesis Normal systolic motion and thickening
2 Hypokinesis Reduced systolic motion or thickening
3 Akinesis Absent inward systolic motion or thickening
4 Dyskinesis Paradoxic (“bulging”) or outward motion
5 Aneurysmal Diastolic deformation
Each segment should be analyzed and individually scored according to its systolic motion and thickening. Confirma-
tion should be made with multiple views.
Four chamber1
Base
RCA
LAD
Cx
RCA or Cx
LAD or Cx
RCA or LAD
4 Mid5 Apex6
Two chamber2 Long axis3
FIGURE 35.3. Typical distri-
butions of the right coronary
artery (RCA), the left anterior
descending (LAD), and the
circumflex (Cx) coronary
arteries. The arterial distribu-
tion varies between patients.
Some segments have variable
coronary perfusion.
CAR035.indd 813CAR035.indd 813 11/29/2006 3:33:06 PM11/29/2006 3:33:06 PM
814 c h a p t e r 35
by balloon inflation during angioplasty and may last for up
to several days with prolonged ischemia.26,27
These abnor-
malities precede the development of electrocardiographic
irregularities and the onset of cardiac symptoms. Figure 35.4
illustrates the cascade from myocardial ischemia to infarc-
tion. During an episode of acute ischemic chest pain, 2D
imaging should show RMWAs that normalize on resolution
of the ischemia unless the duration of ischemia is suffi-
ciently long to induce myocardial stunning.28
The transient
nature of the RMWA differentiates a brief episode of acute
myocardial ischemia from an acute MI. The presence of an
RWMA does not establish the diagnosis of acute ischemia.
However, the presence of an aneurysm and myocardial thin-
ning suggests a previous ischemic event. For diagnosing
acute coronary ischemia, echocardiography has a high sensi-
tivity but a low specificity.29,30
In a large study,29
1017 patients with suspected cardiac
chest pain without ST-segment elevation were evaluated
with standard clinical and electrocardiographic variables in
the emergency room. The presence of RWMAs was assessed
with 2D echocardiography. The sensitivity of RWMAs for
detecting acute coronary syndrome was 88%, but the speci-
ficity was only 18%. Patients with RWMAs were 6.1 times
more likely to experience an early cardiac event than those
without RWMAs. The presence of a RWMA significantly
increased the ability of clinical and electrocardiographic
variables to predict early (within 48 hours) major adverse
cardiac events. In patients with symptoms of an acute co-
ronary syndrome, nondiagnostic electrocardiography, and
normal biochemical markers, demonstration of normal
global systolic function by handheld echocardiography had a
91% negative predictive value for acute MI.31
The addition of
perfusion imaging to routine echocardiographic assessment
of RWMAs and clinical variables in patients with suspected
cardiac chest pain and nondiagnostic electrocardiograms
improved the prediction of cardiac events. The addition of
perfusion imaging in patients with suspected cardiac chest
pain and nondiagnostic electrocardiograms further enhanced
the clinical Thrombolysis in Myocardial Infarction (TIMI)
risk score and the ability of RWMAs to predict cardiac events
(Fig. 35.5).32
Because early detection of RWMAs adds significant diag-
nostic and prognostic value to the routine evaluation of
patients who present to the emergency department with sus-
pected cardiac chest pain, a joint task force of the American
College of Cardiology (ACC), AHA, and ASE in 2003 issued
a class I recommendation for the use of echocardiography in
diagnosing suspected ischemia or infarction when standard
means of diagnosis were inconclusive.33,34
Location of Acute Myocardial Infarction
Two-dimensional and Doppler echocardiography provides
assessment of the location and extent of myocardial damage,
associated and preexisting valvular dysfunction, and ven-
tricular and pulmonary artery pressures. Cardiac enzymes
and the electrocardiogram are crude determinants of infarct
size and location.35
Validation studies with thallium-201
scintigraphy, technetium-99m pyrophosphate (99m
Tc-PYP)
scintigraphy, serum creatine kinase–MB levels, and coronary
arteriography demonstrate that 2D echocardiography accu-
rately detects and identifies the anatomic location of MIs.36–39
Two-dimensional echocardiography is less precise (sensitiv-
ity, 60% to 75%) in detecting nontransmural MIs, presum-
ably because transmural muscle loss is less than 20% and
preservation of the contractility of subepicardial myocardial
layers can mask subendocardial dysfunction.40
With an acute
MI, the uninvolved myocardium shows a compensatory
hyperdynamic contractile response, the absence of which
may indicate multivessel disease.41
The location of RWMAs
correlates with the distribution of the occluded coro-
nary artery, especially if the obstruction involves the left
anterior descending (LAD) or posterior descending coronary
arteries.42
Perfusion
deficits
Metabolic
abnormalities
Wall motion
abnormalities
ECG changes
Global LV dysfunction
Stunning/Hibernation
Necrosis MI
Chest pain
Elevation of
LVEDP (SOB)
Resting flow reduction
Rest
Exercise time
Workload(HRxBP)
FIGURE 35.4. Ischemic cascade. Schematic representation of the
clinical, electrocardiographic, and echocardiographic manifesta-
tions of myocardial ischemia as the workload (rate-pressure product)
and duration of stress is increased. SOB, shortness of breath.
1.0
0.8
0.6
0.4
0.2
0.0
0 2 4 6 8 10 12
Months of follow-up
Event-freesurvival
14 16 18 20
Abnormal RF,
Abnormal MP
Abnormal RF,
Normal MP
Normal RF,
Normal MP
22 24
FIGURE 35.5. Perfusion imaging enhances the clinical prediction
of future cardiac events in patients with suspected cardiac chest
pain. Event-free survival in patients with an intermediate-risk mod-
ified Thrombolysis in Myocardial Infarction (TIMI) score (3 or 4).
MP, myocardial perfusion; RF, regional left ventricular function.
CAR035.indd 814CAR035.indd 814 11/29/2006 3:33:07 PM11/29/2006 3:33:07 PM
ec hoc a r diog r a p h ic eva luat ion of corona ry a rt e ry dise a se 815
Left anterior descending artery obstruction creates severe
wall-motion abnormalities (akinesis with complete obstruc-
tion) of the septum, anterior wall, and apex. These segments
are best visualized from the parasternal long-axis (anterosep-
tum), and apical four- (septum and apex) and two-chamber
(anterior wall and apex) views. The location of the obstruc-
tion along the vessel length (proximal, middle, or distal)
corresponds to the severity and extent of the resulting
RWMA. The LAD may supply a variable (and often large)
proportion of the LV apex. Occlusion of the LAD may lead
to distal inferior and distal inferolateral wall-motion
abnormalities.
Left circumflex artery (LCx) occlusion typically affects
perfusion of the anterolateral and inferolateral segments.
Imaging in the parasternal long-axis (inferolateral wall) and
the apical four- and apical long-axis views (inferolateral wall)
augment the short-axis exam for visualization of the typical
LCx infarction. In approximately 20% of patients, the LCx
supplies the posterior descending artery (left dominant
system), and interruption of the LCx blood flow can lead to
an extensive RWMA that may also include the inferior
septum and inferior free wall.
Occlusion of the right coronary artery (RCA) results in
an inferior RWMA. With proximal RCA occlusion, infarc-
tion of the right ventricle may result (see below). The poste-
rior descending artery, a branch of the RCA (right dominant
system) in 80% of patients, supplies the bulk of coronary
flow to the inferior wall. Right coronary artery occlusion
usually spares the apex. Two-dimensional imaging in the
short-axis, basal, and midventricular views, confirmed by
the apical two-chamber view, best reveals inferior wall-
motion abnormalities resulting from RCA occlusion. Careful
attention to right ventricle (RV) size and function are impor-
tant with acute inferior wall infarction.
Bypass grafts and collateral blood flow will blur these
generalizations. A common post-bypass RWMA pattern in-
cludes paradoxic septal motion with marked hypokinesis to
akinesis of the septum and normal motion of the anterior
wall (in the absence of a previous anterior infarct).
Extent of Acute Myocardial Infarction
Cardiac enzymes and electrocardiography are crude indica-
tors of infarct size and location.42
Validation studies with
thallium-201 scintigraphy, pyrophosphate (99m
Tc-PYP) scin-
tigraphy, serum creatine kinase–MB levels, and coronary
arteriography have shown that 2D echocardiography accu-
rately detects and identifies the anatomic location of
MIs.36,37,43,44
The location of RWMAs correlates with the dis-
tribution of the occluded coronary artery, especially if the
obstruction involves the LAD or posterior descending coro-
nary arteries.42
In postinfarct patients, LV systolic function is routinely
measured by the LV ejection fraction (LVEF) on 2D echocar-
diography. The extent of the infarction can be quantified
with the wall-motion score index. Echocardiography overes-
timates the infarct size in the presence of a previous infarc-
tion and after reperfusion. Reperfusion after an infarct often
leads to early (usually <14 days) improvement in the LVEF as
stunned myocardial segments recover.45,46
In a review of 249
patients following revascularization for MI serial echocar-
diographic studies in 58% showed complete or partial recov-
ery of function. Most of those who improved had more than
a 5% increase in LVEF.46
Echocardiographic assessment of
the infarct size is limited by this method’s inadequate sen-
sitivity in differentiating old versus new infarctions.43
The 2003 ACC/AHA/ASE task force issued a class I
recommendation for the use of echocardiography to assess
infarct size and ventricular function when the results are
used to guide therapy. It gave a class IIa recommendation
(weight of evidence/opinion is in favor of usefulness/efficacy)
for echocardiographic assessment of ventricular function
after revascularization.33,34
Acute Complications of Acute
Myocardial Infarction
Left Ventricular Failure/Cardiogenic Shock
Cardiogenic shock, a state of inadequate tissue perfusion
related to cardiac dysfunction, complicates approximately
6% to 7% of acute MIs.47–50
Left ventricular pump failure
usually accounts for acute hemodynamic deterioration. In a
small number of patients, however, the cause may be a com-
plication of an acute MI such as rupture of the ventricular
septum, free wall, or papillary muscle with acute severe
mitral regurgitation (MR). A high index of suspicion for one
of these major complications in a patient with hypotension,
tachycardia, a new systolic murmur, or congestive heart
failure is required for rapid diagnosis and appropriate medical
and surgical intervention.51
Two-dimensional echocardiogra-
phy and pulsed-wave and color-flow Doppler imaging provide
a comprehensive assessment of the anatomic and hemody-
namic status at the bedside and therefore are recommended
for patients with hemodynamic deterioration.
Cardiac Rupture
Free-Wall Rupture
Rupture of the free wall of the left or right ventricle is found
in less than 1% of living patients with an acute MI,52
but in
as many as 26% autopsied patients who died with an acute
MI.53,54
The most important risk factors for free-wall rupture
are large infarct size53
and delayed hospital admission with
symptoms lasting for >24 hours,55
which are consequences
of inadequate reperfusion. The risk of rupture is further
increased by first MIs associated with poor collateral blood
flow,55
undue in-hospital physical activity,55
age >70 years,
and female sex.56,57
In the National Registry of Myocardial
Infarction database, thrombolytic therapy accelerates the
time course of cardiac rupture (often to within 24 hours) and
increases the risk of rupture-related death (from 7.3% without
thrombolytic treatment to 12.1% with such treatment).52
The
risk of myocardial rupture was significantly decreased
by successful reperfusion with thrombolytic agents in acute
MI patients <75 years of age58–62
or by angioplasty in all age
groups studied.63,64
In a retrospective review of 2209 acute MI
patients treated with percutaneous coronary intervention,64
the risk of cardiac rupture was 0.7% when successful
CAR035.indd 815CAR035.indd 815 11/29/2006 3:33:07 PM11/29/2006 3:33:07 PM
816 c h a p t e r 35
reperfusion was achieved within 12 hours, 0.9% when reper-
fusion occurred within 12 to 24 hours, and 3.8% after failed
reperfusion.
Infarcts of the lateral and anterior LV walls, subtended by
the LCx or LAD coronary artery, are the most common
infarcts associated with free-wall rupture.55
Myocardial
rupture rarely involves the RV or the atria.65,66
The rupture
site is typically located between infarcted and contractile
myocardium.
Myocardial rupture originates as an abrupt slit-like tear,
usually in the anterior myocardium. It occurs early and sud-
denly, within 3 days following an acute MI in 50% of patients.
In these cases, sudden chest discomfort, with rapidly progres-
sive cardiogenic shock related to hemopericardium and tam-
ponade, are followed by electromechanical dissociation67
and
death. Rapid 2D echocardiography identifies a pericardial
effusion and confirms the diagnosis.68
Contained Free-Wall Rupture:
Ventricular Pseudoaneurysm
Late rupture, more than 5 days after an acute MI, with
infarct expansion, occurs mainly in patients who have had
unsuccessful reperfusion. Late rupture with intramural dis-
section is more gradual or incomplete and produces the char-
acteristic echocardiographic finding of a pseudoaneurysm, or
false aneurysm. An LV pseudoaneurysm results from a local-
ized rupture of the ventricular free wall, which produces a
localized hemopericardium that is limited by parietal peri-
cardium and by blood clot formation. There is an absence of
heart muscle in the wall of a false aneurysm. Although ven-
tricular pseudoaneurysms are usually the consequence of an
acute MI (inferior infarctions being twice as common as
anterior ones), they may also result from cardiac surgery
(most commonly mitral valve replacement), trauma, or lac-
eration.69
A pericardial effusion with organizing thrombus
may help the pericardium seal the ventricular perforation
temporarily, but progression to frank rupture and cardiac
tamponade may occur without warning.70
Echocardiographic recognition of a pseudoaneurysm
associated with a subacute or late LV rupture is difficult.
In a large series of pseudoaneurysms,69
abnormalities were
present on the 2D or Doppler echocardiograms of approxi-
mately 85% to 90% of patients, but a definitive diagnosis was
made in only about 25%. In suspected cases, coronary angi-
ography provides a definitive diagnosis in 87% of patients.69
Transesophageal echocardiography may improve the diag-
nostic accuracy but has not been studied in this regard. Two-
dimensional echocardiography can detect discontinuity of
the ventricular free wall and confirm the presence or absence
of pericardial tamponade.71
In most cases, a narrow neck
abruptly connects the LV cavity to the large aneurysmal sac,
which is located outside the LV cavity, is usually pulsatile,
and may contain thrombus. Color-flow Doppler imaging
shows characteristic bidirectional flow in both systole and
diastole, resulting from a communication between the false
aneurysm and the ventricular cavity.
Ventricular Septal Defect
Rupture of the interventricular septum is reported to com-
plicate 1% to 3% of acute ST-elevation MIs.72
Ventricular
septal defects (VSDs) accounted for 10% of total cardiac
deaths73
before the reperfusion era but only 0.2% of those
observed in the Global Utilization of Streptokinase and
Tissue Plasminogen Activator for Occluded Coronary Arter-
ies trial (GUSTO-I).74
Usually occurring within the first
week, VSDs are more common after large infarctions of the
anterior wall,75
after poorly reperfused infarcts, in the elderly,
and in women.72
Although thrombolytic therapy prevents
septal rupture in many patients who undergo successful
coronary reperfusion, thrombolytic treatment likely acceler-
ates rupture when reperfusion fails. The median time from
the onset of symptoms to the development of an interven-
tricular septal rupture was 1 day in the GUSTO-I trial.74
Septal rupture leads to a sudden left-to-right shunt, whose
magnitude is proportional to the size of the septal defect and
to the ratio of the systemic and peripheral vascular resis-
tance. In this clinical setting, Doppler echocardiography is
usually diagnostic, its sensitivity and specificity reportedly
being as high as 100%.76
Rarely, when the transthoracic
image quality is challenged by mechanical ventilation or
obesity, transesophageal echocardiography is required for
diagnosis. In up to 40% of patients, 2D echocardiography
alone may show a dropout of echoes in the interventricular
septum, in the region of abnormal wall motion (Fig. 35.6A).65
Color-flow Doppler imaging77
has been shown to enhance the
diagnostic accuracy up to 100% by defining the site of septal
rupture as an area of turbulent transseptal flow or by detect-
ing a high-velocity jet on the right side of the ventricular
septum (Fig. 35.6B). Color Doppler examination may show a
single rupture site (typically seen with anteroapical defects)
or multiple rupture sites (characteristically seen with
inferior and inferobasal defects).78,79
Pulsed-wave Doppler
imaging, undertaken on the right side of the interventricular
septum (at the site of the defect), usually characterizes a
high-velocity jet directed from the left ventricle to the right
ventricle (Fig. 35.6C). Right ventricular systolic pressure can
be estimated by subtracting the peak gradient obtained across
the interventricular septum from the systolic (systemic)
blood pressure, provided that no aortic stenosis is present. A
semiquantitative estimate of the size of the left-to-right
shunt can be obtained by measuring the volumetric flow
across the pulmonary valve and the LV outflow tract, pro-
vided that no valvular regurgitation is present. Contrast 2D
echocardiography can also identify a VSD. Thus, 2D echo-
cardiography and color-flow Doppler imaging can rapidly and
reliably provide an anatomic diagnosis and estimation of the
hemodynamic status at the bedside. Because the prognosis
depends on early surgical intervention, echocardiography
has become invaluable for the rapid evaluation of this
complication.
Right Ventricular Infarction
Right ventricular infarction, usually caused by proximal
occlusion of the RCA, may complicate up to 40% of inferior
MIs. The echocardiographic manifestations of RV infarction
include RV dilatation, hypokinesis of the RV free wall,80–83
and manifestations of right atrial hypertension48
(dilated
right atrium, plethoric systemic veins) (Fig. 35.7A,B). These
findings are not specific for RV infarction, and they com-
monly occur with acute and chronic pulmonary hyperten-
CAR035.indd 816CAR035.indd 816 11/29/2006 3:33:07 PM11/29/2006 3:33:07 PM
ec hoc a r diog r a p h ic eva luat ion of corona ry a rt e ry dise a se 817
A B
C
FIGURE 35.6. Ventricular septal defect (VSD). (A) Apical VSD
(arrow) is identified by the dropout of interventricular septum visu-
alized by two-dimensional echocardiography. Color Doppler dem-
onstrates an area of turbulence at the site of the VSD rupture in the
apical septum. (B) Color Doppler demonstrates a high-velocity jet of
mosaic color directed into the apex of the right ventricle with migra-
tion of blue color toward the base of the right ventricle (RV) (opposite
direction of RV inflow). (C) Spectral Doppler identifies the direction
of the shunt and the magnitude of the pressure gradient from the
left to the right ventricle. The RV systolic pressure can and should
be estimated as the systolic blood pressure (SBP)-4 (peak VSD jet).2
RA, right atrium; LA, left atrium; PK, peak gradient; LV, left ven-
tricle; RV, right ventricle.
sion (pulmonary embolism). An RV infarction almost always
accompanies an infarction of the inferior LV wall (Fig. 35.7C).
Thus, RV dysfunction with akinesis of the inferior LV wall
is characteristic of an RV infarction, having a sensitivity of
more than 80% to 85%.84
Prompt diagnosis of RV infarctions
will differentiate these lesions from other reversible causes
of cardiogenic shock such as cardiac tamponade.
Mural Thrombus
Mural thrombus is a common complication of an acute MI
and had an incidence of up to 40% in patients with anterior
and apical infarctions in the prethrombolytic era. After
thrombolytic therapy for an acute MI, the Gruppo Italiano
per lo Studio della Sopravvivenza nell’Infarto Miocardio III
(GISSI-3) study85
reported visualization of LV thrombus on
the predischarge echocardiogram of 5.1% of patients (9 ± 5
days after symptom onset). Patients with an anterior MI had
a fivefold higher prevalence of thrombus formation than did
patients with other infarct locations (11.5% vs. 2.3%, respec-
tively). Worsening LV function and more extensive regional
dysfunction are also recognized risk factors for LV throm-
bus.85
Most thrombi occur within the first 2 weeks (median,
5 to 6 days) after an acute MI.86,87
However, with worsening
LV function, new LV thrombus is identified in some patients
after hospital discharge.87,88
CAR035.indd 817CAR035.indd 817 11/29/2006 3:33:07 PM11/29/2006 3:33:07 PM
818 c h a p t e r 35
A B
C
FIGURE 35.7. Right ventricular infarction. The manifestations of
right ventricular (RV) infarction can be identified by echocardiogra-
phy and include RV dilatation (*), hypokinesis of the RV free wall
(arrows), and evidence of elevated right atrial pressure; dilated right
atrium (RA*) (A), or plethoric inferior vena cava (IVC*, arrow) (B).
Left ventricular inferior wall motion abnormality (arrows) should
also be present (C).
Thrombus, observed at the site of abnormal wall motion
or within an aneurysm, appears as a mobile or an immobile
opaque intracavity mass (Fig. 35.8), which may be lami-
nar or pedunculated or may protrude into the ventricular
cavity.85,89–91
Thrombi are usually located at the apex and, less
frequently, along the septum and the inferior regions of the
heart.92
In detecting LV thrombus, 2D transthoracic echocar-
diography has a sensitivity of 75% to 95% and a specificity
of 87 to 90%,90,91,93
and therefore is the method of choice.
When the apex is poorly visualized with transthoracic echo-
cardiography, administration of a contrast agent may help
identify suspected apical thrombus by demonstrating an
absence of contrast in an LV cavity filled with contrast. In
transesophageal echocardiography, the posterior position of
the ultrasound probe limits visualization of the apex and
thus detection of apical thrombus. The 2003 ACC/AHA/ASE
task force gave a class I recommendation to the use of
echocardiography for assessing mural thrombus after an
acute MI.33,34
FIGURE 35.8. Left ventricular mural thrombus. Two-dimensional
imaging in the apical four-chamber view demonstrates an echolu-
cency in the LV apex of a patient with a large apical infarct (arrow).
RV, right ventricle; RA, right atrium; LV, left ventricle; LA, left
atrium.
CAR035.indd 818CAR035.indd 818 11/29/2006 3:33:08 PM11/29/2006 3:33:08 PM
ec hoc a r diog r a p h ic eva luat ion of corona ry a rt e ry dise a se 819
Embolization has been reported to occur in 26 of 119
patients with documented LV thrombi after an MI.91
Thrombi
that are protruding, pedunculated, or mobile within the ven-
tricular cavity are most likely to embolize, usually within
3 months after an acute MI.91,93–95
Papillary Muscle Rupture Producing Acute
Mitral Regurgitation
Severe MR resulting from papillary muscle rupture is a rare
and often fatal complication of an acute MI.96
In the absence
of prompt surgical intervention, the mortality of this com-
plication is as high as 50% at 24 hours,97,98
which is nearly
double the mortality seen in patients with a postinfarction
VSD.99
The median duration of survival is reportedly 3
days.100
The anterolateral papillary muscle is rarely affected,
because it has a dual blood supply from the LAD and circum-
flex arteries.101
Infarction of the posterior descending artery
is associated with necrosis of the posteromedial papillary
muscle, which produces sudden clinical and hemodynamic
deterioration and fulminant acute left-sided heart failure. It
is important to recognize that severe MR with complete
rupture of the papillary muscle may occur in the absence of
a cardiac murmur or in the presence of a very soft murmur;
therefore, this diagnosis must be considered with a high
index of suspicion in the appropriate clinical setting. It is
crucial that a definitive diagnosis be reached rapidly in these
patients. Two-dimensional echocardiography shows flail
mitral leaflet with attachment of the mobile severed papil-
lary muscle head, which prolapses into the left atrium in
systole, and abnormal cutoff of one papillary muscle (Fig.
35.9A).102,103
In up to 35% of surgically confirmed cases, the
partially ruptured papillary muscle cannot be observed to
prolapse into the left atrium on transthoracic echocardiog-
raphy imaging.104
Transesophageal echocardiography has
become an invaluable technique for diagnosing acute MR
that complicates an MI, especially in hemodynamically
compromised patients in the intensive care unit, in whom
transthoracic echocardiography imaging may be limited.
Transesophageal echocardiographic imaging in the gastric
long-axis and mid-esophageal four-chamber views can detect
the origin of the regurgitant jet and clarify the anatomic
profile of the mitral and submitral valvular apparatus
(Fig. 35.9B).89
Chronic Complications After a
Myocardial Infarction
Ischemic Mitral Regurgitation
Mitral regurgitation caused by changes in ventricular struc-
ture and function as a consequence of coronary ischemia is
best described as ischemic MR.105
Usually a consequence of
a previous infarction and chronic LV remodeling, ischemic
MR may also be precipitated by active ischemia, creating
flash pulmonary edema or, rarely, rupture of the papillary
muscle (see above).
Incidence
Ischemic MR occurs in 20% to 25% of patients followed after
an MI106–109
and in 50% of those with congestive heart
failure.110
Moderate or severe MR is found in roughly 40% of
patients within 24 hours of an acute MI complicated by car-
diogenic shock.111
However, angiographic detection of moder-
ate-to-severe MR after an MI has been reported in only 3%
to 4% of patients.112,113
When evaluated by echocardiography
within 30 days after an MI, moderate or severe MR was
present in 12%.114
Mild MR has been reported in 50% to 64%
of post-MI patients undergoing echocardiography within 30
days of the MI.106–111,113–115
Mechanism
Mitral regurgitation after an acute MI is due primarily to
segmental and global LV dysfunction, which causes chronic
papillary muscle displacement, apical tethering of the mitral
leaflets, annular dilatation, and decreased systolic mitral
closing forces (Fig. 35.10).105
Elegant models of MR have
shown that ischemia of the papillary muscle in the absence
A B
FIGURE 35.9. Papillary muscle rupture. (A) Transesophageal
imaging in the mid-esophageal four-chamber view demonstrates the
prolapse of the severed head of the papillary muscle (arrow) into the
left atrium (LA) during ventricular systole. The mitral subvalvular
apparatus with rupture of the papillary muscle head (arrow) is
shown by two-dimensional imaging in the deep gastric long-axis
view (B). LV, left ventricle; MV, mitral valve.
CAR035.indd 819CAR035.indd 819 11/29/2006 3:33:09 PM11/29/2006 3:33:09 PM
820 c h a p t e r 35
of infarction does not cause MR.105,116–118
Ischemic MR
depends on a balance of forces and LV geometry and varies
with loading conditions (Fig. 35.11).119
Characteristically
dynamic in nature, MR may be elusive on transesophageal
echocardiography in cardiac surgical patients under anesthe-
sia.120–122
MR is also likely underestimated by resting echo-
cardiography in patients with LV dysfunction and symptoms
of congestive heart failure in the absence of active isch-
emia.123–125
With semisupine bicycle exercise, Pierard and
Lancellotti125
demonstrated a twofold increase in MR volume
(from mild to moderate-to-severe) and a corresponding
increase in orifice area (by >20mm2
) in nearly 30% of patients.
Exercise-increased MR also correlated with increased
pulmonary artery pressure and conferred an adverse
prognosis.125
Ventricular Aneurysm
After an acute, usually anterior, MI,95,126
a true LV aneurysm
develops in up to 20% of patients, owing to gradual expan-
sion and thinning of all three layers of the infarcted myocar-
dium.127
The incidence of true LV aneurysm has decreased as
reperfusion therapies have improved and become wide-
spread.128
The usual time of aneurysm formation is within 3
months after the onset of an MI. True LV aneurysms almost
always involve the LV apex and extend into the anterior or
anterolateral walls (Fig. 35.12A). Rarely, true aneurysms are
found in the basal inferior or high lateral wall (Fig. 35.12B).
Aneurysms are usually the consequence of left anterior
artery occlusion and are rarely present with multivessel
CAD and extensive collateralization.
Ischemic mitral regurgitation:
incomplete mitral leaflet closure
Normal
LV
closing
force
Tethering
force
AO
MR
LA
Ischemic
Papillary
muscle
displacement
Mitral valve
tethering
Restricted
closure
FIGURE 35.10. Mechanism of ischemic mitral regurgitation. Left:
The balance of forces acting on the mitral leaflets in systole. LA,
left atrium, LV, left ventricle, AO, aorta. Right: Effect of papillary
muscle displacement and mitral leaflet tethering to restrict mitral
leaflet closure. MR, mitral regurgitation.
FIGURE 35.11. Illustration of ischemic mitral regurgitation. Two-
dimensional imaging in the parasternal long axis view demonstrates
apical tethering of the chordae tendineae (left, arrow) and the resul-
tant jet of mitral regurgitation (right) caused by the incomplete
mitral leaflet closure.
A B
FIGURE 35.12. Left ventricular aneurysm (LVA). (A) Two-dimen-
sional imaging in the four-chamber apical view demonstrates a thin
distal septum and apical LV segment with a hinge point (arrow)
demarcating the transition from contractile tissue to the aneurys-
mal segment. (B) Two-dimensional imaging of the two-chamber
view identifies an aneurysm of the inferior base (arrows) and an
apical thrombus (arrow), which is present in up to one third of
patients with acute myocardial infarction.
CAR035.indd 820CAR035.indd 820 11/29/2006 3:33:09 PM11/29/2006 3:33:09 PM
ec hoc a r diog r a p h ic eva luat ion of corona ry a rt e ry dise a se 821
Two-dimensional echocardiography has a sensitivity of
>93%129
and a specificity of 94% in the detection of LV aneu-
rysm. The characteristic echocardiographic finding is a
thin LV wall that fails to thicken during systolic contrac-
tion, producing a “bulge” during systole and diastole.127,130
A
common finding is a hinge point (Fig. 35.12A), or junction,
between contractile LV tissue and the akinetic, often para-
doxic, motion of the aneurysm. True LV aneurysms distort
LV geometry during both systole and diastole.129
Doppler
echocardiography can be used to detect a low-velocity flow
profile with a “swirling” motion characteristic of low cardiac
flow within the aneurysm. Thrombus within the aneurys-
mal segment is detected echocardiographically in at least a
third of patients with LV aneurysms (Fig. 35.12B),131,132
and
such thrombus may account for the increased risk of stroke
in the 5 years after an acute MI.133
Deposition of fibrous
tissue and calcium in the aneurysmal segment over time
prevents rupture of a chronic LVA, unlike a pseudoaneu-
rysm.134,135
Left ventricular aneurysms contribute to chronic
cardiac decompensation with congestive heart failure, ven-
tricular arrhythmias, and systemic emboli.
Compared to medical therapy alone, surgical repair of LV
aneurysms in selected patients improves survival, functional
class, and symptoms.136
Two-dimensional echocardiography
has been used to evaluate the efficacy of aneurysmectomy in
patients with ventricular aneurysms. Ryan and colleagues126
found that a fractional shortening of >17% in the uninvolved
myocardium (measured at the base of the heart) was associ-
ated with an improved surgical outcome, whereas a frac-
tional shortening of ≥17% entailed no subsequent clinical or
surgical improvement.
Left Ventricular Remodeling
After an MI, the left ventricle accommodates to the loss of
regional myocardial function by increasing the contractile
state of the remaining viable segments. Left ventricular
remodeling is clinically characterized as a change in cardiac
size, shape, and function as a result of myocardial injury or
an increased load.137,138
The severity of the regional dysfunc-
tion (infarct size),139,140
function of the remaining segments,
neurohormonal activation, and presence of coexisting valvu-
lar heart disease, particularly MR, will determine the mag-
nitude of LV remodeling.105
This process usually begins
within the first few hours after the infarct and progresses
over time.141–143
Disproportionate thinning and dilatation of
the infarcted segment after an MI is defined as infarct expan-
sion and is accompanied by gross distortion of the LV shape
and volume144,145
and loss of functional myocardium that
initially contracted normally.146
With remodeling, the left
ventricle dilates, becomes more spherical, and declines in
function.147
Alterations in LV geometry lead to ischemic MR,
which further increases LV volumes and diastolic wall stress,
activates the neurohumoral cascade, and further decreases
LV contractility, thus leading to a cycle of LV remodeling and
MR.105
The important relationship between LV function and
MR is reflected in the poor survival of post-MI patients in
whom both significant MR and severe LV dysfunction coexist
(Fig. 35.13).111
Echocardiographic assessment of LV remodeling after an
acute MI includes 2D measurements of the LVEF, size, shape,
and volume at end-diastole and end-systole and should
also include Doppler estimation and quantification of MR
severity.
Prognosis in Acute Myocardial Infarction and
Chronic Coronary Artery Disease
In patients with CAD, the prognosis is related to the extent
of myocardial damage, the magnitude of the resultant LV
remodeling, the LV filling pressures, and the degree of resid-
ual coronary ischemia and viability. As a cardiac imaging
modality, echocardiography is uniquely suited for the routine
examination of each of these important predictors of
outcome. Two-dimensional echocardiography can be used to
identify patients with acute MIs who are at high risk for
short-term complications in the hospital and for long-term
complications after hospital discharge.148–151
Horowitz and
Morganroth149
found that echocardiography had a sensitivity
of 83% and a specificity of 85% in identifying patients at
high risk for in-hospital complications.
Ventricular Systolic Function
Left Ventricular Systolic Function
The extent of myocardial damage can be measured globally
as the ejection fraction or regionally as a wall-motion score
index. Both parameters have been shown to correlate with
the outcome in patients with an acute MI or chronic CAD
(Fig. 35.14).28,30,152,153
Nishimura and colleagues150
found that
post MI patients with a higher wall-motion score index at
discharge are more likely to have cardiovascular complica-
tions at follow-up examination. The LVEF and severity of MR
were the only independent echocardiographic predictors of
both early and late survival for patients presenting with car-
diogenic shock. Survival at 1 year was 24% in those with an
1.0
0.9
0.8
0.7
0.6
0.5
0.4
0.3
0.2
0.1
0.0
0 2 4 6
Time from randomization (months)
Proportionalive
2/3/4 MR, LVEF <28%
2/3/4 MR, LVEF ≥28%
0/1 MR, LVEF ≥28%
0/1 MR, LVEF <28%
8 10 12
FIGURE 35.13. Survival following myocardial infarction is depen-
dent on both left ventricular ejection fraction (LVEF) and the sever-
ity of mitral regurgitation (MR). Kaplan-Meier estimates of survival
up to 1 year after randomization for four combinations of LVEF and
MR in the SHOCK trial. Total n = 90; MR 0/1 and LVEF >28%, n =
33; MR 0/1 and LVEF <28%, n = 20; MR 2/3/4 and LVEF >28%, n =
16; MR 2/3/4 and LVEF <28%, n = 21.
CAR035.indd 821CAR035.indd 821 11/29/2006 3:33:10 PM11/29/2006 3:33:10 PM
822 c h a p t e r 35
LVEF of <28% versus 56% for those with a higher LVEF.111
In
the setting of acute coronary syndrome, LV systolic dysfunc-
tion increases the long-term mortality and increases the
probability of having multivessel CAD by 50%.154
Right Ventricular Systolic Function
In 416 patients with LV dysfunction (LVEF <40%) after an MI,
persistent RV dysfunction has been shown to decrease overall
survival. The RV systolic function correlated weakly with
the LV systolic function. However, RV function, measured
as a fractional area change, was an independent predictor of
mortality, cardiovascular mortality, and congestive heart
failure. Each 5% decrease in RV fractional area change
increased the odds of cardiovascular mortality by 16%
(Fig. 35.15).155
Left Ventricular Remodeling
Left ventricular remodeling can be characterized and quanti-
fied by 2D echocardiographic measurements of LV size and
volume. The prognosis in patients with CAD is also related
to the extent of LV remodeling. After an acute MI, small
increases in LV volume (particularly LV end-systolic
volume)156,157
or decreases in the LVEF158
increase the risk of
death and congestive heart failure.156,159
In-hospital evaluation of the postinfarct LVEF and the
extent of RWMA, but not LV dilatation, predicted progressive
LV remodeling.143,146
In the Beta-Blocker Evaluation of Sur-
vival Trial (BEST), however, Grayburn and colleagues160
found that LV volume and MR were the best predictors of
outcome in patients with LV dysfunction.
Mitral Regurgitation
The presence and severity of ischemic MR has been shown
to worsen survival in patients with acute MI and chronic
CAD with or without LV dysfunction.107,109,111–114,161–163
Mitral
regurgitation that follows an acute MI is an important inde-
pendent predictor of early and late death.109,113
In the SAVE
trial,24
any degree of MR detected within days after an MI
was associated with a poorer outcome, which was inde-
pendent of treatment with angiotensin-converting-enzyme
inhibitors (Fig. 35.16A). Survival correlated with the severity
0
2
4
6
8
10
15
N = 630 162 355 604 835 611
No study
within 14 days
<30%
30–39%
40–49%
Total = 3197
50–59% ≥60%
30
Resting ejection fraction (%)
Mortality(%)
45 60 75
FIGURE 35.14. Left ventricular systolic function predicts mortality
after myocardial infarction. Relation of rest ejection fraction to all-
cause mortality in 3197 patients enrolled in the TIMI II study.
Kaplan-Meier analysis of mortality rate related to time from study
entry, with patients categorized according to ejection fraction. Mor-
tality rate is highest in patients with ejection fraction <30% (9.9%).
FIGURE 35.16. (A) Mitral regurgitation (MR) worsens survival after
myocardial infarction. Kaplan-Meier curves of cardiovascular sur-
vival in patients with and without MR following acute myocardial
infarction in the Survival and Ventricular Enlargement (SAVE)
Study. MR, mitral regurgitation. (B) Decreased survival after MI
with increasing severity of MR. Degree of MR quantified by effec-
tive regurgitant orifice area (EROA); mild if EROA <20mm2
and
moderate or greater when EROA ≥20mm2
. Numbers at bottom indi-
cate patients at risk each interval.
RV Dysfunction n = 79
15001000
Days
5000
0
25
50
Survival(%)
75
100
HR = 3.2 (2.0–5.1) p <.0001
No RV Dysfunction n = 337
FIGURE 35.15. Right ventricular dysfunction following myocar-
dial infarction decreases survival. Cumulative percent survival of
patients with and those without right ventricular (RV) dysfunction
measured as fractional area change (FAC). RV dysfunction = FAC
<32.2%; normal RV function = FAC >32.3%; HR, hazard ratio.
CAR035.indd 822CAR035.indd 822 11/29/2006 3:33:10 PM11/29/2006 3:33:10 PM
ec hoc a r diog r a p h ic eva luat ion of corona ry a rt e ry dise a se 823
of MR quantified as effective regurgitant orifice area (EROA)
and regurgitant volume in the elegant studies by Grigioni
and coworkers115,164
(Fig. 35.16B).
In the echocardiographic substudy of the SHOCK trial
(SHould we emergently revascularize Occluded Coronaries
in cardiogenic shocK?),111
the only independent multivariate
predictors of either 30-day or 1-year mortality in patients
with cardiogenic shock after an acute MI were moderate or
greater MR severity and an LVEF of <28% (Fig. 35.13). For
patients with moderate or severe MR, the 1-year survival rate
was 31% compared to 58% for those with mild or no MR.
This outcome is comparable to the mortality of 52% at 1 year
and 24% at 30 days in 50 patients with moderately severe to
severe (3+ to 4+) MR on routine angiography during an acute
MI (total, 1485 patients).113
In these studies, MR severity was
associated with increasing LV volumes, which underlie and
contribute to the mechanism of MR after an acute MI.
Elevated Left Ventricular Filling Pressures
Elevated LV filling pressures in patients with acute MI and
chronic CAD are the consequence of LV dysfunction, MR,
and ventricular loading conditions. As such, they have been
shown to predict the short- and long-term outcome of patients
with CAD. Elevated filling pressures may be characterized
echocardiographically as a shortened deceleration time (DT)
of mitral early inflow velocity (DT <150ms), an increased
ratio of early (E) to late (A) LV diastolic filling velocities
(mitral inflow E/A >2), and pulmonary venous diastolic flow
predominance. Additionally, the LA volume, when indexed
to body surface area (>28mL/m2
), reflects the severity and
duration of elevated LV filling pressures and is a powerful
predictor of survival after an acute MI.165
Measurements uti-
lizing TDI have provided incremental prognostic informa-
tion in patients with CAD or congestive heart failure.166–168
After an acute MI, the ratio of the early diastolic mitral
filling velocity to the early diastolic tissue velocity of the
mitral annulus (E/e’ > 15) (Fig. 35.17A)167
as well as the
maximal peak tissue systolic velocity (Sm) (Fig. 35.17C)166
and peak early diastolic tissue velocity (Em) (Fig. 35.17B)166
when added to other echocardiographic variables, further
predicts survival.
Stress Echocardiography: Assessment of
Ischemic and Viable Myocardium
Stress echocardiography is routinely used to document the
presence of CAD, to identify the location and extent of myo-
cardial ischemia, to risk-stratify patients with known CAD,
and to assess myocardial viability in regions of myocardial
dysfunction.
Basic Principles and Definitions
Ischemia is characterized by hypoperfusion of myocardial
cells and can occur at rest or after stress. Viable myocardial
cells are living cells. Viable myocardium is easily identified
when it contracts normally. The discrimination of dysfunc-
tional, but living, myocardium from necrotic tissue is the
more common and clinically relevant description of viabil-
ity. Ischemia produces regional myocardial dysfunction
within seconds. Experimental studies have shown that the
duration and severity of an ischemic insult is the major
determinant of both functional and metabolic myocardial
0
0.5
0.6
0.7
Survival
0.8
0.9
1.0
A
B C
250 195 113
Duration of follow-up (months)
49 16Number at risk
1.0
0.9
0.8
Cumsurvival
Cumsurvival
0.7
1.0
0.9
0.8
0.7
0 10 20 30 40
Em ≤3 cm/s
3< Em ≤5 cm/s
Em >5 cm/s
Sm ≤3 cm/s
3< Sm ≤5 cm/s
Sm >5 cm/s
Follow time (months)
0 10 20 30 40
Follow time (months)
6 12 18 24
E/e’ > 15
E/e’ ≤15
FIGURE 35.17. Elevated left ventricular
filling pressures predict survival after
myocardial infarction. (A) Ratio of early
mitral diastolic velocity to diastolic
annular tissue velocity (E/e’) predicts
survival. Kaplan-Meier plot demon-
strates improved survival for patients
with E/e’ ratio of <15. (B,C) Peak LV
annular velocities in both systole and
diastole predict survival after MI.
Cumulative cardiac death by tertiles of
the early mitral annulus diastolic veloc-
ity (B) and mitral annulus systolic
velocity (C).
CAR035.indd 823CAR035.indd 823 11/29/2006 3:33:11 PM11/29/2006 3:33:11 PM
824 c h a p t e r 35
recovery.169
Severe regional LV dysfunction, leading to depres-
sion of LV systolic function in patients with CAD, can result
from myocardial necrosis, postischemic stunning, or myo-
cardial hibernation. “Stunning” refers to contractile dys-
function in viable myocardium as a result of transient
ischemia followed by reperfusion.12
“Hibernating” myocar-
dium refers to myocardial tissue that is persistently hypo-
contractile secondary to chronic or repetitive low coronary
perfusion.170
Hibernating myocardium has been described as
an adaptation to severe and chronic ischemia that increases
the risk of sudden death even in the absence of infarction.171
Recovery of hibernating myocardium is characteristically
late (two of three segments recovering in >3 months) after
reperfusion.
Interpretation
A new RWMA provoked by stress indicates cardiac ischemia.
Improved contractility of myocardial segments with abnor-
mal baseline function on inotropic stimulation is character-
isticofviablebutdysfunctionalmyocardium.Adysfunctional
segment may show one of four responses: (1) an improvement
in contractility (contractile reserve) that further improves
with maximum stimulation; (2) no improvement (nonviable);
(3) worsening function (ischemic); or (4) improvement with
low-dose inotropic stimulation that becomes dysfunctional
at higher doses of inotropic stimulation.8
This biphasic
response is characteristic of viable segments that become
ischemic at higher levels of stress. Table 35.2 summarizes
the myocardial segment responses to stress.
Methodology
Analysis of stress echocardiograms is predominantly based
on qualitative comparison of regional wall motion at base-
line and during stress. Semiquantitative assessment of
RWMAs by determining the wall-motion score index
(described above) is recommended. Newer techniques for
quantitation of regional LV systolic function include TDI and
its derivative, strain-rate imaging. Because regional myo-
cardial dysfunction occurs within seconds of acute transient
ischemia, and because recovery usually occurs within 2 to
3 minutes, imaging can be done after stress if performed
rapidly. Stress echocardiography can be performed using
either exercise or pharmacologic stress, depending on patient
ability, laboratory preference, and the reason for clinical
study (Table 35.3). The accuracy of stress echocardiography
is dependent on visualization of all myocardial segments
and evaluation of myocardial thickening and regional wall
motion. Myocardial contrast agents, which opacify the LV
cavity and better define endocardial borders, enhance the
detection of RWMAs. Tissue harmonic imaging and digital
image acquisition, which allow comparison of side-by-side
optimized images of representative cardiac cycles with
reduced respiratory interference (particularly at peak stress),
have further improved the discrimination of subtle wall-
motion abnormalities at various stress stages. Because accu-
racy of image interpretation remains subjective, physician
experience is a major determinant of the accuracy of stress
echocardiography.172
Treadmill Stress Echocardiography
Exercise protocols generally consist of either treadmill exer-
cise or upright or supine bicycle exercise. Baseline images are
acquired before and after exercise in four standard views:
parasternal long-axis (or apical three-chamber), parasternal
short-axis at the level of the papillary muscles, apical four-
chamber, and apical two-chamber. Exercise is performed
according to a standard exercise protocol, and the heart rate,
blood pressure, and electrocardiogram are monitored through-
out the test at each stage of exercise (Table 35.4). Only postex-
ercise imaging is available with treadmill exercise. Therefore,
rapid acquisition (within 60 to 90 seconds) of postexercise
TABLE 35.2. Myocardial segment response to stress
Resting
Stress
Likelihood of
segment function Exercise Low dose Peak dose Interpretation functional recovering
Normal ↑ ↑ ↑↑ Normal n/a
Normal ↓ ↑ ↓ Ischemic n/a
Abnormal* ↑ ↓ Ischemic and viable High
“Biphasic”
Abnormal ↓ ↓ ↓ Ischemic, viable Moderate
Abnormal ↑ ↑ ↑↑ Nonischemic, viable Low
Abnormal No change No change No change Nonviable, scar Low
*Viability assessment requires graded stress with image acquisition at multiple stages. Treadmill echo is not recommended for the assessment of viability.
TABLE 35.3. Selection of stress echocardiography protocols for
clinical decision making
Stress echo protocol
Clinical indication TME Bike Dobutamine
Chest pain + + ±
Post-MI + + +
Viability − ± ++
Dyspnea + + ±
MR + ++
Valve disease MS ++ +
AS ++ +
AI ++
Pulmonary artery pressure − ++ −
Preop risk assessment ± ± +
AI, aortic insufficiency; AS, aortic stenosis; MI, myocardial infarction; MR,
mitral regurgitation; MS, mitral stenosis; TME, treadmill stress
echocardiography.
CAR035.indd 824CAR035.indd 824 11/29/2006 3:33:11 PM11/29/2006 3:33:11 PM
ec hoc a r diog r a p h ic eva luat ion of corona ry a rt e ry dise a se 825
images is imperative to prevent resolution of an inducible
RWMA and, thus, a false-negative result. The advantages of
treadmill stress testing include the widespread availability
of treadmill equipment and the independent prognostic in-
formation obtained from exercise treadmill testing.
Bicycle Stress Echocardiography
Stationary bicycle exercise, either upright or supine, can also
be used for exercise stress echocardiography. As in treadmill
testing, baseline images are acquired before exercise. Patients
then pedal against progressively increasing resistance; the
blood pressure, heart rate, and electrocardiogram are moni-
tored throughout the test at each stage of exercise. One
advantage of supine bicycle testing is that images can be
acquired during exercise. The disadvantage is that many
patients find bicycling in the supine position awkward and
cumbersome, so they may be unable to achieve optimal
stress levels (Table 35.4). However, the onset of ischemia
appears to occur sooner in the supine position, perhaps
because of the increased venous return, preload, or blood
pressure associated with supine bicycling.173
Pharmacologic Stress Echocardiography
When a patient is unable to exercise, stress is induced with
pharmacologic agents such as dobutamine, adenosine, or
dipyridamole. Dobutamine, the most commonly used agent,
stimulates β1-, β2-, and α-adrenergic receptors, resulting in
both inotropic and chronotropic stimulation. Because of
dose-dependent differences in affinity for the different recep-
tors, low doses produce a predominantly inotropic response,
and increasing doses augment the chronotropic response.
Images are acquired at baseline and after administration of
graded doses of dobutamine, beginning with 5 to 10μg/kg/
min and increasing the dose every 3 to 5 minutes until reach-
ing a maximum dose of 40μg/kg/min, at which 85% of
the maximum age-adjusted (220 − age) heart rate is obtained.
Atropine (0.5 to 2.0mg) is frequently (in up to 25% of
patients)174
used in conjunction with dobutamine to augment
the heart rate response, especially in beta-blocker recipients,
in whom the heart rate response may be blunted.
Figure 35.18 summarizes the DSE protocol. Neither the
electrocardiogram nor the hemodynamic response to phar-
macologic stress testing is diagnostic or prognostic. Hypo-
tension during DSE may be related to (1) decreased systemic
vascular resistance associated with a β2-agonist response; (2)
LV outflow tract (LVOT) obstruction produced by systolic
anterior motion of the mitral valve associated with increas-
ing LVOT velocity and reduction in LV systolic cavity size;
(3) hypovolemia; or (4) severe (usually multivessel) ischemia.
Contraindications to DSE include severe arrhythmia, marked
systemic hypertension, severe aortic stenosis, resting LVOT
obstruction, aortic aneurysms, and unstable coronary syn-
dromes (Table 35.5). Testing is terminated when the patient
has completed the protocol and achieved >85% of the
maximal predicted heart rate (MPHR) or if a new RWMA
TABLE 35.4. Exercise echocardiography protocols
Immediate (<1min)
Baseline images postexercise
Protocols ± Doppler Exercise imaging imaging Advantages Limitations
Treadmill ✓ ✗ ✓ High workload Imaging only postexercise
Widely available
Exercise itself is prognostic:
Duration
ECG
Symptoms
Bike ✓ ✓ ✓ Images during exercise Lower workload
Difficult for patient
Dobutaminedose(μg/kg/min)
5
0 3 6 9 12
10
20
30
40***
Time in minutes
2D imaging 2 minutes after dose adjustment
*
**
Atropine 0.5–1 mg as needed to achieve
85% MPHR at peak dobutamine dose
Hand grip exercise may also be utilized to
increase heart rate at peak dose
FIGURE 35.18. Dobutamine stress echocardiography (DSE) protocol.
TABLE 35.5. Dobutamine stress echocardiography
Indications Contraindications
Patient unable to exercise Unstable coronary syndrome
Graded stress imaging Severe arrhythmia
Identification of viability Severe hypertension
Severe aortic stenosis
Aortic aneurysm or dissection
Resting left ventricular outflow tract
(LVOT) obstruction
CAR035.indd 825CAR035.indd 825 11/29/2006 3:33:11 PM11/29/2006 3:33:11 PM
826 c h a p t e r 35
develops in two or more segments. Development of a signifi-
cant arrhythmia, LVOT obstruction of >4m/s, or significant
hypotension or hypertension should lead to cessation of
the dobutamine infusion and termination of the test
(Table 35.6).
In a review of 1118 patients,175
the primary reason for
terminating DSE was achievement of the target heart rate
(52%), completion of the protocol with the maximum dobu-
tamine dose (23%), or development of angina (13%). In only
3% to 7% of patients was the test terminated for a noncardiac
side effect (nausea, anxiety, headache, tremor, urgency).
Overall, the frequency of such side effects was 26%. The
most frequent side effects were arrhythmias, hypotension,
nausea, and dyspnea, but these led to test termination in only
3% of cases.175
The incidence of supraventricular arrhythmia
during DSE has reportedly been as low as 0.5%176
and as high
as 7%.177
Sustained ventricular tachycardia occurs in up
to 6% of DSE studies177,178
; acute MI is rare, occurring in
<0.1%.177,178
Provocation of LVOT or midcavity obstruction
with DSE occurs in up to 35% of patients.179,180
Those who
develop LVOT obstruction but not midcavitary obstruction
may be at risk for future chest pain and syncope.181
Women,
patients with diabetes, and those receiving beta-blockers,
calcium channel blockers, or both, were more likely to have
suboptimal stress.
Stress Echocardiography for Detection of
Myocardial Ischemia
Accuracy of Exercise Stress Echocardiography
The accuracy of stress echocardiography for the detection of
CAD has been well studied (Table 35.7). In 16 published
studies including 1972 patients, the sensitivity of exercise
stress echocardiography for the detection of coronary steno-
ses >50% ranged from 71% to 97%.172,182–191
In a literature
review, 44 articles met the criteria for determining the sen-
sitivity and specificity of exercise echocardiography and
exercise myocardial perfusion imaging with single photon
emission computed tomography (SPECT) compared to coro-
nary angiography for the diagnosis of CAD.192
In pooled data,
the two modalities had similar sensitivities for detecting
CAD (85% vs. 87%), but exercise echocardiography had sig-
nificantly greater specificity (77% vs. 64%). Both tests per-
formed better than standard exercise testing, for which a
sensitivity of 68% and a specificity of 77% have been
reported.193
The sensitivity of exercise echocardiography was
better for the detection of multivessel disease than single-
vessel disease (average 92%, range 80% to 100%; vs. average
79%, range 59% to 94%) in nine studies involving 1355
patients.182–185,187,188,190,194
Patient characteristics also influence
the accuracy of exercise stress testing. Left ventricular
hypertrophy, cardiomyopathy, microvascular disease, and
an acute hypertensive response to exercise diminish the
accuracy of exercise echocardiography compared with the
angiographic standard.8
However, stress echocardiography
may be more accurate than exercise myocardial perfusion
imaging in this setting.194–196
Exercise myocardial perfusion
imaging is more accurate in the presence of preexisting
abnormal wall motion, left bundle-branch block, ventricular
pacing, a previous MI, and cardiomyopathy. The accuracy of
exercise echocardiography depends on the exercise level.
Failure to achieve 85% of the MPHR precludes the exclusion
of CAD. Submaximal exercise, single-vessel disease, and
moderate coronary stenosis (50% to 70%) lead to false-nega-
tive exercise echocardiographic results. The situations listed
in Table 35.3 are appropriate indications for stress echocar-
diography. This method is portable, low-cost, and free of
TABLE 35.6. Dobutamine stress echocardiography end points
Completed protocol
Achieved target heart rate >85% of (220—age in years)
Cardiac
Angina
New RWMA ≥2 segments
Arrhythmia
Ventricular tachycardia
Atrial fibrillation with rapid response
Supraventricular tachycardia
LVOT obstruction (>4m/s)
Abnormal blood pressure
≥230/120
SBP ≤80
Intolerable dobutamine reaction
Anxiety, nausea, headache
TABLE 35.7. Selected studies outlining the accuracy of exercise echocardiography
Total No. Sensitivity Sensitivity Overall
Reference of patients Sensitivity (%) for 1-VD (%) for MVD (%) Specificity (%) PPV (%) NPV (%) accuracy (%)
Armstrong et al.182
123 88 81 93 86 97 61 88
Crouse et al.183
228 97 92 100 64 90 87 89
Marwick et al.184
150 84 79 96 86 95 63 85
Quinones et al.185
112 74 59 89 88 96 51 78
Hecht et al.186
180 93 84 100 86 95 79 91
Beleslin et al.188
136 88 88 91 82 97 50 88
Roger et al.187
127 88 — — 72 93 60 —
Marwick et al.189
161 80 75 85 81 71 91 81
Marwick et al.194
147 71 63 80 91 85 81 82
Luotolahti et al.190
118 94 94 93 70 97 50 92
Roger et al.191
340 78 — — 41 79 40 69
1-VD, single vessel disease; MVD, multivessel disease; NPV, negative predictive value; PPV, positive predictive value.
CAR035.indd 826CAR035.indd 826 11/29/2006 3:33:11 PM11/29/2006 3:33:11 PM
ec hoc a r diog r a p h ic eva luat ion of corona ry a rt e ry dise a se 827
ionizing radiation. It provides additional information regard-
ing valvular, structural, and hemodynamic factors that affect
patient management and outcome. In a review of 1223 stress
echocardiograms, a significant Doppler abnormality was
detected in 17% (moderate or greater MR, 5.5%; mild or
greater aortic insufficiency, 13%).197
For patients able to
exercise, the 2003 ACC/AHA task force on chronic stable
angina gave a class I recommendation for the use of exercise
echocardiography as an initial diagnostic test or risk-
stratification technique in patients with known or sus-
pected CAD.34
The accuracy of stress echocardiography in identifying
stenosis has consistently been greater in the LAD territory
than in the RCA and LCx. The reported average sensitivity
of exercise echocardiography for detecting coronary stenosis
is 77% in the LAD, 75% in the RCA, and 49% in the circum-
flex artery.182,184,198,199
This may be related to the greater extent
of the LAD circulation and the ease with which it may be
imaged. Overlap of the RCA and LCx territories further
limits discrimination between the two.
Prognosis After Exercise
Stress Echocardiography
Electrocardiographic and echocardiographic variables con-
tribute to the prognostic value of exercise echocardiography.
The exercise variables, exercise duration, and ischemic ST-
segment depression remain important independent
predictors of outcome when modeled with ventricular
function at peak exercise.189
The extent and severity of
exercise-induced LV dysfunction is the most important
prognostic echocardiographic variable associated with isch-
emia.200–202
Patients with negative stress echocardiograms
have low rates of cardiac events at 1 (1%) and 3 (3%) years of
follow-up. Conversely, patients with abnormal stress echo-
cardiograms (LVEF <50%; wall-motion score index >1.4) had
significant adverse events.203
The negative predictive value
of a normal exercise echocardiogram in patients with normal
exercise tolerance is >99%.201,203–205
The ACC has reported
that stress echocardiography is a useful adjunct to standard
exercise testing and provides a more sensitive and specific
means of detecting myocardial ischemia; the diagnostic
accuracy is similar to that of nuclear technologies, but stress
echocardiography can be performed at a considerably lower
cost.
Accuracy of Dobutamine
Stress Echocardiography
The accuracy of DSE depends on the degree of coronary ste-
nosis and the extent of myocardial ischemia.206,207
Harmonic
imaging and LV opacification with intravenous contrast
agents improve endocardial definition and the accuracy of
DSE.208,209
In a study of 283 patients with suspected CAD, the
positive predictive value of DSE increased significantly as the
extent and severity of induced wall-motion abnormality
increased (more myocardium at risk). Furthermore, the sensi-
tivity increased as a faster maximal heart rate was achieved
(sensitivity: 67% with an MPHR of <75%, 71% with an MPHR
of 75% to 85%, and 86% with an MPHR of >85%; p <.05).207
The sensitivity and specificity for detecting CAD with DSE
mirror those of exercise echocardiography in multiple studies
with a range of sensitivity reported from 70% to 96% and
specificity range from 66% to 93% (Table 35.8).193,195,210–219
A review of 28 studies involving 2246 patients who
underwent both DSE and coronary angiography reported that
DSE had an overall sensitivity of 80%, a specificity of 84%,
and an accuracy of 81%. Like exercise echocardiography, DSE
was more accurate in detecting multiple-vessel than single-
vessel CAD (Table 35.8).210
In a review of 120 studies involv-
ing 10,817 patients, DSE was more specific than SPECT
myocardial perfusion imaging for the detection of obstruc-
tive coronary disease (Table 35.9).212
Prognosis with Dobutamine
Stress Echocardiography
Dobutamine stress echocardiography predicts the prognosis
in patients with CAD. Development of a new or worsening
wall-motion abnormality (ischemic response) occurred in
321 patients, and a fixed wall-motion abnormality was iden-
tified in 237 of 860 patients referred for DSE either for diag-
nosis of suspected CAD (55%) or for risk stratification in
patients with known CAD (45%).220
Adverse cardiac events
(cardiac death and MI) occurred equally in both groups (14%
and 13%, respectively) within 52 months of follow-up. The
percentage of abnormal segments at peak stress, which incor-
porates the extent of myocardial dysfunction and the amount
of jeopardized myocardium, predicted a higher risk of subse-
quent cardiac events (Fig. 35.19). Left ventricular dilatation
at peak stress and a low ischemic threshold also increase
TABLE 35.8. Selected studies outlining the accuracy of dobutamine echocardiography
Dobutamine
dose range Total No. Sensitivity Sensitivity Sensitivity Specificity
Author (Ref.) (mg/kg/min) of patients (%) for 1-VD (%) for MVD (%) (%) PPV (%) NPV (%) Accuracy (%)
Segar et al.217
5–30 88 95 — — 82 94 86 92
Marcovitz et al.213
5–30 141 96 95 98 66 91 84 89
McNeill et al.214
10–40 80 70 — — 88 89 67 78
Marwick et al.195
5–30 217 72 66 77 83 89 61 76
Previtali et al.216
5–30 80 79 63 91 83 92 61 80
Takeuchi et al.218
5–30 120 85 73 97 93 95 88 88
1-VD, single vessel disease; MVD, multivessel disease; NPV, negative predictive value; PPV, positive predictive value.
CAR035.indd 827CAR035.indd 827 11/29/2006 3:33:12 PM11/29/2006 3:33:12 PM
828 c h a p t e r 35
adverse cardiac events.220
Conversely, patients with normal
DSE results have low annual cardiovascular event rates. In a
report of 1737 patients with known or suspected coronary
heart disease (CHD),221
the annual event rate (cardiac death
or MI) at 5-year follow-up was 1.2% when the study was
normal. In a study of 301 patients unable to exercise, both
DSE and dobutamine SPECT myocardial perfusion imaging
were performed and outcomes were determined after 7 years
of follow-up. The predictive value of both methods was equiv-
alent. The annual cardiac mortality was 0.6% and 0.7%, and
the annual cardiac event rates (death, MI, revascularization)
were 3.3% and 3.6%, respectively, when the test was normal.
With an abnormal test, the annual cardiac mortality was
2.8% and 2.6%, and the annual cardiac event rates were 6.9%
and 6.5%, respectively.222
Risk Stratification After a Myocardial Infarction
Dobutamine stress echocardiography has been successfully
used for risk stratification of patients after an acute MI.223–225
In this setting, identification of viable and ischemic seg-
ments with DSE improves risk stratification beyond tradi-
tional clinical variables.226
In 123 patients with a previous
MI, the diagnostic accuracy of exercise echocardiography for
detecting significant coronary stenoses in infarct-related
arteries was determined by comparison to quantitative coro-
nary angiography performed within 2 weeks of stress echo-
cardiography.227
Treadmill exercise echocardiography was
highly sensitive (91%) regardless of infarct size but was less
specific (59%) for detection of infarct-related coronary
lesions.227
Assessment of Myocardial Viability
Viable myocardium has been reported in up to 60% of dys-
functional myocardial segments in ischemic cardiomyopa-
thy.228,229
Myocardial segments that are viable and poorly
perfused should recover function after coronary revascular-
ization. Careful selection of patients for revascularization is
imperative, as the operative mortality for coronary artery
bypass in patients with LV systolic dysfunction varies from
5% to 30% (increasing with age and worsening LV func-
tion).230
Furthermore, when performed in patients with
significant global LV dysfunction but little viable myocar-
dium, coronary bypass does not improve global systolic
function.231,232
Dobutamine Stress Echocardiography in the
Identification of Myocardial Viability
Dobutamine stress echocardiography is the preferred echo-
cardiographic method for the assessment of myocardial via-
bility because inotropic stimulation is graded and imaging
can be performed frequently. The DSE protocol for viability
assessment differs from that used for the assessment of myo-
cardial ischemia by including more images at lower dobu-
tamine doses (Table 35.10). The goal is to identify any
improvement in contractile reserve in patients with myocar-
dial dysfunction, which may be transient in those with con-
comitant ischemia. Viable segments should demonstrate
contractile reserve with inotropic stimulation, normal myo-
cardial thickness, and evidence of some coronary perfusion
and metabolism.233
The biphasic response—initial improve-
ment in contractility followed by deterioration at higher
doses—indicates viable and ischemic myocardium and is a
TABLE 35.9. Weighted mean sensitivities, specificities of pharmacologic studies
Pharmacologic test Studies Subjects Mean age (years) CAD (%) MI (%) Men (%) Sensitivity (%) Specificity (%)
Adenosine echocardiography 6 516 65 73 31 71 72 (62–79) 91 (88–93)
Adenosine SPECT 9 1,207 63 80 17 59 90 (89–92) 75 (70–79)
Dipyridamole echocardiography 20 1,835 56 67 15 72 70 (66–74) 93 (90–95)
Dipyridamole SPECT 21 1,464 60 71 31 77 89 (84–93) 65 (54–74)
Dobutamine echocardiography* 40 4,097 59 70 26 66 80 (77–83) 84 (80–86)
Dobutamine SPECT 14 1,066 58 66 9 63 82 (77–87) 75 (70–79)
Total 120† 10,817†
CAD, coronary artery disease; MI, myocardial infarction; SPECT, single photon emission computed tomography.
*One dobutamine echocardiographic study not included here because only multivessel disease was examined.
†Total number of tests and subjects exceeds the number of studies reviewed because some studies examined more than one pharmacologic test.
0
0
20
Normal
% of segments
abnormal at peak stress
≤25
Ischemia
Infarction
40
60
80
Event-free
probability,%
100
10 20
Time, months
30 40 0 10 20
51–100
26–50
Time, months
30 40
No. at risk 774 641 235 40 774860 641 235 40860
FIGURE 35.19. Abnormalities on dobutamine stress echocardiog-
raphy predict future adverse cardiac events. Left: Ischemia and fixed
wall motion abnormalities (infarction) by dobutamine stress echo-
cardiography decrease cumulative cardiac event–free probability.
Right: The percentage of abnormal segments at peak stress increases
the risk of future cardiac events.
TABLE 35.10. Dobutamine stress protocol
Ischemia vs. Viability
Rest 10μg Rest 5μg
Pre-peak Peak > 88% 10mcg Peak > 88%
MPHR MPHR
MPHR, maximal predicted heart rate.
CAR035.indd 828CAR035.indd 828 11/29/2006 3:33:12 PM11/29/2006 3:33:12 PM
ec hoc a r diog r a p h ic eva luat ion of corona ry a rt e ry dise a se 829
reliable predictor of functional recovery (Table 35.2).234
The
value of DSE in the identification of myocardial viability
and, therefore, in the selection of patients who may benefit
from revascularization is well established. In a number of
studies in which postrevascularization echocardiography has
been used to assess LV functional recovery after catheter-
based or surgical revascularization, the average sensitivity of
DSE to predict functional recovery ranges from 74% to 88%,
and the specificity is 73% to 87%.235–242
The positive predic-
tive value is 81%, and negative predictive value is 87%. Com-
parative studies have shown a higher specificity and a lower
sensitivity with DSE than with radionuclide techniques
for the identification of functional recovery after the revas-
cularization of dysfunctional myocardial segments (Fig.
35.20).242–244
The end-diastolic myocardial wall thickness obtained by
routine echocardiography is a simple and valuable marker of
viability.245
In a study of 45 patients with stable CAD and
ventricular dysfunction, a myocardial thickness of ≤6mm
predicted poor recovery of function after revascularization.
Apical segments were the most difficult to measure and
accounted for nearly all of the immeasurable but dysfunc-
tional segments (17%). A myocardial thickness of >6mm had
a sensitivity of 94% and a specificity of 48% for recovery of
function. A combination of preserved wall thickness and
evidence of contractile reserve during DSE improved the
specificity of DSE to 77% and, thus, is a valuable adjunct to
DSE in the assessment of myocardial viability.
Prognosis: Viability and Potential Benefits
of Revascularization
Patients with viability and LV dysfunction have improved
survival with revascularization compared to medical therapy.
A meta-analysis of 24 nonrandomized studies involving 3088
patients (mean LVEF 32% ± 8%) revealed an 80% relative
reduction in death (3.2% vs. 16%; p <.0001) with revascular-
ization compared with medical therapy when viability was
present, but there was no benefit when viability was absent
(7.7% vs. 6.2%) (Fig. 35.21).246
Viability testing also predicts
improvement in regional and global LV function after revas-
cularization.246
However, the extent of viable myocardium
required in order to expect improvement in the LVEF after
revascularization may range from 25% to 30% of the left
ventricle.247
Survival is lowest for patients with severe LV
dysfunction and no evidence of viability (mortality, 20% at
18 months), which is independent of revascularization.234
New Echocardiographic Quantitative Parameters
Abnormalities of radial wall thickening are visualized
subjectively by traditional 2D echocardiography as new or
induced RWMAs. Abnormalities of longitudinal deforma-
tion can be identified and quantified by TDI and can be
assessed by tissue velocity and displacement, strain and
strain rate imaging, and postsystolic shortening. Tissue
Doppler imaging parameters have been shown to improve
the accuracy of stress echocardiography in detecting myocar-
dial ischemia and viability.
Strain-Rate Imaging
Strain-rate imaging provides objective quantification of seg-
mental myocardial function by measuring myocardial defor-
mation or the change in regional myocardial thickening and
is relatively unaffected by adjacent tissue tethering or overall
motion of the heart.248–250
Strain-rate imaging can enhance
echocardiographic detection of ischemia and can differenti-
ate viable from infarcted myocardium.12,15,18,251,252
Ischemia produces a delayed onset and termination of
systolic shortening that is detectable with longitudinal strain
and strain-rate imaging but not by 2D imaging. Evaluation
of regional LV function by TDI velocities, using color M-
mode analysis of segmental strain and strain rate, was per-
formed in 44 patients undergoing traditional DSE.16
Ischemia
was defined by concurrent pharmacologic SPECT myocar-
dial perfusion imaging and stenosis confirmed by coronary
DE
0
20
40
60
80
100
%
32
1090
Sensitivity p Specificity
DE vs others
others vs TI-RI
MIBI vs TI-RR
FDG vs others <.05
<.05
<.05
p
<.05
<.05
<.05
TI-RI vs DE, MIBI
TI-RR vs DE
22
557
11
301
20
488
20
598
Studies (no.)
Patients (no.)
TI-RR TI-RI MIBI FDG
FIGURE 35.20. Techniques for the noninvasive assessment of myo-
cardial viability; comparison of weighted sensitivities and specifici-
ties. Regional recovery of function after revascularization was the
gold standard for viability. Open bars, sensitivity; solid bars, speci-
ficity. DE, dobutamine echo; FDG, fluorine-18 fluorodeoxyglucose;
MIBI, technetium-99m sestamibi; Tl-RI, thallium-201 reinjection;
Tl-RR, thallium-201 rest-redistribution.
20
15
10
5 3.2
16.0
7.7
6.2
NonviableViable
–79.6%
p<.0001
χ2
= 147
23.0%
p = .23
χ2
= 1.43
Deathrate(%/yr)
0
FIGURE 35.21. Survival following revascularization is increased in
patients with evidence of myocardial viability. Without myocardial
viability, there was no significant difference in survival between
patients treated medically and those revascularized. Open bars,
revascularization; solid bars, medical therapy.
CAR035.indd 829CAR035.indd 829 11/29/2006 3:33:12 PM11/29/2006 3:33:12 PM
830 c h a p t e r 35
angiography. Qualitative assessment of strain and strain-rate
curves was possible in 85% of segments. In normally per-
fused segments, the peak systolic strain rate increased with
increasing dobutamine stimulation. Ischemic myocardial
segments had significantly lower strain-rate increases and
strain than did nonischemic segments. Compared with tra-
ditional DSE parameters, strain-rate imaging improved the
sensitivity of DSE from 81% to 86% and the specificity from
82% to 90% (Fig. 35.22).16
With ischemia, the myocardium continues to thicken
during the isovolumic relaxation period.251
This postsystolic
shortening is a sensitive but nonspecific marker of ischemia
that was found in 100% of ischemic segments but also in
47% of nonischemic segments in the study by Voight and
coworkers.16
Postsystolic shortening is not easily identified
by 2D imaging because of its relatively low amplitude and
short duration.10
Strain-rate imaging allows quantification of
postsystolic shortening, which is defined as the maximum
change in segment length occurring between aortic valve
closure and the regional onset of myocardial lengthening
caused by early diastolic LV filling. In one study, the ratio of
postsystolic shortening to maximal segment deformation
was the best quantitative parameter for identifying stress-
induced ischemia with DSE.16
Peak myocardial deformation detected by strain-rate
imaging can differentiate active myocardial motion from
passive or translational cardiac motion in both animals and
humanswithnontransmural(viable)andtransmuralinfarcted
(scarred) myocardium. This method also allows noninvasive
determination of the extent of nonviable infarcted myocar-
dium.252,253
Myocardial viability assessment with DSE was
improved by the addition of strain-rate imaging in 55 patients
with MIs followed by percutaneous or surgical revasculariza-
tion.254
The inclusion of regional strain-rate imaging with
routine visual wall-motion scoring identified patients with
significant myocardial viability (an improvement in more
than four myocardial segments or an overall increase of >5%
in the LVEF after revascularization) and increased the sensi-
tivity of DSE from 73% to 83% without changing the speci-
ficity. In a separate study,255
tissue Doppler echocardiography
with strain-rate imaging without DSE differentiated trans-
mural from nontransmural MIs in 47 consecutive patients
with a first acute MI compared to 60 age-matched healthy
volunteers. The peak systolic strain rate (>−0.59s−1
) had a
high sensitivity (90.9%) and specificity (96.4%) in identifying
transmural infarctions. A peak strain rate between −0.98s−1
and −1.26s−1
had a sensitivity of 81.3% and a specificity of
83.3% in distinguishing subendocardial infarctions. The
peak strain rate was significantly lower in segments with
transmural infarctions identified with contrast magnetic
resonance imaging compared to normal myocardium or seg-
ments with a nontransmural infarction (both p <.0005).255
Perfusion Imaging
Myocardial contrast echocardiography (MCE) is an evolving
technique for the evaluation of myocardial perfusion. Intrave-
nous injection of gas-filled microbubbles scatters ultrasound
and can be used to define LV endocardial borders and myocar-
dial blood flow. Steady-state microbubbles within the myocar-
dium can be destroyed with high-energy ultrasound pulses,
and the rate of microbubble reappearance approximates myo-
cardial blood flow. Improvements in bubble size (<10μm to
allow transcapillary migration), as well as echocardiogra-
phic imaging techniques to enhance detection (harmonic
imaging)256
and enhance the durability of the microbubbles
(triggered imaging)257
with a low mechanical index258
have
greatly improved the potential clinical applicability of this
technique.259,260
Compared to other modalities of coronary
perfusion, MCE has shown progressive improvements in accu-
racy. Specificities range from 78% to 95%, but sensitivities for
the detection of moderate to severe perfusion defects have
been low (14% to 65%).261,262
A higher number of falsely abnor-
mal results in the circumflex territory have been reported.263
Myocardial contrast echocardiography has been shown to
be accurate in detecting flow-limiting CAD in patients with
suspected CAD and in those undergoing vasodilator stress
testing after an acute MI.264–266
This method may enhance
the predictive value of standard, exercise, and dobutamine
echocardiography. The addition of perfusion imaging has
been shown to improve the sensitivity of routine echocar-
diography for diagnosing myocardial ischemia in patients
with suspected cardiac chest discomfort and nondiagnostic
electrocardiographic abnormalities.256
The combination of
perfusion defects and wall-motion abnormalities with exer-
cise improved the sensitivity, specificity, and accuracy to
86%, 88%, and 86%, respectively, for establishing the pres-
ence of CAD on angiography.267
Abnormal myocardial perfusion imaging during vasodi-
lator stress (dobutamine) echocardiography in 788 patients
contributed significantly to the predictive value of clinical
risk factors, resting systolic LV function, and RWMAs. Event-
free survival at 3 years decreased from 95% with normal wall
motion and normal perfusion to 82% when perfusion was
abnormal and 68% when both wall motion and perfusion
were abnormal. Multivessel perfusion defects predicted the
worst outcomes.268
100
8281
86
89
SRI
sensitivity
specificity
2D-gray
80
60
40
20
0
[%]
FIGURE 35.22. Strain-rate imaging (SRI-CMM) improves the sen-
sitivity and specificity of conventional two-dimensional imaging
(2D-gray) during dobutamine stress echocardiography (DSE).
CAR035.indd 830CAR035.indd 830 11/29/2006 3:33:12 PM11/29/2006 3:33:12 PM
ec hoc a r diog r a p h ic eva luat ion of corona ry a rt e ry dise a se 831
Perfusion imaging may help differentiate CAD from
other etiologies in patients with congestive heart failure and
severe LV dysfunction. In 55 patients with acute congestive
heart failure, identification of CAD as the etiology was facili-
tated by MCE at rest and after dipyridamole stress. Com-
pared to patients without CAD and to normal control
subjects, patients with CAD had a reduced myocardial blood
flow velocity reserve in vascular territories supplied by
vessels with >50% obstruction. In this population, MCE was
the only independent predictor of CAD among clinical, elec-
trocardiographic, biochemical, and resting echocardiographic
variables (Fig. 35.23).269
Myocardial contrast echocardiogra-
phy may provide an added benefit to dobutamine echocar-
diography in the evaluation of myocardial viability. The
demonstration of specific patterns of contrast within dys-
functional myocardial segments may discriminate viable
from nonviable myocardium.270
References
1. Hatle L, Sutherland GR. Regional myocardial function—a new
approach. Eur Heart J 2000;21:1337–1357.
2. Gallagher KP, Kumada T, Koziol JA, McKown MD, Kemper WS,
Ross J Jr. Significance of regional wall thickening abnormali-
ties relative to transmural myocardial perfusion in anesthe-
tized dogs. Circulation 1980;62:1266–1274.
3. Lieberman AN, Weiss JL, Jugdutt BI, et al. Two-dimensional
echocardiography and infarct size: relationship of regional wall
motion and thickening to the extent of myocardial infarction
in the dog. Circulation 1981;63:739–746.
4. Ren JF, Kotler MN, Hakki AH, Panidis IP, Mintz GS, Ross J.
Quantitation of regional left ventricular function by two-
dimensional echocardiography in normals and patients with
coronary artery disease. Am Heart J 1985;110:552–560.
5. Schiller NB, Shah PM, Crawford M, et al. Recommendations
for quantitation of the left ventricle by two-dimensional
echocardiography. American Society of Echocardiography Com-
mittee on Standards, Subcommittee on Quantitation of Two-
Dimensional Echocardiograms. J Am Soc Echocardiogr
1989;2:358–367.
6. Cerqueira MD, Weissman NJ, Dilsizian V, et al. Standardized
myocardial segmentation and nomenclature for tomographic
imaging of the heart: a statement for healthcare professionals
from the Cardiac Imaging Committee of the Council on Clini-
cal Cardiology of the American Heart Association. Circulation
2002;105:539–542.
7. Lang RM, Bierig M, Devereux RB, et al., Chamber Quantifica-
tion Writing Group; American Society of Echocardiography’s
Guidelines and Standards Committee; European Association
of Echocardiography. Recommendations for chamber quantifi-
cation: a report from the American Society of Echocardiogra-
phy’s Guidelines and Standards Committee and the Chamber
Quantification Writing Group, developed in conjunction with
the European Association of Echocardiography, a branch of
the European Society of Cardiology. J Am Soc Echocardiogr
2005;18:1440–1463.
8. Armstrong WF, Zoghbi WA. Stress echocardiography: current
methodology and clinical applications. J Am Coll Cardiol
2005;45:1739–1747.
9. Otto CM. Textbook of Clinical Echocardiography, 3rd ed.
Philadelphia: WB Saunders, 2004.
10. Kvitting JP, Wigstrom L, Strotmann JM, Sutherland GR. How
accurate is visual assessment of synchronicity in myocardial
motion? An in vitro study with computer-simulated regional
delay in myocardial motion: clinical implications for rest and
stress echocardiography studies. J Am Soc Echocardiogr 1999;
12:698–705.
11. Garcia MJ, Rodriguez L, Ares M, et al. Myocardial wall velocity
assessment by pulsed Doppler tissue imaging: characteristic
findings in normal subjects. Am Heart J 1996;132:648–656.
12. Wilkenshoff UM, Sovany A, Wigstrom L, et al. Regional mean
systolic myocardial velocity estimation by real-time color
Doppler myocardial imaging: a new technique for quantifying
regional systolic function. J Am Soc Echocardiogr 1998;11:
683–692.
13. D’Hooge J, Heimdal A, Jamal F, et al. Regional strain and strain
rate measurements by cardiac ultrasound: principles, imple-
mentation and limitations. Eur J Echocardiogr 2000;1:
154–170.
14. Urheim S, Edvardsen T, Torp H, Angelsen B, Smiseth OA.
Myocardial strain by Doppler echocardiography. Validation of
a new method to quantify regional myocardial function. Cir-
culation 2000;102:1158–1164.
15. Jamal F, Kukulski T, Sutherland GR, et al. Can changes in
systolic longitudinal deformation quantify regional myocar-
dial function after an acute infarction? An ultrasonic strain
rate and strain study. J Am Soc Echocardiogr 2002;15:
723–730.
16. Voigt JU, Exner B, Schmiedehausen K, et al. Strain-rate imaging
during dobutamine stress echocardiography provides objective
evidence of inducible ischemia. Circulation 2003;107:
2120–2126.
17. Gorcsan J 3rd. Echocardiographic strain imaging for myocar-
dial viability: an improvement over visual assessment? Circu-
lation 2005;112:3820–3822.
18. Voigt JU, Arnold MF, Karlsson M, et al. Assessment of regional
longitudinal myocardial strain rate derived from Doppler myo-
cardial imaging indexes in normal and infarcted myocardium.
J Am Soc Echocardiogr 2000;13:588–598.
19. Tei C, Ling LH, Hodge DO, et al. New index of combined sys-
tolic and diastolic myocardial performance: a simple and repro-
ducible measure of cardiac function—a study in normals and
dilated cardiomyopathy. J Cardiol 1995;26:357–366.
20. Broberg CS, Pantely GA, Barber BJ, et al. Validation of the
myocardial performance index by echocardiography in mice: a
noninvasive measure of left ventricular function. J Am Soc
Echocardiogr 2003;16:814–823.
FIGURE 35.23. Perfusion imaging with myocardial contrast echo-
cardiography demonstrates myocardial blood flow in viable myocar-
dial segments and may be useful to discriminate coronary arterial
obstruction as a cause of congestive heart failure. Apical four–
chamber view at rest (left) in a patient with acute congestive heart
failure and LV dysfunction (LVEF, 42%) demonstrating normal myo-
cardial perfusion at rest (5 seconds after myocardial contrast
destruction). Right: After dipyridamole stress, four-chamber view
displayed 3 seconds after myocardial contrast destruction. Note
perfusion defect in the septum, apex, and lateral wall. LAD and LCx
flow limiting stenoses were confirmed by coronary angiography.
CAR035.indd 831CAR035.indd 831 11/29/2006 3:33:12 PM11/29/2006 3:33:12 PM
Echocardiography Evaluates Coronary Artery Disease

More Related Content

What's hot

INTRACARDIAC ECHOCARDIOGRAPH (ICE)
INTRACARDIAC ECHOCARDIOGRAPH (ICE)INTRACARDIAC ECHOCARDIOGRAPH (ICE)
INTRACARDIAC ECHOCARDIOGRAPH (ICE)Himanshu Rana
 
fractional flow reserve FFR dr md toufiqur rahman FSCAI FAHA FAPSIC
fractional flow reserve FFR dr md toufiqur rahman FSCAI FAHA FAPSICfractional flow reserve FFR dr md toufiqur rahman FSCAI FAHA FAPSIC
fractional flow reserve FFR dr md toufiqur rahman FSCAI FAHA FAPSICPROFESSOR DR. MD. TOUFIQUR RAHMAN
 
Assessment of prosthetic valve function
Assessment of prosthetic valve functionAssessment of prosthetic valve function
Assessment of prosthetic valve functionSwapnil Garde
 
Localization of WPW( accessory Pathway) by surface ECG
Localization of WPW( accessory Pathway) by surface ECGLocalization of WPW( accessory Pathway) by surface ECG
Localization of WPW( accessory Pathway) by surface ECGRaghu Kishore Galla
 
Intravascular Ultrasound (IVUS)
Intravascular Ultrasound (IVUS)Intravascular Ultrasound (IVUS)
Intravascular Ultrasound (IVUS)Dr.Sayeedur Rumi
 
Rotablation - An overview
Rotablation - An overviewRotablation - An overview
Rotablation - An overviewSuheil Dhanse
 
Electrophysiology study basics
Electrophysiology study basicsElectrophysiology study basics
Electrophysiology study basicsSatyam Rajvanshi
 
Echocardiographic Evaluation of Hypertrophic Cardiomyopathy
Echocardiographic Evaluation of Hypertrophic CardiomyopathyEchocardiographic Evaluation of Hypertrophic Cardiomyopathy
Echocardiographic Evaluation of Hypertrophic CardiomyopathyHatem Soliman Aboumarie
 
Mitral valve scoring before BMV
Mitral valve scoring before BMVMitral valve scoring before BMV
Mitral valve scoring before BMVdramitcardiology
 
Echocardiographic evaluation of Aortic stenosis
Echocardiographic evaluation of Aortic stenosisEchocardiographic evaluation of Aortic stenosis
Echocardiographic evaluation of Aortic stenosisAswin Rm
 
Asd echo assessment
Asd echo assessmentAsd echo assessment
Asd echo assessmentMashiul Alam
 
Echocardiographic Evaluation of LV Diastolic Function
Echocardiographic Evaluation of LV Diastolic FunctionEchocardiographic Evaluation of LV Diastolic Function
Echocardiographic Evaluation of LV Diastolic FunctionJunhao Koh
 
Echocardiographic screening for rheumatic heart disease
Echocardiographic screening for rheumatic heart diseaseEchocardiographic screening for rheumatic heart disease
Echocardiographic screening for rheumatic heart diseaseRamachandra Barik
 

What's hot (20)

INTRACARDIAC ECHOCARDIOGRAPH (ICE)
INTRACARDIAC ECHOCARDIOGRAPH (ICE)INTRACARDIAC ECHOCARDIOGRAPH (ICE)
INTRACARDIAC ECHOCARDIOGRAPH (ICE)
 
fractional flow reserve FFR dr md toufiqur rahman FSCAI FAHA FAPSIC
fractional flow reserve FFR dr md toufiqur rahman FSCAI FAHA FAPSICfractional flow reserve FFR dr md toufiqur rahman FSCAI FAHA FAPSIC
fractional flow reserve FFR dr md toufiqur rahman FSCAI FAHA FAPSIC
 
Assessment of prosthetic valve function
Assessment of prosthetic valve functionAssessment of prosthetic valve function
Assessment of prosthetic valve function
 
Localization of WPW( accessory Pathway) by surface ECG
Localization of WPW( accessory Pathway) by surface ECGLocalization of WPW( accessory Pathway) by surface ECG
Localization of WPW( accessory Pathway) by surface ECG
 
Intravascular Ultrasound (IVUS)
Intravascular Ultrasound (IVUS)Intravascular Ultrasound (IVUS)
Intravascular Ultrasound (IVUS)
 
Rotablation - An overview
Rotablation - An overviewRotablation - An overview
Rotablation - An overview
 
Fraction flow reserve
Fraction flow reserveFraction flow reserve
Fraction flow reserve
 
Strain and strain rate
Strain  and strain rateStrain  and strain rate
Strain and strain rate
 
Ivus oct
Ivus octIvus oct
Ivus oct
 
Electrophysiology study basics
Electrophysiology study basicsElectrophysiology study basics
Electrophysiology study basics
 
Echocardiographic Evaluation of Hypertrophic Cardiomyopathy
Echocardiographic Evaluation of Hypertrophic CardiomyopathyEchocardiographic Evaluation of Hypertrophic Cardiomyopathy
Echocardiographic Evaluation of Hypertrophic Cardiomyopathy
 
Mitral valve scoring before BMV
Mitral valve scoring before BMVMitral valve scoring before BMV
Mitral valve scoring before BMV
 
Echocardiographic evaluation of Aortic stenosis
Echocardiographic evaluation of Aortic stenosisEchocardiographic evaluation of Aortic stenosis
Echocardiographic evaluation of Aortic stenosis
 
Asd echo assessment
Asd echo assessmentAsd echo assessment
Asd echo assessment
 
Lv systolic function
Lv systolic functionLv systolic function
Lv systolic function
 
Electrophysiology AVNRT
Electrophysiology AVNRTElectrophysiology AVNRT
Electrophysiology AVNRT
 
Cath hemodynamics vir
Cath hemodynamics virCath hemodynamics vir
Cath hemodynamics vir
 
Echocardiographic Evaluation of LV Diastolic Function
Echocardiographic Evaluation of LV Diastolic FunctionEchocardiographic Evaluation of LV Diastolic Function
Echocardiographic Evaluation of LV Diastolic Function
 
Stress echocardiography
Stress echocardiographyStress echocardiography
Stress echocardiography
 
Echocardiographic screening for rheumatic heart disease
Echocardiographic screening for rheumatic heart diseaseEchocardiographic screening for rheumatic heart disease
Echocardiographic screening for rheumatic heart disease
 

Similar to Echocardiography Evaluates Coronary Artery Disease

Left ventricular function evaluation
Left ventricular function evaluationLeft ventricular function evaluation
Left ventricular function evaluationMostafa Sayed
 
Nuclear medicine for cardiothoracic surgeons
Nuclear medicine for cardiothoracic surgeonsNuclear medicine for cardiothoracic surgeons
Nuclear medicine for cardiothoracic surgeonsSrikanthK120
 
Echo parameters in crt patients selection
Echo parameters in crt patients selectionEcho parameters in crt patients selection
Echo parameters in crt patients selectionJai Babu
 
Assessment of subendocardial vs. subepicardial left ventricular twist using t...
Assessment of subendocardial vs. subepicardial left ventricular twist using t...Assessment of subendocardial vs. subepicardial left ventricular twist using t...
Assessment of subendocardial vs. subepicardial left ventricular twist using t...Cardiovascular Diagnosis and Therapy (CDT)
 
The role of Echocardiography In coronary artery disease and Acute Myocardial...
The role of Echocardiography In  coronary artery disease and Acute Myocardial...The role of Echocardiography In  coronary artery disease and Acute Myocardial...
The role of Echocardiography In coronary artery disease and Acute Myocardial...Nizam Uddin
 
Utilidad strain en cardiopatia isquemica
Utilidad strain en cardiopatia isquemica Utilidad strain en cardiopatia isquemica
Utilidad strain en cardiopatia isquemica Ricardo Mora MD
 
How to do right ventricular strain
How to do right ventricular strainHow to do right ventricular strain
How to do right ventricular strainRamachandra Barik
 
Strain presentation class presentatio - copy
Strain presentation   class presentatio - copyStrain presentation   class presentatio - copy
Strain presentation class presentatio - copyAshish Golwara
 
CARDIAC MRI braunwalds 2.pptx
CARDIAC MRI braunwalds 2.pptxCARDIAC MRI braunwalds 2.pptx
CARDIAC MRI braunwalds 2.pptxdara213127
 
Investigation of cardiovascular diseases
Investigation of cardiovascular diseasesInvestigation of cardiovascular diseases
Investigation of cardiovascular diseasesmushfiq1970
 
Cardiac CT Angiography to detect Myocardial Bridging
Cardiac CT Angiography to detect Myocardial Bridging Cardiac CT Angiography to detect Myocardial Bridging
Cardiac CT Angiography to detect Myocardial Bridging Han Naung Tun
 
Angiography of Head and Neck
Angiography of Head and NeckAngiography of Head and Neck
Angiography of Head and NeckSharmaRajan4
 
Evaluation of Cardiac function.pptx
Evaluation of Cardiac function.pptxEvaluation of Cardiac function.pptx
Evaluation of Cardiac function.pptxFeniksRetails
 

Similar to Echocardiography Evaluates Coronary Artery Disease (20)

Left ventricular function evaluation
Left ventricular function evaluationLeft ventricular function evaluation
Left ventricular function evaluation
 
Nuclear medicine for cardiothoracic surgeons
Nuclear medicine for cardiothoracic surgeonsNuclear medicine for cardiothoracic surgeons
Nuclear medicine for cardiothoracic surgeons
 
Echo parameters in crt patients selection
Echo parameters in crt patients selectionEcho parameters in crt patients selection
Echo parameters in crt patients selection
 
Assessment of subendocardial vs. subepicardial left ventricular twist using t...
Assessment of subendocardial vs. subepicardial left ventricular twist using t...Assessment of subendocardial vs. subepicardial left ventricular twist using t...
Assessment of subendocardial vs. subepicardial left ventricular twist using t...
 
The role of Echocardiography In coronary artery disease and Acute Myocardial...
The role of Echocardiography In  coronary artery disease and Acute Myocardial...The role of Echocardiography In  coronary artery disease and Acute Myocardial...
The role of Echocardiography In coronary artery disease and Acute Myocardial...
 
Mital regurge
Mital regurgeMital regurge
Mital regurge
 
Cardiac MRI
Cardiac MRICardiac MRI
Cardiac MRI
 
Utilidad strain en cardiopatia isquemica
Utilidad strain en cardiopatia isquemica Utilidad strain en cardiopatia isquemica
Utilidad strain en cardiopatia isquemica
 
Cardiac MRI
Cardiac MRICardiac MRI
Cardiac MRI
 
How to do right ventricular strain
How to do right ventricular strainHow to do right ventricular strain
How to do right ventricular strain
 
Strain presentation class presentatio - copy
Strain presentation   class presentatio - copyStrain presentation   class presentatio - copy
Strain presentation class presentatio - copy
 
CARDIAC MRI braunwalds 2.pptx
CARDIAC MRI braunwalds 2.pptxCARDIAC MRI braunwalds 2.pptx
CARDIAC MRI braunwalds 2.pptx
 
Investigation of cardiovascular diseases
Investigation of cardiovascular diseasesInvestigation of cardiovascular diseases
Investigation of cardiovascular diseases
 
Cardiac CT Angiography to detect Myocardial Bridging
Cardiac CT Angiography to detect Myocardial Bridging Cardiac CT Angiography to detect Myocardial Bridging
Cardiac CT Angiography to detect Myocardial Bridging
 
speckle TRACKING.pptx
speckle TRACKING.pptxspeckle TRACKING.pptx
speckle TRACKING.pptx
 
Angiography of Head and Neck
Angiography of Head and NeckAngiography of Head and Neck
Angiography of Head and Neck
 
Heart failure radiology
Heart failure radiologyHeart failure radiology
Heart failure radiology
 
Lv systolic function
Lv systolic functionLv systolic function
Lv systolic function
 
Evaluation of Cardiac function.pptx
Evaluation of Cardiac function.pptxEvaluation of Cardiac function.pptx
Evaluation of Cardiac function.pptx
 
Carotid INTRODUCTION
Carotid INTRODUCTIONCarotid INTRODUCTION
Carotid INTRODUCTION
 

More from Nizam Uddin

Wide complex tachycardia
Wide complex tachycardiaWide complex tachycardia
Wide complex tachycardiaNizam Uddin
 
Management of Cardiogenic shock
Management of Cardiogenic shockManagement of Cardiogenic shock
Management of Cardiogenic shockNizam Uddin
 
Echo assessment of Aortic valve disease, Dr Ferdous assistant registrar, Card...
Echo assessment of Aortic valve disease, Dr Ferdous assistant registrar, Card...Echo assessment of Aortic valve disease, Dr Ferdous assistant registrar, Card...
Echo assessment of Aortic valve disease, Dr Ferdous assistant registrar, Card...Nizam Uddin
 
Echo assesment of rv function
Echo assesment of rv function Echo assesment of rv function
Echo assesment of rv function Nizam Uddin
 
Asd investigations and management
Asd investigations and managementAsd investigations and management
Asd investigations and managementNizam Uddin
 
Basic pacing concepts
Basic pacing conceptsBasic pacing concepts
Basic pacing conceptsNizam Uddin
 
Pregnant heart 111
Pregnant heart 111Pregnant heart 111
Pregnant heart 111Nizam Uddin
 
Pulmonary stenosis presentation
Pulmonary stenosis presentationPulmonary stenosis presentation
Pulmonary stenosis presentationNizam Uddin
 
Dyslipidemia by dr. topu
Dyslipidemia by dr. topuDyslipidemia by dr. topu
Dyslipidemia by dr. topuNizam Uddin
 
Mitral Stenosis Case presentation
Mitral Stenosis Case presentationMitral Stenosis Case presentation
Mitral Stenosis Case presentationNizam Uddin
 
Asd case dr. bayazid
Asd case dr. bayazid Asd case dr. bayazid
Asd case dr. bayazid Nizam Uddin
 
Atrial Firbrilation rubayet
Atrial Firbrilation rubayetAtrial Firbrilation rubayet
Atrial Firbrilation rubayetNizam Uddin
 
Acute rheumatic fever
Acute rheumatic feverAcute rheumatic fever
Acute rheumatic feverNizam Uddin
 
Perioperative Cardiovascular Risk assessment
Perioperative Cardiovascular Risk assessmentPerioperative Cardiovascular Risk assessment
Perioperative Cardiovascular Risk assessmentNizam Uddin
 
Heart failure imrose
Heart failure imroseHeart failure imrose
Heart failure imroseNizam Uddin
 
Drugs in Heart Failure samia
Drugs  in Heart Failure  samiaDrugs  in Heart Failure  samia
Drugs in Heart Failure samiaNizam Uddin
 
Tetralogy of Fallot long case discussion
Tetralogy of Fallot long case discussionTetralogy of Fallot long case discussion
Tetralogy of Fallot long case discussionNizam Uddin
 
Aortic dissection dr.tapu
Aortic dissection dr.tapuAortic dissection dr.tapu
Aortic dissection dr.tapuNizam Uddin
 

More from Nizam Uddin (20)

Wide complex tachycardia
Wide complex tachycardiaWide complex tachycardia
Wide complex tachycardia
 
Tof long case
Tof long caseTof long case
Tof long case
 
Management of Cardiogenic shock
Management of Cardiogenic shockManagement of Cardiogenic shock
Management of Cardiogenic shock
 
Echo assessment of Aortic valve disease, Dr Ferdous assistant registrar, Card...
Echo assessment of Aortic valve disease, Dr Ferdous assistant registrar, Card...Echo assessment of Aortic valve disease, Dr Ferdous assistant registrar, Card...
Echo assessment of Aortic valve disease, Dr Ferdous assistant registrar, Card...
 
Echo assesment of rv function
Echo assesment of rv function Echo assesment of rv function
Echo assesment of rv function
 
Asd investigations and management
Asd investigations and managementAsd investigations and management
Asd investigations and management
 
Basic pacing concepts
Basic pacing conceptsBasic pacing concepts
Basic pacing concepts
 
Pregnant heart 111
Pregnant heart 111Pregnant heart 111
Pregnant heart 111
 
Pulmonary stenosis presentation
Pulmonary stenosis presentationPulmonary stenosis presentation
Pulmonary stenosis presentation
 
Dyslipidemia by dr. topu
Dyslipidemia by dr. topuDyslipidemia by dr. topu
Dyslipidemia by dr. topu
 
Mitral Stenosis Case presentation
Mitral Stenosis Case presentationMitral Stenosis Case presentation
Mitral Stenosis Case presentation
 
Asd case dr. bayazid
Asd case dr. bayazid Asd case dr. bayazid
Asd case dr. bayazid
 
Asd long case
Asd long caseAsd long case
Asd long case
 
Atrial Firbrilation rubayet
Atrial Firbrilation rubayetAtrial Firbrilation rubayet
Atrial Firbrilation rubayet
 
Acute rheumatic fever
Acute rheumatic feverAcute rheumatic fever
Acute rheumatic fever
 
Perioperative Cardiovascular Risk assessment
Perioperative Cardiovascular Risk assessmentPerioperative Cardiovascular Risk assessment
Perioperative Cardiovascular Risk assessment
 
Heart failure imrose
Heart failure imroseHeart failure imrose
Heart failure imrose
 
Drugs in Heart Failure samia
Drugs  in Heart Failure  samiaDrugs  in Heart Failure  samia
Drugs in Heart Failure samia
 
Tetralogy of Fallot long case discussion
Tetralogy of Fallot long case discussionTetralogy of Fallot long case discussion
Tetralogy of Fallot long case discussion
 
Aortic dissection dr.tapu
Aortic dissection dr.tapuAortic dissection dr.tapu
Aortic dissection dr.tapu
 

Recently uploaded

Call Girl Koramangala | 7001305949 At Low Cost Cash Payment Booking
Call Girl Koramangala | 7001305949 At Low Cost Cash Payment BookingCall Girl Koramangala | 7001305949 At Low Cost Cash Payment Booking
Call Girl Koramangala | 7001305949 At Low Cost Cash Payment Bookingnarwatsonia7
 
Hemostasis Physiology and Clinical correlations by Dr Faiza.pdf
Hemostasis Physiology and Clinical correlations by Dr Faiza.pdfHemostasis Physiology and Clinical correlations by Dr Faiza.pdf
Hemostasis Physiology and Clinical correlations by Dr Faiza.pdfMedicoseAcademics
 
Call Girls Whitefield Just Call 7001305949 Top Class Call Girl Service Available
Call Girls Whitefield Just Call 7001305949 Top Class Call Girl Service AvailableCall Girls Whitefield Just Call 7001305949 Top Class Call Girl Service Available
Call Girls Whitefield Just Call 7001305949 Top Class Call Girl Service Availablenarwatsonia7
 
Call Girl Bangalore Nandini 7001305949 Independent Escort Service Bangalore
Call Girl Bangalore Nandini 7001305949 Independent Escort Service BangaloreCall Girl Bangalore Nandini 7001305949 Independent Escort Service Bangalore
Call Girl Bangalore Nandini 7001305949 Independent Escort Service Bangalorenarwatsonia7
 
Bangalore Call Girls Marathahalli 📞 9907093804 High Profile Service 100% Safe
Bangalore Call Girls Marathahalli 📞 9907093804 High Profile Service 100% SafeBangalore Call Girls Marathahalli 📞 9907093804 High Profile Service 100% Safe
Bangalore Call Girls Marathahalli 📞 9907093804 High Profile Service 100% Safenarwatsonia7
 
Call Girls Hsr Layout Just Call 7001305949 Top Class Call Girl Service Available
Call Girls Hsr Layout Just Call 7001305949 Top Class Call Girl Service AvailableCall Girls Hsr Layout Just Call 7001305949 Top Class Call Girl Service Available
Call Girls Hsr Layout Just Call 7001305949 Top Class Call Girl Service Availablenarwatsonia7
 
Bangalore Call Girls Majestic 📞 9907093804 High Profile Service 100% Safe
Bangalore Call Girls Majestic 📞 9907093804 High Profile Service 100% SafeBangalore Call Girls Majestic 📞 9907093804 High Profile Service 100% Safe
Bangalore Call Girls Majestic 📞 9907093804 High Profile Service 100% Safenarwatsonia7
 
Call Girls Jp Nagar Just Call 7001305949 Top Class Call Girl Service Available
Call Girls Jp Nagar Just Call 7001305949 Top Class Call Girl Service AvailableCall Girls Jp Nagar Just Call 7001305949 Top Class Call Girl Service Available
Call Girls Jp Nagar Just Call 7001305949 Top Class Call Girl Service Availablenarwatsonia7
 
VIP Call Girls Pune Vrinda 9907093804 Short 1500 Night 6000 Best call girls S...
VIP Call Girls Pune Vrinda 9907093804 Short 1500 Night 6000 Best call girls S...VIP Call Girls Pune Vrinda 9907093804 Short 1500 Night 6000 Best call girls S...
VIP Call Girls Pune Vrinda 9907093804 Short 1500 Night 6000 Best call girls S...Miss joya
 
Call Girls In Andheri East Call 9920874524 Book Hot And Sexy Girls
Call Girls In Andheri East Call 9920874524 Book Hot And Sexy GirlsCall Girls In Andheri East Call 9920874524 Book Hot And Sexy Girls
Call Girls In Andheri East Call 9920874524 Book Hot And Sexy Girlsnehamumbai
 
VIP Call Girls Mumbai Arpita 9910780858 Independent Escort Service Mumbai
VIP Call Girls Mumbai Arpita 9910780858 Independent Escort Service MumbaiVIP Call Girls Mumbai Arpita 9910780858 Independent Escort Service Mumbai
VIP Call Girls Mumbai Arpita 9910780858 Independent Escort Service Mumbaisonalikaur4
 
College Call Girls Pune Mira 9907093804 Short 1500 Night 6000 Best call girls...
College Call Girls Pune Mira 9907093804 Short 1500 Night 6000 Best call girls...College Call Girls Pune Mira 9907093804 Short 1500 Night 6000 Best call girls...
College Call Girls Pune Mira 9907093804 Short 1500 Night 6000 Best call girls...Miss joya
 
Call Girls Hosur Just Call 7001305949 Top Class Call Girl Service Available
Call Girls Hosur Just Call 7001305949 Top Class Call Girl Service AvailableCall Girls Hosur Just Call 7001305949 Top Class Call Girl Service Available
Call Girls Hosur Just Call 7001305949 Top Class Call Girl Service Availablenarwatsonia7
 
Call Girls ITPL Just Call 7001305949 Top Class Call Girl Service Available
Call Girls ITPL Just Call 7001305949 Top Class Call Girl Service AvailableCall Girls ITPL Just Call 7001305949 Top Class Call Girl Service Available
Call Girls ITPL Just Call 7001305949 Top Class Call Girl Service Availablenarwatsonia7
 
Russian Call Girls Chickpet - 7001305949 Booking and charges genuine rate for...
Russian Call Girls Chickpet - 7001305949 Booking and charges genuine rate for...Russian Call Girls Chickpet - 7001305949 Booking and charges genuine rate for...
Russian Call Girls Chickpet - 7001305949 Booking and charges genuine rate for...narwatsonia7
 
Sonagachi Call Girls Services 9907093804 @24x7 High Class Babes Here Call Now
Sonagachi Call Girls Services 9907093804 @24x7 High Class Babes Here Call NowSonagachi Call Girls Services 9907093804 @24x7 High Class Babes Here Call Now
Sonagachi Call Girls Services 9907093804 @24x7 High Class Babes Here Call NowRiya Pathan
 
Call Girl Surat Madhuri 7001305949 Independent Escort Service Surat
Call Girl Surat Madhuri 7001305949 Independent Escort Service SuratCall Girl Surat Madhuri 7001305949 Independent Escort Service Surat
Call Girl Surat Madhuri 7001305949 Independent Escort Service Suratnarwatsonia7
 

Recently uploaded (20)

Call Girl Koramangala | 7001305949 At Low Cost Cash Payment Booking
Call Girl Koramangala | 7001305949 At Low Cost Cash Payment BookingCall Girl Koramangala | 7001305949 At Low Cost Cash Payment Booking
Call Girl Koramangala | 7001305949 At Low Cost Cash Payment Booking
 
Hemostasis Physiology and Clinical correlations by Dr Faiza.pdf
Hemostasis Physiology and Clinical correlations by Dr Faiza.pdfHemostasis Physiology and Clinical correlations by Dr Faiza.pdf
Hemostasis Physiology and Clinical correlations by Dr Faiza.pdf
 
sauth delhi call girls in Bhajanpura 🔝 9953056974 🔝 escort Service
sauth delhi call girls in Bhajanpura 🔝 9953056974 🔝 escort Servicesauth delhi call girls in Bhajanpura 🔝 9953056974 🔝 escort Service
sauth delhi call girls in Bhajanpura 🔝 9953056974 🔝 escort Service
 
Call Girls Whitefield Just Call 7001305949 Top Class Call Girl Service Available
Call Girls Whitefield Just Call 7001305949 Top Class Call Girl Service AvailableCall Girls Whitefield Just Call 7001305949 Top Class Call Girl Service Available
Call Girls Whitefield Just Call 7001305949 Top Class Call Girl Service Available
 
Call Girl Bangalore Nandini 7001305949 Independent Escort Service Bangalore
Call Girl Bangalore Nandini 7001305949 Independent Escort Service BangaloreCall Girl Bangalore Nandini 7001305949 Independent Escort Service Bangalore
Call Girl Bangalore Nandini 7001305949 Independent Escort Service Bangalore
 
Bangalore Call Girls Marathahalli 📞 9907093804 High Profile Service 100% Safe
Bangalore Call Girls Marathahalli 📞 9907093804 High Profile Service 100% SafeBangalore Call Girls Marathahalli 📞 9907093804 High Profile Service 100% Safe
Bangalore Call Girls Marathahalli 📞 9907093804 High Profile Service 100% Safe
 
Call Girls Hsr Layout Just Call 7001305949 Top Class Call Girl Service Available
Call Girls Hsr Layout Just Call 7001305949 Top Class Call Girl Service AvailableCall Girls Hsr Layout Just Call 7001305949 Top Class Call Girl Service Available
Call Girls Hsr Layout Just Call 7001305949 Top Class Call Girl Service Available
 
Bangalore Call Girls Majestic 📞 9907093804 High Profile Service 100% Safe
Bangalore Call Girls Majestic 📞 9907093804 High Profile Service 100% SafeBangalore Call Girls Majestic 📞 9907093804 High Profile Service 100% Safe
Bangalore Call Girls Majestic 📞 9907093804 High Profile Service 100% Safe
 
Call Girls Jp Nagar Just Call 7001305949 Top Class Call Girl Service Available
Call Girls Jp Nagar Just Call 7001305949 Top Class Call Girl Service AvailableCall Girls Jp Nagar Just Call 7001305949 Top Class Call Girl Service Available
Call Girls Jp Nagar Just Call 7001305949 Top Class Call Girl Service Available
 
VIP Call Girls Pune Vrinda 9907093804 Short 1500 Night 6000 Best call girls S...
VIP Call Girls Pune Vrinda 9907093804 Short 1500 Night 6000 Best call girls S...VIP Call Girls Pune Vrinda 9907093804 Short 1500 Night 6000 Best call girls S...
VIP Call Girls Pune Vrinda 9907093804 Short 1500 Night 6000 Best call girls S...
 
Call Girls In Andheri East Call 9920874524 Book Hot And Sexy Girls
Call Girls In Andheri East Call 9920874524 Book Hot And Sexy GirlsCall Girls In Andheri East Call 9920874524 Book Hot And Sexy Girls
Call Girls In Andheri East Call 9920874524 Book Hot And Sexy Girls
 
VIP Call Girls Mumbai Arpita 9910780858 Independent Escort Service Mumbai
VIP Call Girls Mumbai Arpita 9910780858 Independent Escort Service MumbaiVIP Call Girls Mumbai Arpita 9910780858 Independent Escort Service Mumbai
VIP Call Girls Mumbai Arpita 9910780858 Independent Escort Service Mumbai
 
College Call Girls Pune Mira 9907093804 Short 1500 Night 6000 Best call girls...
College Call Girls Pune Mira 9907093804 Short 1500 Night 6000 Best call girls...College Call Girls Pune Mira 9907093804 Short 1500 Night 6000 Best call girls...
College Call Girls Pune Mira 9907093804 Short 1500 Night 6000 Best call girls...
 
Call Girls Hosur Just Call 7001305949 Top Class Call Girl Service Available
Call Girls Hosur Just Call 7001305949 Top Class Call Girl Service AvailableCall Girls Hosur Just Call 7001305949 Top Class Call Girl Service Available
Call Girls Hosur Just Call 7001305949 Top Class Call Girl Service Available
 
Call Girls ITPL Just Call 7001305949 Top Class Call Girl Service Available
Call Girls ITPL Just Call 7001305949 Top Class Call Girl Service AvailableCall Girls ITPL Just Call 7001305949 Top Class Call Girl Service Available
Call Girls ITPL Just Call 7001305949 Top Class Call Girl Service Available
 
Russian Call Girls Chickpet - 7001305949 Booking and charges genuine rate for...
Russian Call Girls Chickpet - 7001305949 Booking and charges genuine rate for...Russian Call Girls Chickpet - 7001305949 Booking and charges genuine rate for...
Russian Call Girls Chickpet - 7001305949 Booking and charges genuine rate for...
 
Sonagachi Call Girls Services 9907093804 @24x7 High Class Babes Here Call Now
Sonagachi Call Girls Services 9907093804 @24x7 High Class Babes Here Call NowSonagachi Call Girls Services 9907093804 @24x7 High Class Babes Here Call Now
Sonagachi Call Girls Services 9907093804 @24x7 High Class Babes Here Call Now
 
Call Girl Surat Madhuri 7001305949 Independent Escort Service Surat
Call Girl Surat Madhuri 7001305949 Independent Escort Service SuratCall Girl Surat Madhuri 7001305949 Independent Escort Service Surat
Call Girl Surat Madhuri 7001305949 Independent Escort Service Surat
 
Russian Call Girls in Delhi Tanvi ➡️ 9711199012 💋📞 Independent Escort Service...
Russian Call Girls in Delhi Tanvi ➡️ 9711199012 💋📞 Independent Escort Service...Russian Call Girls in Delhi Tanvi ➡️ 9711199012 💋📞 Independent Escort Service...
Russian Call Girls in Delhi Tanvi ➡️ 9711199012 💋📞 Independent Escort Service...
 
Escort Service Call Girls In Sarita Vihar,, 99530°56974 Delhi NCR
Escort Service Call Girls In Sarita Vihar,, 99530°56974 Delhi NCREscort Service Call Girls In Sarita Vihar,, 99530°56974 Delhi NCR
Escort Service Call Girls In Sarita Vihar,, 99530°56974 Delhi NCR
 

Echocardiography Evaluates Coronary Artery Disease

  • 1. 811 Echocardiographic Evaluation of Coronary Artery Disease Stephanie A. Coulter oronary artery disease (CAD) is the most prevalent of cardiac diseases. Routine evaluation of patients with suspected or known CAD nearly always includes echocardiography. Echocardiography is a versatile, low-cost, and portable technique that is available clinically in nearly all medical centers and subsequently is the most widely uti- lized cardiac testing modality. The diagnosis of CAD by echocardiography is based on the concept that acute myocar- dial ischemia or infarction produces a detectable impairment in regional left ventricular (LV) mechanical function. Identi- fication of patients with suspected CAD and acute coronary syndrome is one of the primary indications for echocardiog- raphy. Assessment of global LV systolic function and detec- tion of the presence and extent of regional myocardial dysfunction are routine clinical indications for echocardiog- raphy. This method also has an important prognostic value in patients with acute and chronic CAD. When combined with exercise or pharmacologic stress testing, echocardiog- raphy can identify patients with myocardial ischemia and viability. Because echocardiography can provide a compre- hensive assessment of cardiac structure, function and possi- bly perfusion at the bedside, it is likely to be the technique of choice for years to come. Measurement of Regional Myocardial Function Regional Wall-Motion Abnormalities Regional systolic and diastolic function can be characterized by measuring one or more of the following parameters: the timing of regional events, regional myocardial thickening and thinning, and the velocity and direction of regional myo- cardial motion.1 With echocardiography, a regional wall- motion abnormality (RWMA) is characterized as a localized decrease in the rate and amplitude of endomyocardial motion. These abnormalities are accompanied by a reduction in myocardial thickening during systolic contraction and by thinning of the myocardial segment after a transmural myocardial infarction (MI). The loss of systolic wall thickening is more specific for myocardial ischemia than is the detection of a resting RWMA2–5 because cardiac rotation, translational motion during contraction of border- ing segments, and loading conditions affect the latter finding. An RWMA is not specific for coronary ischemia and also occurs with a previous MI, a previous sternotomy, myocar- ditis, cardiomyopathies, left bundle branch block, and preexcitation. The American Association of Echocardiography rec- ommends a 16-segment standardized format for describing RWMAs.5 To update and unify reporting of wall-motion analysis among disparate cardiac-imaging modalities, in 2002 the American Heart Association (AHA) issued a state- ment on myocardial segmentation and nomenclature that revised the format to include 17 segments (Figs. 35.1 and 35.2).6 In both the 16- and 17-segment formats, the ventricle is divided into roughly equal thirds perpendicular to the apical long axis of the heart (basal, midventricular, and apical on short-axis imaging). The basal segments extend from the mitral annulus to the tips of the papillary muscles at end- diastole. The midcavitary segments extend the length of the papillary muscle. The apical view begins just beyond the papillary muscles and extends to just before the end of the cavity. The 17th segment encompasses the true apex, or apical cap, which includes the portion of the apical myocar- dium not bordered by the ventricular cavity. 3 5 Measurement of Regional Myocardial Function . . . . . . 811 Assessment of Coronary Ischemia/Acute Myocardial Infarction . . . . . . . . . . . . . . . . . . . . . . . . . . . . . . . . . . . 813 Location of Acute Myocardial Infarction . . . . . . . . . . . . 814 Extent of Acute Myocardial Infarction . . . . . . . . . . . . . . 815 Acute Complications of Acute Myocardial Infarction . . . . . . . . . . . . . . . . . . . . . . . . . . . . . . . . . . . 815 Chronic Complications After a Myocardial Infarction . . . . . . . . . . . . . . . . . . . . . . . . . . . . . . . . . . . . . 819 Prognosis in Acute Myocardial Infarction and Chronic Coronary Artery Disease . . . . . . . . . . . . . . . 821 Stress Echocardiography: Assessment of Ischemic and Viable Myocardium . . . . . . . . . . . . . . . . . . . . . . . 823 C CAR035.indd 811CAR035.indd 811 11/29/2006 3:33:06 PM11/29/2006 3:33:06 PM
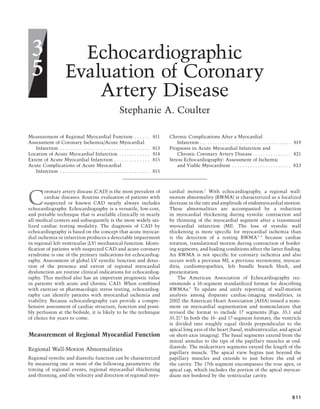
  • 2. 812 c h a p t e r 35 Four chamber Apical cap Apical lateral Mid anterolateral Basal anterolateral Basal inferoseptum Apical septum Mid inferoseptum Two chamber Apical cap Apical inferior Mid inferior Basal inferior Apical anterior Mid anterior Basal anterior Long axis Apical cap Apical lateral Mid inferolateral Basal inferolateral Basal anteroseptum Mid anteroseptum Apical anterior Anterior Anterior Anterior Base Mid Apex Antero- septum Antero- septum Infero- septum Infero- septum Interior Interior Interior Infero- lateral Infero- lateral Antero- lateral Antero- lateral LateralSeptal 1 2 4 5 6 2 1 3 3 4 5 6 1. basal anterior 7. mid anterior Left ventricular segmentation 8. mid anteroseptal2. basal anteroseptal 3. basal inferoseptal 9. mid inferoseptal 4. basal inferior 5. basal inferolateral 6. basal anterolateral 10. mid inferior 11. mid inferolateral 12. mid anterolateral 17. apex 16. apical lateral 15. apical anferior 13. apical anterior 4 5 11 10 159 3 2 8 14 17 16 13 12 6 7 1 14. apical septal ommended a four-point wall-motion scoring system,8,9 but the American Society of Echocardiography (ASE) recently continued to advocate a five-point scoring system, which included the discrimination of aneurysmal segments.7 The 16-segment format is recommended for evaluating regional LV dysfunction with two-dimensional (2D) echocardiogra- phy, because the 17th apical segment does not exhibit inward motion.7 Although the coronary artery blood supply to the myocardial segments varies, the typical relationship between the three coronary arteries and the myocardial segments is illustrated in Figure 35.3. Regional Myocardial Doppler Velocities Differentiation of passive motion from active myocardial shortening or thickening is limited by the temporal resolu- tion (about 90ms) required to detect differences in motion with the unaided human eye.10 Measurement of the speed of motion of low-frequency myocardial tissue can be obtained with pulsed-wave tissue Doppler imaging (TDI), which ex- cludes the high-frequency velocities of the rapidly moving blood. Assessment of peak regional myocardial velocities with TDI techniques can be achieved in simultaneous seg- ments at high frame rates. The accuracy of tissue Doppler imaging is limited by translational motion and tethering effects.11–16 Clinical limitations of this technique are attrib- uted to the complexity of myofiber orientation, which creates motion in three dimensions: longitudinal shortening (base > middle > apex), radial thickening (all segments), and circum- ferential rotation (apex). Ability to image in only one plane and misalignment of the Doppler probe with the vector of cardiac motion diminish the accuracy of Doppler velocity imaging and may limit its clinical applicability at this time.17 Strain imaging is a method for calculating regional myocar- dial function from TDI velocity data, which theoretically is FIGURE 35.1. Analysis of wall motion. The left ventricle (LV) can be divided into 17 segments and identified by a series of longitudinal views: 1, apical four chamber; 2, apical two chamber; 3, apical long axis, or a series of short-axis views; 4, base (short axis at the tips of the mitral leaflets); 5, mid-cavity (short axis at the papillary muscles); and 6, apex (short axis beyond the papillary muscles but before cavity ends). The longitudinal and short-axis views overlap and complement each other. The apical cap, the 17th segment, can be appreciated only by echocardiography with contrast opacification of the LV cavity. A 16-segment model can be used without the apical cap. long axis; apical four chamber; apical three chamber; apical two chamber. FIGURE 35.2. Display, on a circumferential polar plot, of the 17 myocardial segments and the recommended nomenclature for tomographic imaging of the heart. The wall-motion score index is an expression of regional LV function that is directly proportional to the severity and extent of an RWMA. Each myocardial segment is scored on a scale of 1 to 5, according to a qualitative assessment of regional function and systolic thickening (normal, 1; hypo- kinesis, 2; akinesis, negligible thinning, 3; dyskinesis, paradoxical systolic motion, 4; and aneurysm, diastolic deformation, 5) (Table 35.1). The composite score, divided by the number of segments, provides a semiquantitative evalu- ation of regional wall motion.5,7 Previous authors have rec- CAR035.indd 812CAR035.indd 812 11/29/2006 3:33:06 PM11/29/2006 3:33:06 PM
  • 3. ec hoc a r diog r a p h ic eva luat ion of corona ry a rt e ry dise a se 813 not confounded by translational movement or tethering.17 Strain rates reflect the speed of regional myocardial longitu- dinal deformation and are calculated from myocardial TDI velocities measured at two locations separated by a given distance.7 The longitudinal segmental strain rate is uniform throughout all segments, whereas TDI is greatest at the base and deteriorates as the motion becomes more circumferen- tial toward the apex.12,15,18 With ultrasonic strain-rate imaging, both the amount of deformation (strain) and the rate of local deformation (strain rate) can be quantified.13 Myocardial Performance Index The myocardial performance index (MPI) provides a nonin- vasive, semiquantitative assessment of global LV function, incorporating systolic and diastolic function. The MPI is the sum of the diastolic intervals, isovolumic relaxation time, and isovolumic contraction time, divided by the systolic LV ejection time. The MPI is reproducible and less dependent on the heart rate and preload than are traditional Doppler mea- surements.19,20 In the normal heart isovolumic diastolic times shorten with increasing contractility.21,22 With ischemia, the MPI has been shown to deteriorate as the isovolumic relax- ation time increases relative to ejection times.23 In patients with known LV dysfunction after an acute MI who were enrolled in the Survival and Ventricular Enlargement (SAVE) trial,24 an MPI of >0.5 was associated with a larger infarct size and reduced baseline LV systolic function. The MPI was also identified as an independent predictor for cardiovascular events after an MI in patients with LV systolic dysfunction. Because diastolic abnormalities precede the development of systolic alterations in the ischemic cascade, the MPI may be more sensitive for the detection of myocardial ischemia. It has been utilized with dobutamine stress echocardiography (DSE) for the detection of ischemia after an MI. The MPI provided added prognostic value to DSE and accurately reflected the LV contractile state during low-dose DSE.23 The MPI may reflect the overall LV functional reserve. Unfortunately, systolic wall motion and thickening is often difficult to detect and quantify. Doppler techniques lack clinical applicability, and determining the myocardial performance index is time-consuming. Therefore, 2D gray- scale echocardiographic assessment remains the standard clinical modality for detecting RWMAs. Assessment of Coronary Ischemia/Acute Myocardial Infarction The echocardiographic evaluation of coronary ischemia and of regional myocardial dysfunction during an MI varies widely over a range of coronary blood flows.25 Regional wall- motion abnormalities occur with coronary artery stenosis of >85% at rest and >50% during exercise or hyperemia.7 They arise within seconds after a coronary occlusion is induced TABLE 35.1. 1. Wall motion score Score Wall motion Definition 1 Normal/hyperkinesis Normal systolic motion and thickening 2 Hypokinesis Reduced systolic motion or thickening 3 Akinesis Absent inward systolic motion or thickening 4 Dyskinesis Paradoxic (“bulging”) or outward motion 5 Aneurysmal Diastolic deformation Each segment should be analyzed and individually scored according to its systolic motion and thickening. Confirma- tion should be made with multiple views. Four chamber1 Base RCA LAD Cx RCA or Cx LAD or Cx RCA or LAD 4 Mid5 Apex6 Two chamber2 Long axis3 FIGURE 35.3. Typical distri- butions of the right coronary artery (RCA), the left anterior descending (LAD), and the circumflex (Cx) coronary arteries. The arterial distribu- tion varies between patients. Some segments have variable coronary perfusion. CAR035.indd 813CAR035.indd 813 11/29/2006 3:33:06 PM11/29/2006 3:33:06 PM
  • 4. 814 c h a p t e r 35 by balloon inflation during angioplasty and may last for up to several days with prolonged ischemia.26,27 These abnor- malities precede the development of electrocardiographic irregularities and the onset of cardiac symptoms. Figure 35.4 illustrates the cascade from myocardial ischemia to infarc- tion. During an episode of acute ischemic chest pain, 2D imaging should show RMWAs that normalize on resolution of the ischemia unless the duration of ischemia is suffi- ciently long to induce myocardial stunning.28 The transient nature of the RMWA differentiates a brief episode of acute myocardial ischemia from an acute MI. The presence of an RWMA does not establish the diagnosis of acute ischemia. However, the presence of an aneurysm and myocardial thin- ning suggests a previous ischemic event. For diagnosing acute coronary ischemia, echocardiography has a high sensi- tivity but a low specificity.29,30 In a large study,29 1017 patients with suspected cardiac chest pain without ST-segment elevation were evaluated with standard clinical and electrocardiographic variables in the emergency room. The presence of RWMAs was assessed with 2D echocardiography. The sensitivity of RWMAs for detecting acute coronary syndrome was 88%, but the speci- ficity was only 18%. Patients with RWMAs were 6.1 times more likely to experience an early cardiac event than those without RWMAs. The presence of a RWMA significantly increased the ability of clinical and electrocardiographic variables to predict early (within 48 hours) major adverse cardiac events. In patients with symptoms of an acute co- ronary syndrome, nondiagnostic electrocardiography, and normal biochemical markers, demonstration of normal global systolic function by handheld echocardiography had a 91% negative predictive value for acute MI.31 The addition of perfusion imaging to routine echocardiographic assessment of RWMAs and clinical variables in patients with suspected cardiac chest pain and nondiagnostic electrocardiograms improved the prediction of cardiac events. The addition of perfusion imaging in patients with suspected cardiac chest pain and nondiagnostic electrocardiograms further enhanced the clinical Thrombolysis in Myocardial Infarction (TIMI) risk score and the ability of RWMAs to predict cardiac events (Fig. 35.5).32 Because early detection of RWMAs adds significant diag- nostic and prognostic value to the routine evaluation of patients who present to the emergency department with sus- pected cardiac chest pain, a joint task force of the American College of Cardiology (ACC), AHA, and ASE in 2003 issued a class I recommendation for the use of echocardiography in diagnosing suspected ischemia or infarction when standard means of diagnosis were inconclusive.33,34 Location of Acute Myocardial Infarction Two-dimensional and Doppler echocardiography provides assessment of the location and extent of myocardial damage, associated and preexisting valvular dysfunction, and ven- tricular and pulmonary artery pressures. Cardiac enzymes and the electrocardiogram are crude determinants of infarct size and location.35 Validation studies with thallium-201 scintigraphy, technetium-99m pyrophosphate (99m Tc-PYP) scintigraphy, serum creatine kinase–MB levels, and coronary arteriography demonstrate that 2D echocardiography accu- rately detects and identifies the anatomic location of MIs.36–39 Two-dimensional echocardiography is less precise (sensitiv- ity, 60% to 75%) in detecting nontransmural MIs, presum- ably because transmural muscle loss is less than 20% and preservation of the contractility of subepicardial myocardial layers can mask subendocardial dysfunction.40 With an acute MI, the uninvolved myocardium shows a compensatory hyperdynamic contractile response, the absence of which may indicate multivessel disease.41 The location of RWMAs correlates with the distribution of the occluded coro- nary artery, especially if the obstruction involves the left anterior descending (LAD) or posterior descending coronary arteries.42 Perfusion deficits Metabolic abnormalities Wall motion abnormalities ECG changes Global LV dysfunction Stunning/Hibernation Necrosis MI Chest pain Elevation of LVEDP (SOB) Resting flow reduction Rest Exercise time Workload(HRxBP) FIGURE 35.4. Ischemic cascade. Schematic representation of the clinical, electrocardiographic, and echocardiographic manifesta- tions of myocardial ischemia as the workload (rate-pressure product) and duration of stress is increased. SOB, shortness of breath. 1.0 0.8 0.6 0.4 0.2 0.0 0 2 4 6 8 10 12 Months of follow-up Event-freesurvival 14 16 18 20 Abnormal RF, Abnormal MP Abnormal RF, Normal MP Normal RF, Normal MP 22 24 FIGURE 35.5. Perfusion imaging enhances the clinical prediction of future cardiac events in patients with suspected cardiac chest pain. Event-free survival in patients with an intermediate-risk mod- ified Thrombolysis in Myocardial Infarction (TIMI) score (3 or 4). MP, myocardial perfusion; RF, regional left ventricular function. CAR035.indd 814CAR035.indd 814 11/29/2006 3:33:07 PM11/29/2006 3:33:07 PM
  • 5. ec hoc a r diog r a p h ic eva luat ion of corona ry a rt e ry dise a se 815 Left anterior descending artery obstruction creates severe wall-motion abnormalities (akinesis with complete obstruc- tion) of the septum, anterior wall, and apex. These segments are best visualized from the parasternal long-axis (anterosep- tum), and apical four- (septum and apex) and two-chamber (anterior wall and apex) views. The location of the obstruc- tion along the vessel length (proximal, middle, or distal) corresponds to the severity and extent of the resulting RWMA. The LAD may supply a variable (and often large) proportion of the LV apex. Occlusion of the LAD may lead to distal inferior and distal inferolateral wall-motion abnormalities. Left circumflex artery (LCx) occlusion typically affects perfusion of the anterolateral and inferolateral segments. Imaging in the parasternal long-axis (inferolateral wall) and the apical four- and apical long-axis views (inferolateral wall) augment the short-axis exam for visualization of the typical LCx infarction. In approximately 20% of patients, the LCx supplies the posterior descending artery (left dominant system), and interruption of the LCx blood flow can lead to an extensive RWMA that may also include the inferior septum and inferior free wall. Occlusion of the right coronary artery (RCA) results in an inferior RWMA. With proximal RCA occlusion, infarc- tion of the right ventricle may result (see below). The poste- rior descending artery, a branch of the RCA (right dominant system) in 80% of patients, supplies the bulk of coronary flow to the inferior wall. Right coronary artery occlusion usually spares the apex. Two-dimensional imaging in the short-axis, basal, and midventricular views, confirmed by the apical two-chamber view, best reveals inferior wall- motion abnormalities resulting from RCA occlusion. Careful attention to right ventricle (RV) size and function are impor- tant with acute inferior wall infarction. Bypass grafts and collateral blood flow will blur these generalizations. A common post-bypass RWMA pattern in- cludes paradoxic septal motion with marked hypokinesis to akinesis of the septum and normal motion of the anterior wall (in the absence of a previous anterior infarct). Extent of Acute Myocardial Infarction Cardiac enzymes and electrocardiography are crude indica- tors of infarct size and location.42 Validation studies with thallium-201 scintigraphy, pyrophosphate (99m Tc-PYP) scin- tigraphy, serum creatine kinase–MB levels, and coronary arteriography have shown that 2D echocardiography accu- rately detects and identifies the anatomic location of MIs.36,37,43,44 The location of RWMAs correlates with the dis- tribution of the occluded coronary artery, especially if the obstruction involves the LAD or posterior descending coro- nary arteries.42 In postinfarct patients, LV systolic function is routinely measured by the LV ejection fraction (LVEF) on 2D echocar- diography. The extent of the infarction can be quantified with the wall-motion score index. Echocardiography overes- timates the infarct size in the presence of a previous infarc- tion and after reperfusion. Reperfusion after an infarct often leads to early (usually <14 days) improvement in the LVEF as stunned myocardial segments recover.45,46 In a review of 249 patients following revascularization for MI serial echocar- diographic studies in 58% showed complete or partial recov- ery of function. Most of those who improved had more than a 5% increase in LVEF.46 Echocardiographic assessment of the infarct size is limited by this method’s inadequate sen- sitivity in differentiating old versus new infarctions.43 The 2003 ACC/AHA/ASE task force issued a class I recommendation for the use of echocardiography to assess infarct size and ventricular function when the results are used to guide therapy. It gave a class IIa recommendation (weight of evidence/opinion is in favor of usefulness/efficacy) for echocardiographic assessment of ventricular function after revascularization.33,34 Acute Complications of Acute Myocardial Infarction Left Ventricular Failure/Cardiogenic Shock Cardiogenic shock, a state of inadequate tissue perfusion related to cardiac dysfunction, complicates approximately 6% to 7% of acute MIs.47–50 Left ventricular pump failure usually accounts for acute hemodynamic deterioration. In a small number of patients, however, the cause may be a com- plication of an acute MI such as rupture of the ventricular septum, free wall, or papillary muscle with acute severe mitral regurgitation (MR). A high index of suspicion for one of these major complications in a patient with hypotension, tachycardia, a new systolic murmur, or congestive heart failure is required for rapid diagnosis and appropriate medical and surgical intervention.51 Two-dimensional echocardiogra- phy and pulsed-wave and color-flow Doppler imaging provide a comprehensive assessment of the anatomic and hemody- namic status at the bedside and therefore are recommended for patients with hemodynamic deterioration. Cardiac Rupture Free-Wall Rupture Rupture of the free wall of the left or right ventricle is found in less than 1% of living patients with an acute MI,52 but in as many as 26% autopsied patients who died with an acute MI.53,54 The most important risk factors for free-wall rupture are large infarct size53 and delayed hospital admission with symptoms lasting for >24 hours,55 which are consequences of inadequate reperfusion. The risk of rupture is further increased by first MIs associated with poor collateral blood flow,55 undue in-hospital physical activity,55 age >70 years, and female sex.56,57 In the National Registry of Myocardial Infarction database, thrombolytic therapy accelerates the time course of cardiac rupture (often to within 24 hours) and increases the risk of rupture-related death (from 7.3% without thrombolytic treatment to 12.1% with such treatment).52 The risk of myocardial rupture was significantly decreased by successful reperfusion with thrombolytic agents in acute MI patients <75 years of age58–62 or by angioplasty in all age groups studied.63,64 In a retrospective review of 2209 acute MI patients treated with percutaneous coronary intervention,64 the risk of cardiac rupture was 0.7% when successful CAR035.indd 815CAR035.indd 815 11/29/2006 3:33:07 PM11/29/2006 3:33:07 PM
  • 6. 816 c h a p t e r 35 reperfusion was achieved within 12 hours, 0.9% when reper- fusion occurred within 12 to 24 hours, and 3.8% after failed reperfusion. Infarcts of the lateral and anterior LV walls, subtended by the LCx or LAD coronary artery, are the most common infarcts associated with free-wall rupture.55 Myocardial rupture rarely involves the RV or the atria.65,66 The rupture site is typically located between infarcted and contractile myocardium. Myocardial rupture originates as an abrupt slit-like tear, usually in the anterior myocardium. It occurs early and sud- denly, within 3 days following an acute MI in 50% of patients. In these cases, sudden chest discomfort, with rapidly progres- sive cardiogenic shock related to hemopericardium and tam- ponade, are followed by electromechanical dissociation67 and death. Rapid 2D echocardiography identifies a pericardial effusion and confirms the diagnosis.68 Contained Free-Wall Rupture: Ventricular Pseudoaneurysm Late rupture, more than 5 days after an acute MI, with infarct expansion, occurs mainly in patients who have had unsuccessful reperfusion. Late rupture with intramural dis- section is more gradual or incomplete and produces the char- acteristic echocardiographic finding of a pseudoaneurysm, or false aneurysm. An LV pseudoaneurysm results from a local- ized rupture of the ventricular free wall, which produces a localized hemopericardium that is limited by parietal peri- cardium and by blood clot formation. There is an absence of heart muscle in the wall of a false aneurysm. Although ven- tricular pseudoaneurysms are usually the consequence of an acute MI (inferior infarctions being twice as common as anterior ones), they may also result from cardiac surgery (most commonly mitral valve replacement), trauma, or lac- eration.69 A pericardial effusion with organizing thrombus may help the pericardium seal the ventricular perforation temporarily, but progression to frank rupture and cardiac tamponade may occur without warning.70 Echocardiographic recognition of a pseudoaneurysm associated with a subacute or late LV rupture is difficult. In a large series of pseudoaneurysms,69 abnormalities were present on the 2D or Doppler echocardiograms of approxi- mately 85% to 90% of patients, but a definitive diagnosis was made in only about 25%. In suspected cases, coronary angi- ography provides a definitive diagnosis in 87% of patients.69 Transesophageal echocardiography may improve the diag- nostic accuracy but has not been studied in this regard. Two- dimensional echocardiography can detect discontinuity of the ventricular free wall and confirm the presence or absence of pericardial tamponade.71 In most cases, a narrow neck abruptly connects the LV cavity to the large aneurysmal sac, which is located outside the LV cavity, is usually pulsatile, and may contain thrombus. Color-flow Doppler imaging shows characteristic bidirectional flow in both systole and diastole, resulting from a communication between the false aneurysm and the ventricular cavity. Ventricular Septal Defect Rupture of the interventricular septum is reported to com- plicate 1% to 3% of acute ST-elevation MIs.72 Ventricular septal defects (VSDs) accounted for 10% of total cardiac deaths73 before the reperfusion era but only 0.2% of those observed in the Global Utilization of Streptokinase and Tissue Plasminogen Activator for Occluded Coronary Arter- ies trial (GUSTO-I).74 Usually occurring within the first week, VSDs are more common after large infarctions of the anterior wall,75 after poorly reperfused infarcts, in the elderly, and in women.72 Although thrombolytic therapy prevents septal rupture in many patients who undergo successful coronary reperfusion, thrombolytic treatment likely acceler- ates rupture when reperfusion fails. The median time from the onset of symptoms to the development of an interven- tricular septal rupture was 1 day in the GUSTO-I trial.74 Septal rupture leads to a sudden left-to-right shunt, whose magnitude is proportional to the size of the septal defect and to the ratio of the systemic and peripheral vascular resis- tance. In this clinical setting, Doppler echocardiography is usually diagnostic, its sensitivity and specificity reportedly being as high as 100%.76 Rarely, when the transthoracic image quality is challenged by mechanical ventilation or obesity, transesophageal echocardiography is required for diagnosis. In up to 40% of patients, 2D echocardiography alone may show a dropout of echoes in the interventricular septum, in the region of abnormal wall motion (Fig. 35.6A).65 Color-flow Doppler imaging77 has been shown to enhance the diagnostic accuracy up to 100% by defining the site of septal rupture as an area of turbulent transseptal flow or by detect- ing a high-velocity jet on the right side of the ventricular septum (Fig. 35.6B). Color Doppler examination may show a single rupture site (typically seen with anteroapical defects) or multiple rupture sites (characteristically seen with inferior and inferobasal defects).78,79 Pulsed-wave Doppler imaging, undertaken on the right side of the interventricular septum (at the site of the defect), usually characterizes a high-velocity jet directed from the left ventricle to the right ventricle (Fig. 35.6C). Right ventricular systolic pressure can be estimated by subtracting the peak gradient obtained across the interventricular septum from the systolic (systemic) blood pressure, provided that no aortic stenosis is present. A semiquantitative estimate of the size of the left-to-right shunt can be obtained by measuring the volumetric flow across the pulmonary valve and the LV outflow tract, pro- vided that no valvular regurgitation is present. Contrast 2D echocardiography can also identify a VSD. Thus, 2D echo- cardiography and color-flow Doppler imaging can rapidly and reliably provide an anatomic diagnosis and estimation of the hemodynamic status at the bedside. Because the prognosis depends on early surgical intervention, echocardiography has become invaluable for the rapid evaluation of this complication. Right Ventricular Infarction Right ventricular infarction, usually caused by proximal occlusion of the RCA, may complicate up to 40% of inferior MIs. The echocardiographic manifestations of RV infarction include RV dilatation, hypokinesis of the RV free wall,80–83 and manifestations of right atrial hypertension48 (dilated right atrium, plethoric systemic veins) (Fig. 35.7A,B). These findings are not specific for RV infarction, and they com- monly occur with acute and chronic pulmonary hyperten- CAR035.indd 816CAR035.indd 816 11/29/2006 3:33:07 PM11/29/2006 3:33:07 PM
  • 7. ec hoc a r diog r a p h ic eva luat ion of corona ry a rt e ry dise a se 817 A B C FIGURE 35.6. Ventricular septal defect (VSD). (A) Apical VSD (arrow) is identified by the dropout of interventricular septum visu- alized by two-dimensional echocardiography. Color Doppler dem- onstrates an area of turbulence at the site of the VSD rupture in the apical septum. (B) Color Doppler demonstrates a high-velocity jet of mosaic color directed into the apex of the right ventricle with migra- tion of blue color toward the base of the right ventricle (RV) (opposite direction of RV inflow). (C) Spectral Doppler identifies the direction of the shunt and the magnitude of the pressure gradient from the left to the right ventricle. The RV systolic pressure can and should be estimated as the systolic blood pressure (SBP)-4 (peak VSD jet).2 RA, right atrium; LA, left atrium; PK, peak gradient; LV, left ven- tricle; RV, right ventricle. sion (pulmonary embolism). An RV infarction almost always accompanies an infarction of the inferior LV wall (Fig. 35.7C). Thus, RV dysfunction with akinesis of the inferior LV wall is characteristic of an RV infarction, having a sensitivity of more than 80% to 85%.84 Prompt diagnosis of RV infarctions will differentiate these lesions from other reversible causes of cardiogenic shock such as cardiac tamponade. Mural Thrombus Mural thrombus is a common complication of an acute MI and had an incidence of up to 40% in patients with anterior and apical infarctions in the prethrombolytic era. After thrombolytic therapy for an acute MI, the Gruppo Italiano per lo Studio della Sopravvivenza nell’Infarto Miocardio III (GISSI-3) study85 reported visualization of LV thrombus on the predischarge echocardiogram of 5.1% of patients (9 ± 5 days after symptom onset). Patients with an anterior MI had a fivefold higher prevalence of thrombus formation than did patients with other infarct locations (11.5% vs. 2.3%, respec- tively). Worsening LV function and more extensive regional dysfunction are also recognized risk factors for LV throm- bus.85 Most thrombi occur within the first 2 weeks (median, 5 to 6 days) after an acute MI.86,87 However, with worsening LV function, new LV thrombus is identified in some patients after hospital discharge.87,88 CAR035.indd 817CAR035.indd 817 11/29/2006 3:33:07 PM11/29/2006 3:33:07 PM
  • 8. 818 c h a p t e r 35 A B C FIGURE 35.7. Right ventricular infarction. The manifestations of right ventricular (RV) infarction can be identified by echocardiogra- phy and include RV dilatation (*), hypokinesis of the RV free wall (arrows), and evidence of elevated right atrial pressure; dilated right atrium (RA*) (A), or plethoric inferior vena cava (IVC*, arrow) (B). Left ventricular inferior wall motion abnormality (arrows) should also be present (C). Thrombus, observed at the site of abnormal wall motion or within an aneurysm, appears as a mobile or an immobile opaque intracavity mass (Fig. 35.8), which may be lami- nar or pedunculated or may protrude into the ventricular cavity.85,89–91 Thrombi are usually located at the apex and, less frequently, along the septum and the inferior regions of the heart.92 In detecting LV thrombus, 2D transthoracic echocar- diography has a sensitivity of 75% to 95% and a specificity of 87 to 90%,90,91,93 and therefore is the method of choice. When the apex is poorly visualized with transthoracic echo- cardiography, administration of a contrast agent may help identify suspected apical thrombus by demonstrating an absence of contrast in an LV cavity filled with contrast. In transesophageal echocardiography, the posterior position of the ultrasound probe limits visualization of the apex and thus detection of apical thrombus. The 2003 ACC/AHA/ASE task force gave a class I recommendation to the use of echocardiography for assessing mural thrombus after an acute MI.33,34 FIGURE 35.8. Left ventricular mural thrombus. Two-dimensional imaging in the apical four-chamber view demonstrates an echolu- cency in the LV apex of a patient with a large apical infarct (arrow). RV, right ventricle; RA, right atrium; LV, left ventricle; LA, left atrium. CAR035.indd 818CAR035.indd 818 11/29/2006 3:33:08 PM11/29/2006 3:33:08 PM
  • 9. ec hoc a r diog r a p h ic eva luat ion of corona ry a rt e ry dise a se 819 Embolization has been reported to occur in 26 of 119 patients with documented LV thrombi after an MI.91 Thrombi that are protruding, pedunculated, or mobile within the ven- tricular cavity are most likely to embolize, usually within 3 months after an acute MI.91,93–95 Papillary Muscle Rupture Producing Acute Mitral Regurgitation Severe MR resulting from papillary muscle rupture is a rare and often fatal complication of an acute MI.96 In the absence of prompt surgical intervention, the mortality of this com- plication is as high as 50% at 24 hours,97,98 which is nearly double the mortality seen in patients with a postinfarction VSD.99 The median duration of survival is reportedly 3 days.100 The anterolateral papillary muscle is rarely affected, because it has a dual blood supply from the LAD and circum- flex arteries.101 Infarction of the posterior descending artery is associated with necrosis of the posteromedial papillary muscle, which produces sudden clinical and hemodynamic deterioration and fulminant acute left-sided heart failure. It is important to recognize that severe MR with complete rupture of the papillary muscle may occur in the absence of a cardiac murmur or in the presence of a very soft murmur; therefore, this diagnosis must be considered with a high index of suspicion in the appropriate clinical setting. It is crucial that a definitive diagnosis be reached rapidly in these patients. Two-dimensional echocardiography shows flail mitral leaflet with attachment of the mobile severed papil- lary muscle head, which prolapses into the left atrium in systole, and abnormal cutoff of one papillary muscle (Fig. 35.9A).102,103 In up to 35% of surgically confirmed cases, the partially ruptured papillary muscle cannot be observed to prolapse into the left atrium on transthoracic echocardiog- raphy imaging.104 Transesophageal echocardiography has become an invaluable technique for diagnosing acute MR that complicates an MI, especially in hemodynamically compromised patients in the intensive care unit, in whom transthoracic echocardiography imaging may be limited. Transesophageal echocardiographic imaging in the gastric long-axis and mid-esophageal four-chamber views can detect the origin of the regurgitant jet and clarify the anatomic profile of the mitral and submitral valvular apparatus (Fig. 35.9B).89 Chronic Complications After a Myocardial Infarction Ischemic Mitral Regurgitation Mitral regurgitation caused by changes in ventricular struc- ture and function as a consequence of coronary ischemia is best described as ischemic MR.105 Usually a consequence of a previous infarction and chronic LV remodeling, ischemic MR may also be precipitated by active ischemia, creating flash pulmonary edema or, rarely, rupture of the papillary muscle (see above). Incidence Ischemic MR occurs in 20% to 25% of patients followed after an MI106–109 and in 50% of those with congestive heart failure.110 Moderate or severe MR is found in roughly 40% of patients within 24 hours of an acute MI complicated by car- diogenic shock.111 However, angiographic detection of moder- ate-to-severe MR after an MI has been reported in only 3% to 4% of patients.112,113 When evaluated by echocardiography within 30 days after an MI, moderate or severe MR was present in 12%.114 Mild MR has been reported in 50% to 64% of post-MI patients undergoing echocardiography within 30 days of the MI.106–111,113–115 Mechanism Mitral regurgitation after an acute MI is due primarily to segmental and global LV dysfunction, which causes chronic papillary muscle displacement, apical tethering of the mitral leaflets, annular dilatation, and decreased systolic mitral closing forces (Fig. 35.10).105 Elegant models of MR have shown that ischemia of the papillary muscle in the absence A B FIGURE 35.9. Papillary muscle rupture. (A) Transesophageal imaging in the mid-esophageal four-chamber view demonstrates the prolapse of the severed head of the papillary muscle (arrow) into the left atrium (LA) during ventricular systole. The mitral subvalvular apparatus with rupture of the papillary muscle head (arrow) is shown by two-dimensional imaging in the deep gastric long-axis view (B). LV, left ventricle; MV, mitral valve. CAR035.indd 819CAR035.indd 819 11/29/2006 3:33:09 PM11/29/2006 3:33:09 PM
  • 10. 820 c h a p t e r 35 of infarction does not cause MR.105,116–118 Ischemic MR depends on a balance of forces and LV geometry and varies with loading conditions (Fig. 35.11).119 Characteristically dynamic in nature, MR may be elusive on transesophageal echocardiography in cardiac surgical patients under anesthe- sia.120–122 MR is also likely underestimated by resting echo- cardiography in patients with LV dysfunction and symptoms of congestive heart failure in the absence of active isch- emia.123–125 With semisupine bicycle exercise, Pierard and Lancellotti125 demonstrated a twofold increase in MR volume (from mild to moderate-to-severe) and a corresponding increase in orifice area (by >20mm2 ) in nearly 30% of patients. Exercise-increased MR also correlated with increased pulmonary artery pressure and conferred an adverse prognosis.125 Ventricular Aneurysm After an acute, usually anterior, MI,95,126 a true LV aneurysm develops in up to 20% of patients, owing to gradual expan- sion and thinning of all three layers of the infarcted myocar- dium.127 The incidence of true LV aneurysm has decreased as reperfusion therapies have improved and become wide- spread.128 The usual time of aneurysm formation is within 3 months after the onset of an MI. True LV aneurysms almost always involve the LV apex and extend into the anterior or anterolateral walls (Fig. 35.12A). Rarely, true aneurysms are found in the basal inferior or high lateral wall (Fig. 35.12B). Aneurysms are usually the consequence of left anterior artery occlusion and are rarely present with multivessel CAD and extensive collateralization. Ischemic mitral regurgitation: incomplete mitral leaflet closure Normal LV closing force Tethering force AO MR LA Ischemic Papillary muscle displacement Mitral valve tethering Restricted closure FIGURE 35.10. Mechanism of ischemic mitral regurgitation. Left: The balance of forces acting on the mitral leaflets in systole. LA, left atrium, LV, left ventricle, AO, aorta. Right: Effect of papillary muscle displacement and mitral leaflet tethering to restrict mitral leaflet closure. MR, mitral regurgitation. FIGURE 35.11. Illustration of ischemic mitral regurgitation. Two- dimensional imaging in the parasternal long axis view demonstrates apical tethering of the chordae tendineae (left, arrow) and the resul- tant jet of mitral regurgitation (right) caused by the incomplete mitral leaflet closure. A B FIGURE 35.12. Left ventricular aneurysm (LVA). (A) Two-dimen- sional imaging in the four-chamber apical view demonstrates a thin distal septum and apical LV segment with a hinge point (arrow) demarcating the transition from contractile tissue to the aneurys- mal segment. (B) Two-dimensional imaging of the two-chamber view identifies an aneurysm of the inferior base (arrows) and an apical thrombus (arrow), which is present in up to one third of patients with acute myocardial infarction. CAR035.indd 820CAR035.indd 820 11/29/2006 3:33:09 PM11/29/2006 3:33:09 PM
  • 11. ec hoc a r diog r a p h ic eva luat ion of corona ry a rt e ry dise a se 821 Two-dimensional echocardiography has a sensitivity of >93%129 and a specificity of 94% in the detection of LV aneu- rysm. The characteristic echocardiographic finding is a thin LV wall that fails to thicken during systolic contrac- tion, producing a “bulge” during systole and diastole.127,130 A common finding is a hinge point (Fig. 35.12A), or junction, between contractile LV tissue and the akinetic, often para- doxic, motion of the aneurysm. True LV aneurysms distort LV geometry during both systole and diastole.129 Doppler echocardiography can be used to detect a low-velocity flow profile with a “swirling” motion characteristic of low cardiac flow within the aneurysm. Thrombus within the aneurys- mal segment is detected echocardiographically in at least a third of patients with LV aneurysms (Fig. 35.12B),131,132 and such thrombus may account for the increased risk of stroke in the 5 years after an acute MI.133 Deposition of fibrous tissue and calcium in the aneurysmal segment over time prevents rupture of a chronic LVA, unlike a pseudoaneu- rysm.134,135 Left ventricular aneurysms contribute to chronic cardiac decompensation with congestive heart failure, ven- tricular arrhythmias, and systemic emboli. Compared to medical therapy alone, surgical repair of LV aneurysms in selected patients improves survival, functional class, and symptoms.136 Two-dimensional echocardiography has been used to evaluate the efficacy of aneurysmectomy in patients with ventricular aneurysms. Ryan and colleagues126 found that a fractional shortening of >17% in the uninvolved myocardium (measured at the base of the heart) was associ- ated with an improved surgical outcome, whereas a frac- tional shortening of ≥17% entailed no subsequent clinical or surgical improvement. Left Ventricular Remodeling After an MI, the left ventricle accommodates to the loss of regional myocardial function by increasing the contractile state of the remaining viable segments. Left ventricular remodeling is clinically characterized as a change in cardiac size, shape, and function as a result of myocardial injury or an increased load.137,138 The severity of the regional dysfunc- tion (infarct size),139,140 function of the remaining segments, neurohormonal activation, and presence of coexisting valvu- lar heart disease, particularly MR, will determine the mag- nitude of LV remodeling.105 This process usually begins within the first few hours after the infarct and progresses over time.141–143 Disproportionate thinning and dilatation of the infarcted segment after an MI is defined as infarct expan- sion and is accompanied by gross distortion of the LV shape and volume144,145 and loss of functional myocardium that initially contracted normally.146 With remodeling, the left ventricle dilates, becomes more spherical, and declines in function.147 Alterations in LV geometry lead to ischemic MR, which further increases LV volumes and diastolic wall stress, activates the neurohumoral cascade, and further decreases LV contractility, thus leading to a cycle of LV remodeling and MR.105 The important relationship between LV function and MR is reflected in the poor survival of post-MI patients in whom both significant MR and severe LV dysfunction coexist (Fig. 35.13).111 Echocardiographic assessment of LV remodeling after an acute MI includes 2D measurements of the LVEF, size, shape, and volume at end-diastole and end-systole and should also include Doppler estimation and quantification of MR severity. Prognosis in Acute Myocardial Infarction and Chronic Coronary Artery Disease In patients with CAD, the prognosis is related to the extent of myocardial damage, the magnitude of the resultant LV remodeling, the LV filling pressures, and the degree of resid- ual coronary ischemia and viability. As a cardiac imaging modality, echocardiography is uniquely suited for the routine examination of each of these important predictors of outcome. Two-dimensional echocardiography can be used to identify patients with acute MIs who are at high risk for short-term complications in the hospital and for long-term complications after hospital discharge.148–151 Horowitz and Morganroth149 found that echocardiography had a sensitivity of 83% and a specificity of 85% in identifying patients at high risk for in-hospital complications. Ventricular Systolic Function Left Ventricular Systolic Function The extent of myocardial damage can be measured globally as the ejection fraction or regionally as a wall-motion score index. Both parameters have been shown to correlate with the outcome in patients with an acute MI or chronic CAD (Fig. 35.14).28,30,152,153 Nishimura and colleagues150 found that post MI patients with a higher wall-motion score index at discharge are more likely to have cardiovascular complica- tions at follow-up examination. The LVEF and severity of MR were the only independent echocardiographic predictors of both early and late survival for patients presenting with car- diogenic shock. Survival at 1 year was 24% in those with an 1.0 0.9 0.8 0.7 0.6 0.5 0.4 0.3 0.2 0.1 0.0 0 2 4 6 Time from randomization (months) Proportionalive 2/3/4 MR, LVEF <28% 2/3/4 MR, LVEF ≥28% 0/1 MR, LVEF ≥28% 0/1 MR, LVEF <28% 8 10 12 FIGURE 35.13. Survival following myocardial infarction is depen- dent on both left ventricular ejection fraction (LVEF) and the sever- ity of mitral regurgitation (MR). Kaplan-Meier estimates of survival up to 1 year after randomization for four combinations of LVEF and MR in the SHOCK trial. Total n = 90; MR 0/1 and LVEF >28%, n = 33; MR 0/1 and LVEF <28%, n = 20; MR 2/3/4 and LVEF >28%, n = 16; MR 2/3/4 and LVEF <28%, n = 21. CAR035.indd 821CAR035.indd 821 11/29/2006 3:33:10 PM11/29/2006 3:33:10 PM
  • 12. 822 c h a p t e r 35 LVEF of <28% versus 56% for those with a higher LVEF.111 In the setting of acute coronary syndrome, LV systolic dysfunc- tion increases the long-term mortality and increases the probability of having multivessel CAD by 50%.154 Right Ventricular Systolic Function In 416 patients with LV dysfunction (LVEF <40%) after an MI, persistent RV dysfunction has been shown to decrease overall survival. The RV systolic function correlated weakly with the LV systolic function. However, RV function, measured as a fractional area change, was an independent predictor of mortality, cardiovascular mortality, and congestive heart failure. Each 5% decrease in RV fractional area change increased the odds of cardiovascular mortality by 16% (Fig. 35.15).155 Left Ventricular Remodeling Left ventricular remodeling can be characterized and quanti- fied by 2D echocardiographic measurements of LV size and volume. The prognosis in patients with CAD is also related to the extent of LV remodeling. After an acute MI, small increases in LV volume (particularly LV end-systolic volume)156,157 or decreases in the LVEF158 increase the risk of death and congestive heart failure.156,159 In-hospital evaluation of the postinfarct LVEF and the extent of RWMA, but not LV dilatation, predicted progressive LV remodeling.143,146 In the Beta-Blocker Evaluation of Sur- vival Trial (BEST), however, Grayburn and colleagues160 found that LV volume and MR were the best predictors of outcome in patients with LV dysfunction. Mitral Regurgitation The presence and severity of ischemic MR has been shown to worsen survival in patients with acute MI and chronic CAD with or without LV dysfunction.107,109,111–114,161–163 Mitral regurgitation that follows an acute MI is an important inde- pendent predictor of early and late death.109,113 In the SAVE trial,24 any degree of MR detected within days after an MI was associated with a poorer outcome, which was inde- pendent of treatment with angiotensin-converting-enzyme inhibitors (Fig. 35.16A). Survival correlated with the severity 0 2 4 6 8 10 15 N = 630 162 355 604 835 611 No study within 14 days <30% 30–39% 40–49% Total = 3197 50–59% ≥60% 30 Resting ejection fraction (%) Mortality(%) 45 60 75 FIGURE 35.14. Left ventricular systolic function predicts mortality after myocardial infarction. Relation of rest ejection fraction to all- cause mortality in 3197 patients enrolled in the TIMI II study. Kaplan-Meier analysis of mortality rate related to time from study entry, with patients categorized according to ejection fraction. Mor- tality rate is highest in patients with ejection fraction <30% (9.9%). FIGURE 35.16. (A) Mitral regurgitation (MR) worsens survival after myocardial infarction. Kaplan-Meier curves of cardiovascular sur- vival in patients with and without MR following acute myocardial infarction in the Survival and Ventricular Enlargement (SAVE) Study. MR, mitral regurgitation. (B) Decreased survival after MI with increasing severity of MR. Degree of MR quantified by effec- tive regurgitant orifice area (EROA); mild if EROA <20mm2 and moderate or greater when EROA ≥20mm2 . Numbers at bottom indi- cate patients at risk each interval. RV Dysfunction n = 79 15001000 Days 5000 0 25 50 Survival(%) 75 100 HR = 3.2 (2.0–5.1) p <.0001 No RV Dysfunction n = 337 FIGURE 35.15. Right ventricular dysfunction following myocar- dial infarction decreases survival. Cumulative percent survival of patients with and those without right ventricular (RV) dysfunction measured as fractional area change (FAC). RV dysfunction = FAC <32.2%; normal RV function = FAC >32.3%; HR, hazard ratio. CAR035.indd 822CAR035.indd 822 11/29/2006 3:33:10 PM11/29/2006 3:33:10 PM
  • 13. ec hoc a r diog r a p h ic eva luat ion of corona ry a rt e ry dise a se 823 of MR quantified as effective regurgitant orifice area (EROA) and regurgitant volume in the elegant studies by Grigioni and coworkers115,164 (Fig. 35.16B). In the echocardiographic substudy of the SHOCK trial (SHould we emergently revascularize Occluded Coronaries in cardiogenic shocK?),111 the only independent multivariate predictors of either 30-day or 1-year mortality in patients with cardiogenic shock after an acute MI were moderate or greater MR severity and an LVEF of <28% (Fig. 35.13). For patients with moderate or severe MR, the 1-year survival rate was 31% compared to 58% for those with mild or no MR. This outcome is comparable to the mortality of 52% at 1 year and 24% at 30 days in 50 patients with moderately severe to severe (3+ to 4+) MR on routine angiography during an acute MI (total, 1485 patients).113 In these studies, MR severity was associated with increasing LV volumes, which underlie and contribute to the mechanism of MR after an acute MI. Elevated Left Ventricular Filling Pressures Elevated LV filling pressures in patients with acute MI and chronic CAD are the consequence of LV dysfunction, MR, and ventricular loading conditions. As such, they have been shown to predict the short- and long-term outcome of patients with CAD. Elevated filling pressures may be characterized echocardiographically as a shortened deceleration time (DT) of mitral early inflow velocity (DT <150ms), an increased ratio of early (E) to late (A) LV diastolic filling velocities (mitral inflow E/A >2), and pulmonary venous diastolic flow predominance. Additionally, the LA volume, when indexed to body surface area (>28mL/m2 ), reflects the severity and duration of elevated LV filling pressures and is a powerful predictor of survival after an acute MI.165 Measurements uti- lizing TDI have provided incremental prognostic informa- tion in patients with CAD or congestive heart failure.166–168 After an acute MI, the ratio of the early diastolic mitral filling velocity to the early diastolic tissue velocity of the mitral annulus (E/e’ > 15) (Fig. 35.17A)167 as well as the maximal peak tissue systolic velocity (Sm) (Fig. 35.17C)166 and peak early diastolic tissue velocity (Em) (Fig. 35.17B)166 when added to other echocardiographic variables, further predicts survival. Stress Echocardiography: Assessment of Ischemic and Viable Myocardium Stress echocardiography is routinely used to document the presence of CAD, to identify the location and extent of myo- cardial ischemia, to risk-stratify patients with known CAD, and to assess myocardial viability in regions of myocardial dysfunction. Basic Principles and Definitions Ischemia is characterized by hypoperfusion of myocardial cells and can occur at rest or after stress. Viable myocardial cells are living cells. Viable myocardium is easily identified when it contracts normally. The discrimination of dysfunc- tional, but living, myocardium from necrotic tissue is the more common and clinically relevant description of viabil- ity. Ischemia produces regional myocardial dysfunction within seconds. Experimental studies have shown that the duration and severity of an ischemic insult is the major determinant of both functional and metabolic myocardial 0 0.5 0.6 0.7 Survival 0.8 0.9 1.0 A B C 250 195 113 Duration of follow-up (months) 49 16Number at risk 1.0 0.9 0.8 Cumsurvival Cumsurvival 0.7 1.0 0.9 0.8 0.7 0 10 20 30 40 Em ≤3 cm/s 3< Em ≤5 cm/s Em >5 cm/s Sm ≤3 cm/s 3< Sm ≤5 cm/s Sm >5 cm/s Follow time (months) 0 10 20 30 40 Follow time (months) 6 12 18 24 E/e’ > 15 E/e’ ≤15 FIGURE 35.17. Elevated left ventricular filling pressures predict survival after myocardial infarction. (A) Ratio of early mitral diastolic velocity to diastolic annular tissue velocity (E/e’) predicts survival. Kaplan-Meier plot demon- strates improved survival for patients with E/e’ ratio of <15. (B,C) Peak LV annular velocities in both systole and diastole predict survival after MI. Cumulative cardiac death by tertiles of the early mitral annulus diastolic veloc- ity (B) and mitral annulus systolic velocity (C). CAR035.indd 823CAR035.indd 823 11/29/2006 3:33:11 PM11/29/2006 3:33:11 PM
  • 14. 824 c h a p t e r 35 recovery.169 Severe regional LV dysfunction, leading to depres- sion of LV systolic function in patients with CAD, can result from myocardial necrosis, postischemic stunning, or myo- cardial hibernation. “Stunning” refers to contractile dys- function in viable myocardium as a result of transient ischemia followed by reperfusion.12 “Hibernating” myocar- dium refers to myocardial tissue that is persistently hypo- contractile secondary to chronic or repetitive low coronary perfusion.170 Hibernating myocardium has been described as an adaptation to severe and chronic ischemia that increases the risk of sudden death even in the absence of infarction.171 Recovery of hibernating myocardium is characteristically late (two of three segments recovering in >3 months) after reperfusion. Interpretation A new RWMA provoked by stress indicates cardiac ischemia. Improved contractility of myocardial segments with abnor- mal baseline function on inotropic stimulation is character- isticofviablebutdysfunctionalmyocardium.Adysfunctional segment may show one of four responses: (1) an improvement in contractility (contractile reserve) that further improves with maximum stimulation; (2) no improvement (nonviable); (3) worsening function (ischemic); or (4) improvement with low-dose inotropic stimulation that becomes dysfunctional at higher doses of inotropic stimulation.8 This biphasic response is characteristic of viable segments that become ischemic at higher levels of stress. Table 35.2 summarizes the myocardial segment responses to stress. Methodology Analysis of stress echocardiograms is predominantly based on qualitative comparison of regional wall motion at base- line and during stress. Semiquantitative assessment of RWMAs by determining the wall-motion score index (described above) is recommended. Newer techniques for quantitation of regional LV systolic function include TDI and its derivative, strain-rate imaging. Because regional myo- cardial dysfunction occurs within seconds of acute transient ischemia, and because recovery usually occurs within 2 to 3 minutes, imaging can be done after stress if performed rapidly. Stress echocardiography can be performed using either exercise or pharmacologic stress, depending on patient ability, laboratory preference, and the reason for clinical study (Table 35.3). The accuracy of stress echocardiography is dependent on visualization of all myocardial segments and evaluation of myocardial thickening and regional wall motion. Myocardial contrast agents, which opacify the LV cavity and better define endocardial borders, enhance the detection of RWMAs. Tissue harmonic imaging and digital image acquisition, which allow comparison of side-by-side optimized images of representative cardiac cycles with reduced respiratory interference (particularly at peak stress), have further improved the discrimination of subtle wall- motion abnormalities at various stress stages. Because accu- racy of image interpretation remains subjective, physician experience is a major determinant of the accuracy of stress echocardiography.172 Treadmill Stress Echocardiography Exercise protocols generally consist of either treadmill exer- cise or upright or supine bicycle exercise. Baseline images are acquired before and after exercise in four standard views: parasternal long-axis (or apical three-chamber), parasternal short-axis at the level of the papillary muscles, apical four- chamber, and apical two-chamber. Exercise is performed according to a standard exercise protocol, and the heart rate, blood pressure, and electrocardiogram are monitored through- out the test at each stage of exercise (Table 35.4). Only postex- ercise imaging is available with treadmill exercise. Therefore, rapid acquisition (within 60 to 90 seconds) of postexercise TABLE 35.2. Myocardial segment response to stress Resting Stress Likelihood of segment function Exercise Low dose Peak dose Interpretation functional recovering Normal ↑ ↑ ↑↑ Normal n/a Normal ↓ ↑ ↓ Ischemic n/a Abnormal* ↑ ↓ Ischemic and viable High “Biphasic” Abnormal ↓ ↓ ↓ Ischemic, viable Moderate Abnormal ↑ ↑ ↑↑ Nonischemic, viable Low Abnormal No change No change No change Nonviable, scar Low *Viability assessment requires graded stress with image acquisition at multiple stages. Treadmill echo is not recommended for the assessment of viability. TABLE 35.3. Selection of stress echocardiography protocols for clinical decision making Stress echo protocol Clinical indication TME Bike Dobutamine Chest pain + + ± Post-MI + + + Viability − ± ++ Dyspnea + + ± MR + ++ Valve disease MS ++ + AS ++ + AI ++ Pulmonary artery pressure − ++ − Preop risk assessment ± ± + AI, aortic insufficiency; AS, aortic stenosis; MI, myocardial infarction; MR, mitral regurgitation; MS, mitral stenosis; TME, treadmill stress echocardiography. CAR035.indd 824CAR035.indd 824 11/29/2006 3:33:11 PM11/29/2006 3:33:11 PM
  • 15. ec hoc a r diog r a p h ic eva luat ion of corona ry a rt e ry dise a se 825 images is imperative to prevent resolution of an inducible RWMA and, thus, a false-negative result. The advantages of treadmill stress testing include the widespread availability of treadmill equipment and the independent prognostic in- formation obtained from exercise treadmill testing. Bicycle Stress Echocardiography Stationary bicycle exercise, either upright or supine, can also be used for exercise stress echocardiography. As in treadmill testing, baseline images are acquired before exercise. Patients then pedal against progressively increasing resistance; the blood pressure, heart rate, and electrocardiogram are moni- tored throughout the test at each stage of exercise. One advantage of supine bicycle testing is that images can be acquired during exercise. The disadvantage is that many patients find bicycling in the supine position awkward and cumbersome, so they may be unable to achieve optimal stress levels (Table 35.4). However, the onset of ischemia appears to occur sooner in the supine position, perhaps because of the increased venous return, preload, or blood pressure associated with supine bicycling.173 Pharmacologic Stress Echocardiography When a patient is unable to exercise, stress is induced with pharmacologic agents such as dobutamine, adenosine, or dipyridamole. Dobutamine, the most commonly used agent, stimulates β1-, β2-, and α-adrenergic receptors, resulting in both inotropic and chronotropic stimulation. Because of dose-dependent differences in affinity for the different recep- tors, low doses produce a predominantly inotropic response, and increasing doses augment the chronotropic response. Images are acquired at baseline and after administration of graded doses of dobutamine, beginning with 5 to 10μg/kg/ min and increasing the dose every 3 to 5 minutes until reach- ing a maximum dose of 40μg/kg/min, at which 85% of the maximum age-adjusted (220 − age) heart rate is obtained. Atropine (0.5 to 2.0mg) is frequently (in up to 25% of patients)174 used in conjunction with dobutamine to augment the heart rate response, especially in beta-blocker recipients, in whom the heart rate response may be blunted. Figure 35.18 summarizes the DSE protocol. Neither the electrocardiogram nor the hemodynamic response to phar- macologic stress testing is diagnostic or prognostic. Hypo- tension during DSE may be related to (1) decreased systemic vascular resistance associated with a β2-agonist response; (2) LV outflow tract (LVOT) obstruction produced by systolic anterior motion of the mitral valve associated with increas- ing LVOT velocity and reduction in LV systolic cavity size; (3) hypovolemia; or (4) severe (usually multivessel) ischemia. Contraindications to DSE include severe arrhythmia, marked systemic hypertension, severe aortic stenosis, resting LVOT obstruction, aortic aneurysms, and unstable coronary syn- dromes (Table 35.5). Testing is terminated when the patient has completed the protocol and achieved >85% of the maximal predicted heart rate (MPHR) or if a new RWMA TABLE 35.4. Exercise echocardiography protocols Immediate (<1min) Baseline images postexercise Protocols ± Doppler Exercise imaging imaging Advantages Limitations Treadmill ✓ ✗ ✓ High workload Imaging only postexercise Widely available Exercise itself is prognostic: Duration ECG Symptoms Bike ✓ ✓ ✓ Images during exercise Lower workload Difficult for patient Dobutaminedose(μg/kg/min) 5 0 3 6 9 12 10 20 30 40*** Time in minutes 2D imaging 2 minutes after dose adjustment * ** Atropine 0.5–1 mg as needed to achieve 85% MPHR at peak dobutamine dose Hand grip exercise may also be utilized to increase heart rate at peak dose FIGURE 35.18. Dobutamine stress echocardiography (DSE) protocol. TABLE 35.5. Dobutamine stress echocardiography Indications Contraindications Patient unable to exercise Unstable coronary syndrome Graded stress imaging Severe arrhythmia Identification of viability Severe hypertension Severe aortic stenosis Aortic aneurysm or dissection Resting left ventricular outflow tract (LVOT) obstruction CAR035.indd 825CAR035.indd 825 11/29/2006 3:33:11 PM11/29/2006 3:33:11 PM
  • 16. 826 c h a p t e r 35 develops in two or more segments. Development of a signifi- cant arrhythmia, LVOT obstruction of >4m/s, or significant hypotension or hypertension should lead to cessation of the dobutamine infusion and termination of the test (Table 35.6). In a review of 1118 patients,175 the primary reason for terminating DSE was achievement of the target heart rate (52%), completion of the protocol with the maximum dobu- tamine dose (23%), or development of angina (13%). In only 3% to 7% of patients was the test terminated for a noncardiac side effect (nausea, anxiety, headache, tremor, urgency). Overall, the frequency of such side effects was 26%. The most frequent side effects were arrhythmias, hypotension, nausea, and dyspnea, but these led to test termination in only 3% of cases.175 The incidence of supraventricular arrhythmia during DSE has reportedly been as low as 0.5%176 and as high as 7%.177 Sustained ventricular tachycardia occurs in up to 6% of DSE studies177,178 ; acute MI is rare, occurring in <0.1%.177,178 Provocation of LVOT or midcavity obstruction with DSE occurs in up to 35% of patients.179,180 Those who develop LVOT obstruction but not midcavitary obstruction may be at risk for future chest pain and syncope.181 Women, patients with diabetes, and those receiving beta-blockers, calcium channel blockers, or both, were more likely to have suboptimal stress. Stress Echocardiography for Detection of Myocardial Ischemia Accuracy of Exercise Stress Echocardiography The accuracy of stress echocardiography for the detection of CAD has been well studied (Table 35.7). In 16 published studies including 1972 patients, the sensitivity of exercise stress echocardiography for the detection of coronary steno- ses >50% ranged from 71% to 97%.172,182–191 In a literature review, 44 articles met the criteria for determining the sen- sitivity and specificity of exercise echocardiography and exercise myocardial perfusion imaging with single photon emission computed tomography (SPECT) compared to coro- nary angiography for the diagnosis of CAD.192 In pooled data, the two modalities had similar sensitivities for detecting CAD (85% vs. 87%), but exercise echocardiography had sig- nificantly greater specificity (77% vs. 64%). Both tests per- formed better than standard exercise testing, for which a sensitivity of 68% and a specificity of 77% have been reported.193 The sensitivity of exercise echocardiography was better for the detection of multivessel disease than single- vessel disease (average 92%, range 80% to 100%; vs. average 79%, range 59% to 94%) in nine studies involving 1355 patients.182–185,187,188,190,194 Patient characteristics also influence the accuracy of exercise stress testing. Left ventricular hypertrophy, cardiomyopathy, microvascular disease, and an acute hypertensive response to exercise diminish the accuracy of exercise echocardiography compared with the angiographic standard.8 However, stress echocardiography may be more accurate than exercise myocardial perfusion imaging in this setting.194–196 Exercise myocardial perfusion imaging is more accurate in the presence of preexisting abnormal wall motion, left bundle-branch block, ventricular pacing, a previous MI, and cardiomyopathy. The accuracy of exercise echocardiography depends on the exercise level. Failure to achieve 85% of the MPHR precludes the exclusion of CAD. Submaximal exercise, single-vessel disease, and moderate coronary stenosis (50% to 70%) lead to false-nega- tive exercise echocardiographic results. The situations listed in Table 35.3 are appropriate indications for stress echocar- diography. This method is portable, low-cost, and free of TABLE 35.6. Dobutamine stress echocardiography end points Completed protocol Achieved target heart rate >85% of (220—age in years) Cardiac Angina New RWMA ≥2 segments Arrhythmia Ventricular tachycardia Atrial fibrillation with rapid response Supraventricular tachycardia LVOT obstruction (>4m/s) Abnormal blood pressure ≥230/120 SBP ≤80 Intolerable dobutamine reaction Anxiety, nausea, headache TABLE 35.7. Selected studies outlining the accuracy of exercise echocardiography Total No. Sensitivity Sensitivity Overall Reference of patients Sensitivity (%) for 1-VD (%) for MVD (%) Specificity (%) PPV (%) NPV (%) accuracy (%) Armstrong et al.182 123 88 81 93 86 97 61 88 Crouse et al.183 228 97 92 100 64 90 87 89 Marwick et al.184 150 84 79 96 86 95 63 85 Quinones et al.185 112 74 59 89 88 96 51 78 Hecht et al.186 180 93 84 100 86 95 79 91 Beleslin et al.188 136 88 88 91 82 97 50 88 Roger et al.187 127 88 — — 72 93 60 — Marwick et al.189 161 80 75 85 81 71 91 81 Marwick et al.194 147 71 63 80 91 85 81 82 Luotolahti et al.190 118 94 94 93 70 97 50 92 Roger et al.191 340 78 — — 41 79 40 69 1-VD, single vessel disease; MVD, multivessel disease; NPV, negative predictive value; PPV, positive predictive value. CAR035.indd 826CAR035.indd 826 11/29/2006 3:33:11 PM11/29/2006 3:33:11 PM
  • 17. ec hoc a r diog r a p h ic eva luat ion of corona ry a rt e ry dise a se 827 ionizing radiation. It provides additional information regard- ing valvular, structural, and hemodynamic factors that affect patient management and outcome. In a review of 1223 stress echocardiograms, a significant Doppler abnormality was detected in 17% (moderate or greater MR, 5.5%; mild or greater aortic insufficiency, 13%).197 For patients able to exercise, the 2003 ACC/AHA task force on chronic stable angina gave a class I recommendation for the use of exercise echocardiography as an initial diagnostic test or risk- stratification technique in patients with known or sus- pected CAD.34 The accuracy of stress echocardiography in identifying stenosis has consistently been greater in the LAD territory than in the RCA and LCx. The reported average sensitivity of exercise echocardiography for detecting coronary stenosis is 77% in the LAD, 75% in the RCA, and 49% in the circum- flex artery.182,184,198,199 This may be related to the greater extent of the LAD circulation and the ease with which it may be imaged. Overlap of the RCA and LCx territories further limits discrimination between the two. Prognosis After Exercise Stress Echocardiography Electrocardiographic and echocardiographic variables con- tribute to the prognostic value of exercise echocardiography. The exercise variables, exercise duration, and ischemic ST- segment depression remain important independent predictors of outcome when modeled with ventricular function at peak exercise.189 The extent and severity of exercise-induced LV dysfunction is the most important prognostic echocardiographic variable associated with isch- emia.200–202 Patients with negative stress echocardiograms have low rates of cardiac events at 1 (1%) and 3 (3%) years of follow-up. Conversely, patients with abnormal stress echo- cardiograms (LVEF <50%; wall-motion score index >1.4) had significant adverse events.203 The negative predictive value of a normal exercise echocardiogram in patients with normal exercise tolerance is >99%.201,203–205 The ACC has reported that stress echocardiography is a useful adjunct to standard exercise testing and provides a more sensitive and specific means of detecting myocardial ischemia; the diagnostic accuracy is similar to that of nuclear technologies, but stress echocardiography can be performed at a considerably lower cost. Accuracy of Dobutamine Stress Echocardiography The accuracy of DSE depends on the degree of coronary ste- nosis and the extent of myocardial ischemia.206,207 Harmonic imaging and LV opacification with intravenous contrast agents improve endocardial definition and the accuracy of DSE.208,209 In a study of 283 patients with suspected CAD, the positive predictive value of DSE increased significantly as the extent and severity of induced wall-motion abnormality increased (more myocardium at risk). Furthermore, the sensi- tivity increased as a faster maximal heart rate was achieved (sensitivity: 67% with an MPHR of <75%, 71% with an MPHR of 75% to 85%, and 86% with an MPHR of >85%; p <.05).207 The sensitivity and specificity for detecting CAD with DSE mirror those of exercise echocardiography in multiple studies with a range of sensitivity reported from 70% to 96% and specificity range from 66% to 93% (Table 35.8).193,195,210–219 A review of 28 studies involving 2246 patients who underwent both DSE and coronary angiography reported that DSE had an overall sensitivity of 80%, a specificity of 84%, and an accuracy of 81%. Like exercise echocardiography, DSE was more accurate in detecting multiple-vessel than single- vessel CAD (Table 35.8).210 In a review of 120 studies involv- ing 10,817 patients, DSE was more specific than SPECT myocardial perfusion imaging for the detection of obstruc- tive coronary disease (Table 35.9).212 Prognosis with Dobutamine Stress Echocardiography Dobutamine stress echocardiography predicts the prognosis in patients with CAD. Development of a new or worsening wall-motion abnormality (ischemic response) occurred in 321 patients, and a fixed wall-motion abnormality was iden- tified in 237 of 860 patients referred for DSE either for diag- nosis of suspected CAD (55%) or for risk stratification in patients with known CAD (45%).220 Adverse cardiac events (cardiac death and MI) occurred equally in both groups (14% and 13%, respectively) within 52 months of follow-up. The percentage of abnormal segments at peak stress, which incor- porates the extent of myocardial dysfunction and the amount of jeopardized myocardium, predicted a higher risk of subse- quent cardiac events (Fig. 35.19). Left ventricular dilatation at peak stress and a low ischemic threshold also increase TABLE 35.8. Selected studies outlining the accuracy of dobutamine echocardiography Dobutamine dose range Total No. Sensitivity Sensitivity Sensitivity Specificity Author (Ref.) (mg/kg/min) of patients (%) for 1-VD (%) for MVD (%) (%) PPV (%) NPV (%) Accuracy (%) Segar et al.217 5–30 88 95 — — 82 94 86 92 Marcovitz et al.213 5–30 141 96 95 98 66 91 84 89 McNeill et al.214 10–40 80 70 — — 88 89 67 78 Marwick et al.195 5–30 217 72 66 77 83 89 61 76 Previtali et al.216 5–30 80 79 63 91 83 92 61 80 Takeuchi et al.218 5–30 120 85 73 97 93 95 88 88 1-VD, single vessel disease; MVD, multivessel disease; NPV, negative predictive value; PPV, positive predictive value. CAR035.indd 827CAR035.indd 827 11/29/2006 3:33:12 PM11/29/2006 3:33:12 PM
  • 18. 828 c h a p t e r 35 adverse cardiac events.220 Conversely, patients with normal DSE results have low annual cardiovascular event rates. In a report of 1737 patients with known or suspected coronary heart disease (CHD),221 the annual event rate (cardiac death or MI) at 5-year follow-up was 1.2% when the study was normal. In a study of 301 patients unable to exercise, both DSE and dobutamine SPECT myocardial perfusion imaging were performed and outcomes were determined after 7 years of follow-up. The predictive value of both methods was equiv- alent. The annual cardiac mortality was 0.6% and 0.7%, and the annual cardiac event rates (death, MI, revascularization) were 3.3% and 3.6%, respectively, when the test was normal. With an abnormal test, the annual cardiac mortality was 2.8% and 2.6%, and the annual cardiac event rates were 6.9% and 6.5%, respectively.222 Risk Stratification After a Myocardial Infarction Dobutamine stress echocardiography has been successfully used for risk stratification of patients after an acute MI.223–225 In this setting, identification of viable and ischemic seg- ments with DSE improves risk stratification beyond tradi- tional clinical variables.226 In 123 patients with a previous MI, the diagnostic accuracy of exercise echocardiography for detecting significant coronary stenoses in infarct-related arteries was determined by comparison to quantitative coro- nary angiography performed within 2 weeks of stress echo- cardiography.227 Treadmill exercise echocardiography was highly sensitive (91%) regardless of infarct size but was less specific (59%) for detection of infarct-related coronary lesions.227 Assessment of Myocardial Viability Viable myocardium has been reported in up to 60% of dys- functional myocardial segments in ischemic cardiomyopa- thy.228,229 Myocardial segments that are viable and poorly perfused should recover function after coronary revascular- ization. Careful selection of patients for revascularization is imperative, as the operative mortality for coronary artery bypass in patients with LV systolic dysfunction varies from 5% to 30% (increasing with age and worsening LV func- tion).230 Furthermore, when performed in patients with significant global LV dysfunction but little viable myocar- dium, coronary bypass does not improve global systolic function.231,232 Dobutamine Stress Echocardiography in the Identification of Myocardial Viability Dobutamine stress echocardiography is the preferred echo- cardiographic method for the assessment of myocardial via- bility because inotropic stimulation is graded and imaging can be performed frequently. The DSE protocol for viability assessment differs from that used for the assessment of myo- cardial ischemia by including more images at lower dobu- tamine doses (Table 35.10). The goal is to identify any improvement in contractile reserve in patients with myocar- dial dysfunction, which may be transient in those with con- comitant ischemia. Viable segments should demonstrate contractile reserve with inotropic stimulation, normal myo- cardial thickness, and evidence of some coronary perfusion and metabolism.233 The biphasic response—initial improve- ment in contractility followed by deterioration at higher doses—indicates viable and ischemic myocardium and is a TABLE 35.9. Weighted mean sensitivities, specificities of pharmacologic studies Pharmacologic test Studies Subjects Mean age (years) CAD (%) MI (%) Men (%) Sensitivity (%) Specificity (%) Adenosine echocardiography 6 516 65 73 31 71 72 (62–79) 91 (88–93) Adenosine SPECT 9 1,207 63 80 17 59 90 (89–92) 75 (70–79) Dipyridamole echocardiography 20 1,835 56 67 15 72 70 (66–74) 93 (90–95) Dipyridamole SPECT 21 1,464 60 71 31 77 89 (84–93) 65 (54–74) Dobutamine echocardiography* 40 4,097 59 70 26 66 80 (77–83) 84 (80–86) Dobutamine SPECT 14 1,066 58 66 9 63 82 (77–87) 75 (70–79) Total 120† 10,817† CAD, coronary artery disease; MI, myocardial infarction; SPECT, single photon emission computed tomography. *One dobutamine echocardiographic study not included here because only multivessel disease was examined. †Total number of tests and subjects exceeds the number of studies reviewed because some studies examined more than one pharmacologic test. 0 0 20 Normal % of segments abnormal at peak stress ≤25 Ischemia Infarction 40 60 80 Event-free probability,% 100 10 20 Time, months 30 40 0 10 20 51–100 26–50 Time, months 30 40 No. at risk 774 641 235 40 774860 641 235 40860 FIGURE 35.19. Abnormalities on dobutamine stress echocardiog- raphy predict future adverse cardiac events. Left: Ischemia and fixed wall motion abnormalities (infarction) by dobutamine stress echo- cardiography decrease cumulative cardiac event–free probability. Right: The percentage of abnormal segments at peak stress increases the risk of future cardiac events. TABLE 35.10. Dobutamine stress protocol Ischemia vs. Viability Rest 10μg Rest 5μg Pre-peak Peak > 88% 10mcg Peak > 88% MPHR MPHR MPHR, maximal predicted heart rate. CAR035.indd 828CAR035.indd 828 11/29/2006 3:33:12 PM11/29/2006 3:33:12 PM
  • 19. ec hoc a r diog r a p h ic eva luat ion of corona ry a rt e ry dise a se 829 reliable predictor of functional recovery (Table 35.2).234 The value of DSE in the identification of myocardial viability and, therefore, in the selection of patients who may benefit from revascularization is well established. In a number of studies in which postrevascularization echocardiography has been used to assess LV functional recovery after catheter- based or surgical revascularization, the average sensitivity of DSE to predict functional recovery ranges from 74% to 88%, and the specificity is 73% to 87%.235–242 The positive predic- tive value is 81%, and negative predictive value is 87%. Com- parative studies have shown a higher specificity and a lower sensitivity with DSE than with radionuclide techniques for the identification of functional recovery after the revas- cularization of dysfunctional myocardial segments (Fig. 35.20).242–244 The end-diastolic myocardial wall thickness obtained by routine echocardiography is a simple and valuable marker of viability.245 In a study of 45 patients with stable CAD and ventricular dysfunction, a myocardial thickness of ≤6mm predicted poor recovery of function after revascularization. Apical segments were the most difficult to measure and accounted for nearly all of the immeasurable but dysfunc- tional segments (17%). A myocardial thickness of >6mm had a sensitivity of 94% and a specificity of 48% for recovery of function. A combination of preserved wall thickness and evidence of contractile reserve during DSE improved the specificity of DSE to 77% and, thus, is a valuable adjunct to DSE in the assessment of myocardial viability. Prognosis: Viability and Potential Benefits of Revascularization Patients with viability and LV dysfunction have improved survival with revascularization compared to medical therapy. A meta-analysis of 24 nonrandomized studies involving 3088 patients (mean LVEF 32% ± 8%) revealed an 80% relative reduction in death (3.2% vs. 16%; p <.0001) with revascular- ization compared with medical therapy when viability was present, but there was no benefit when viability was absent (7.7% vs. 6.2%) (Fig. 35.21).246 Viability testing also predicts improvement in regional and global LV function after revas- cularization.246 However, the extent of viable myocardium required in order to expect improvement in the LVEF after revascularization may range from 25% to 30% of the left ventricle.247 Survival is lowest for patients with severe LV dysfunction and no evidence of viability (mortality, 20% at 18 months), which is independent of revascularization.234 New Echocardiographic Quantitative Parameters Abnormalities of radial wall thickening are visualized subjectively by traditional 2D echocardiography as new or induced RWMAs. Abnormalities of longitudinal deforma- tion can be identified and quantified by TDI and can be assessed by tissue velocity and displacement, strain and strain rate imaging, and postsystolic shortening. Tissue Doppler imaging parameters have been shown to improve the accuracy of stress echocardiography in detecting myocar- dial ischemia and viability. Strain-Rate Imaging Strain-rate imaging provides objective quantification of seg- mental myocardial function by measuring myocardial defor- mation or the change in regional myocardial thickening and is relatively unaffected by adjacent tissue tethering or overall motion of the heart.248–250 Strain-rate imaging can enhance echocardiographic detection of ischemia and can differenti- ate viable from infarcted myocardium.12,15,18,251,252 Ischemia produces a delayed onset and termination of systolic shortening that is detectable with longitudinal strain and strain-rate imaging but not by 2D imaging. Evaluation of regional LV function by TDI velocities, using color M- mode analysis of segmental strain and strain rate, was per- formed in 44 patients undergoing traditional DSE.16 Ischemia was defined by concurrent pharmacologic SPECT myocar- dial perfusion imaging and stenosis confirmed by coronary DE 0 20 40 60 80 100 % 32 1090 Sensitivity p Specificity DE vs others others vs TI-RI MIBI vs TI-RR FDG vs others <.05 <.05 <.05 p <.05 <.05 <.05 TI-RI vs DE, MIBI TI-RR vs DE 22 557 11 301 20 488 20 598 Studies (no.) Patients (no.) TI-RR TI-RI MIBI FDG FIGURE 35.20. Techniques for the noninvasive assessment of myo- cardial viability; comparison of weighted sensitivities and specifici- ties. Regional recovery of function after revascularization was the gold standard for viability. Open bars, sensitivity; solid bars, speci- ficity. DE, dobutamine echo; FDG, fluorine-18 fluorodeoxyglucose; MIBI, technetium-99m sestamibi; Tl-RI, thallium-201 reinjection; Tl-RR, thallium-201 rest-redistribution. 20 15 10 5 3.2 16.0 7.7 6.2 NonviableViable –79.6% p<.0001 χ2 = 147 23.0% p = .23 χ2 = 1.43 Deathrate(%/yr) 0 FIGURE 35.21. Survival following revascularization is increased in patients with evidence of myocardial viability. Without myocardial viability, there was no significant difference in survival between patients treated medically and those revascularized. Open bars, revascularization; solid bars, medical therapy. CAR035.indd 829CAR035.indd 829 11/29/2006 3:33:12 PM11/29/2006 3:33:12 PM
  • 20. 830 c h a p t e r 35 angiography. Qualitative assessment of strain and strain-rate curves was possible in 85% of segments. In normally per- fused segments, the peak systolic strain rate increased with increasing dobutamine stimulation. Ischemic myocardial segments had significantly lower strain-rate increases and strain than did nonischemic segments. Compared with tra- ditional DSE parameters, strain-rate imaging improved the sensitivity of DSE from 81% to 86% and the specificity from 82% to 90% (Fig. 35.22).16 With ischemia, the myocardium continues to thicken during the isovolumic relaxation period.251 This postsystolic shortening is a sensitive but nonspecific marker of ischemia that was found in 100% of ischemic segments but also in 47% of nonischemic segments in the study by Voight and coworkers.16 Postsystolic shortening is not easily identified by 2D imaging because of its relatively low amplitude and short duration.10 Strain-rate imaging allows quantification of postsystolic shortening, which is defined as the maximum change in segment length occurring between aortic valve closure and the regional onset of myocardial lengthening caused by early diastolic LV filling. In one study, the ratio of postsystolic shortening to maximal segment deformation was the best quantitative parameter for identifying stress- induced ischemia with DSE.16 Peak myocardial deformation detected by strain-rate imaging can differentiate active myocardial motion from passive or translational cardiac motion in both animals and humanswithnontransmural(viable)andtransmuralinfarcted (scarred) myocardium. This method also allows noninvasive determination of the extent of nonviable infarcted myocar- dium.252,253 Myocardial viability assessment with DSE was improved by the addition of strain-rate imaging in 55 patients with MIs followed by percutaneous or surgical revasculariza- tion.254 The inclusion of regional strain-rate imaging with routine visual wall-motion scoring identified patients with significant myocardial viability (an improvement in more than four myocardial segments or an overall increase of >5% in the LVEF after revascularization) and increased the sensi- tivity of DSE from 73% to 83% without changing the speci- ficity. In a separate study,255 tissue Doppler echocardiography with strain-rate imaging without DSE differentiated trans- mural from nontransmural MIs in 47 consecutive patients with a first acute MI compared to 60 age-matched healthy volunteers. The peak systolic strain rate (>−0.59s−1 ) had a high sensitivity (90.9%) and specificity (96.4%) in identifying transmural infarctions. A peak strain rate between −0.98s−1 and −1.26s−1 had a sensitivity of 81.3% and a specificity of 83.3% in distinguishing subendocardial infarctions. The peak strain rate was significantly lower in segments with transmural infarctions identified with contrast magnetic resonance imaging compared to normal myocardium or seg- ments with a nontransmural infarction (both p <.0005).255 Perfusion Imaging Myocardial contrast echocardiography (MCE) is an evolving technique for the evaluation of myocardial perfusion. Intrave- nous injection of gas-filled microbubbles scatters ultrasound and can be used to define LV endocardial borders and myocar- dial blood flow. Steady-state microbubbles within the myocar- dium can be destroyed with high-energy ultrasound pulses, and the rate of microbubble reappearance approximates myo- cardial blood flow. Improvements in bubble size (<10μm to allow transcapillary migration), as well as echocardiogra- phic imaging techniques to enhance detection (harmonic imaging)256 and enhance the durability of the microbubbles (triggered imaging)257 with a low mechanical index258 have greatly improved the potential clinical applicability of this technique.259,260 Compared to other modalities of coronary perfusion, MCE has shown progressive improvements in accu- racy. Specificities range from 78% to 95%, but sensitivities for the detection of moderate to severe perfusion defects have been low (14% to 65%).261,262 A higher number of falsely abnor- mal results in the circumflex territory have been reported.263 Myocardial contrast echocardiography has been shown to be accurate in detecting flow-limiting CAD in patients with suspected CAD and in those undergoing vasodilator stress testing after an acute MI.264–266 This method may enhance the predictive value of standard, exercise, and dobutamine echocardiography. The addition of perfusion imaging has been shown to improve the sensitivity of routine echocar- diography for diagnosing myocardial ischemia in patients with suspected cardiac chest discomfort and nondiagnostic electrocardiographic abnormalities.256 The combination of perfusion defects and wall-motion abnormalities with exer- cise improved the sensitivity, specificity, and accuracy to 86%, 88%, and 86%, respectively, for establishing the pres- ence of CAD on angiography.267 Abnormal myocardial perfusion imaging during vasodi- lator stress (dobutamine) echocardiography in 788 patients contributed significantly to the predictive value of clinical risk factors, resting systolic LV function, and RWMAs. Event- free survival at 3 years decreased from 95% with normal wall motion and normal perfusion to 82% when perfusion was abnormal and 68% when both wall motion and perfusion were abnormal. Multivessel perfusion defects predicted the worst outcomes.268 100 8281 86 89 SRI sensitivity specificity 2D-gray 80 60 40 20 0 [%] FIGURE 35.22. Strain-rate imaging (SRI-CMM) improves the sen- sitivity and specificity of conventional two-dimensional imaging (2D-gray) during dobutamine stress echocardiography (DSE). CAR035.indd 830CAR035.indd 830 11/29/2006 3:33:12 PM11/29/2006 3:33:12 PM
  • 21. ec hoc a r diog r a p h ic eva luat ion of corona ry a rt e ry dise a se 831 Perfusion imaging may help differentiate CAD from other etiologies in patients with congestive heart failure and severe LV dysfunction. In 55 patients with acute congestive heart failure, identification of CAD as the etiology was facili- tated by MCE at rest and after dipyridamole stress. Com- pared to patients without CAD and to normal control subjects, patients with CAD had a reduced myocardial blood flow velocity reserve in vascular territories supplied by vessels with >50% obstruction. In this population, MCE was the only independent predictor of CAD among clinical, elec- trocardiographic, biochemical, and resting echocardiographic variables (Fig. 35.23).269 Myocardial contrast echocardiogra- phy may provide an added benefit to dobutamine echocar- diography in the evaluation of myocardial viability. The demonstration of specific patterns of contrast within dys- functional myocardial segments may discriminate viable from nonviable myocardium.270 References 1. Hatle L, Sutherland GR. Regional myocardial function—a new approach. Eur Heart J 2000;21:1337–1357. 2. Gallagher KP, Kumada T, Koziol JA, McKown MD, Kemper WS, Ross J Jr. Significance of regional wall thickening abnormali- ties relative to transmural myocardial perfusion in anesthe- tized dogs. Circulation 1980;62:1266–1274. 3. Lieberman AN, Weiss JL, Jugdutt BI, et al. Two-dimensional echocardiography and infarct size: relationship of regional wall motion and thickening to the extent of myocardial infarction in the dog. Circulation 1981;63:739–746. 4. Ren JF, Kotler MN, Hakki AH, Panidis IP, Mintz GS, Ross J. Quantitation of regional left ventricular function by two- dimensional echocardiography in normals and patients with coronary artery disease. Am Heart J 1985;110:552–560. 5. Schiller NB, Shah PM, Crawford M, et al. Recommendations for quantitation of the left ventricle by two-dimensional echocardiography. American Society of Echocardiography Com- mittee on Standards, Subcommittee on Quantitation of Two- Dimensional Echocardiograms. J Am Soc Echocardiogr 1989;2:358–367. 6. Cerqueira MD, Weissman NJ, Dilsizian V, et al. Standardized myocardial segmentation and nomenclature for tomographic imaging of the heart: a statement for healthcare professionals from the Cardiac Imaging Committee of the Council on Clini- cal Cardiology of the American Heart Association. Circulation 2002;105:539–542. 7. Lang RM, Bierig M, Devereux RB, et al., Chamber Quantifica- tion Writing Group; American Society of Echocardiography’s Guidelines and Standards Committee; European Association of Echocardiography. Recommendations for chamber quantifi- cation: a report from the American Society of Echocardiogra- phy’s Guidelines and Standards Committee and the Chamber Quantification Writing Group, developed in conjunction with the European Association of Echocardiography, a branch of the European Society of Cardiology. J Am Soc Echocardiogr 2005;18:1440–1463. 8. Armstrong WF, Zoghbi WA. Stress echocardiography: current methodology and clinical applications. J Am Coll Cardiol 2005;45:1739–1747. 9. Otto CM. Textbook of Clinical Echocardiography, 3rd ed. Philadelphia: WB Saunders, 2004. 10. Kvitting JP, Wigstrom L, Strotmann JM, Sutherland GR. How accurate is visual assessment of synchronicity in myocardial motion? An in vitro study with computer-simulated regional delay in myocardial motion: clinical implications for rest and stress echocardiography studies. J Am Soc Echocardiogr 1999; 12:698–705. 11. Garcia MJ, Rodriguez L, Ares M, et al. Myocardial wall velocity assessment by pulsed Doppler tissue imaging: characteristic findings in normal subjects. Am Heart J 1996;132:648–656. 12. Wilkenshoff UM, Sovany A, Wigstrom L, et al. Regional mean systolic myocardial velocity estimation by real-time color Doppler myocardial imaging: a new technique for quantifying regional systolic function. J Am Soc Echocardiogr 1998;11: 683–692. 13. D’Hooge J, Heimdal A, Jamal F, et al. Regional strain and strain rate measurements by cardiac ultrasound: principles, imple- mentation and limitations. Eur J Echocardiogr 2000;1: 154–170. 14. Urheim S, Edvardsen T, Torp H, Angelsen B, Smiseth OA. Myocardial strain by Doppler echocardiography. Validation of a new method to quantify regional myocardial function. Cir- culation 2000;102:1158–1164. 15. Jamal F, Kukulski T, Sutherland GR, et al. Can changes in systolic longitudinal deformation quantify regional myocar- dial function after an acute infarction? An ultrasonic strain rate and strain study. J Am Soc Echocardiogr 2002;15: 723–730. 16. Voigt JU, Exner B, Schmiedehausen K, et al. Strain-rate imaging during dobutamine stress echocardiography provides objective evidence of inducible ischemia. Circulation 2003;107: 2120–2126. 17. Gorcsan J 3rd. Echocardiographic strain imaging for myocar- dial viability: an improvement over visual assessment? Circu- lation 2005;112:3820–3822. 18. Voigt JU, Arnold MF, Karlsson M, et al. Assessment of regional longitudinal myocardial strain rate derived from Doppler myo- cardial imaging indexes in normal and infarcted myocardium. J Am Soc Echocardiogr 2000;13:588–598. 19. Tei C, Ling LH, Hodge DO, et al. New index of combined sys- tolic and diastolic myocardial performance: a simple and repro- ducible measure of cardiac function—a study in normals and dilated cardiomyopathy. J Cardiol 1995;26:357–366. 20. Broberg CS, Pantely GA, Barber BJ, et al. Validation of the myocardial performance index by echocardiography in mice: a noninvasive measure of left ventricular function. J Am Soc Echocardiogr 2003;16:814–823. FIGURE 35.23. Perfusion imaging with myocardial contrast echo- cardiography demonstrates myocardial blood flow in viable myocar- dial segments and may be useful to discriminate coronary arterial obstruction as a cause of congestive heart failure. Apical four– chamber view at rest (left) in a patient with acute congestive heart failure and LV dysfunction (LVEF, 42%) demonstrating normal myo- cardial perfusion at rest (5 seconds after myocardial contrast destruction). Right: After dipyridamole stress, four-chamber view displayed 3 seconds after myocardial contrast destruction. Note perfusion defect in the septum, apex, and lateral wall. LAD and LCx flow limiting stenoses were confirmed by coronary angiography. CAR035.indd 831CAR035.indd 831 11/29/2006 3:33:12 PM11/29/2006 3:33:12 PM