JACKfm & JACK 2 (Combined) Infographic Q4 2015
•
0 likes•57 views

JACKfm & JACK 2 (Combined) Infographic Q4 2015

Recommended
Recommended
More Related Content
Viewers also liked
Viewers also liked (14)
Similar to JACKfm & JACK 2 (Combined) Infographic Q4 2015
Similar to JACKfm & JACK 2 (Combined) Infographic Q4 2015 (20)
Recently uploaded
Recently uploaded (20)
JACKfm & JACK 2 (Combined) Infographic Q4 2015
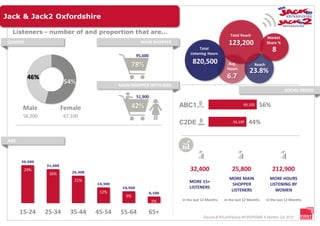
- 1. 56% 44% 69,100 54,100 29% 26% 21% 12% 9% 5% 35,500 31,400 25,400 14,300 10,500 6,100 15-24 25-34 35-44 45-54 55-64 65+ GENDER MAIN SHOPPER 78% 42% ABC1 C2DE Source // RAJAR/Ipsos-MORI/RSMB 6 Months Q4 2015 Listeners - number of and proportion that are... 95,600 51,900 Jack & Jack2 Oxfordshire 23.8% 123,200 8 6.7 820,500 32,400 25,800 212,900 MORE 15+ LISTENERS MORE MAIN SHOPPER LISTENERS MORE HOURS LISTENING BY WOMEN in the last 12 Months in the last 12 Months in the last 12 Months 54% 46% Male Female 56,200 67,100 MAIN SHOPPER WITH KIDS AGE SOCIAL GRADE Total Listening Hours Total Reach Market Share % Avg. Hours Reach
- 2. More Weeks, More Listeners. Predicted - Week 1 Predicted - Week 4 Predicted - Week 8 Predicted - Week 13 Source // RAJAR/Ipsos-MORI/RSMB 6 Months Q3 2015 Listeners - number of and proportion that are... 23.8% 37.2% 43.4% 47.4% 123,200 192,500 224,500 245,300 The Bay Audience ADULTS 17+ WITH 1 OR MORE CARS IN HOUSEHOLD ADULTS 18+ LIVING IN OWNED HOME ADULT LISTENERS THAT LISTEN TO NO OTHER LOCAL COMMERCIAL STATION 110,500 80,500 65,400 90% 65% 53% Jack & Jack2 Oxfordshire Local Gets Vocal Research by d.fferentology for First Radio 2014 62% 46% “Agree: I am more likely to consider a company/brand I hear on my station increased Brand consideration Action taken after hearing about a brand on my station Local Stations are more influential at a local level My Local Station Other Commercial Radio listeners “ ” Agree: It feels like part of my area My Local Station Other Commercial Radio listeners 85% 52% Visited a store Bought Searched online My Local Station Other Commercial Radio listeners 42% 30% 52% 29% 60% 46% “ “