Break even analysis
•
2 likes•4,638 views

Breakeven analysis and route profitability, for SAH-BAH-SAH using A320 aircraft, in this article we define fixed cost, variable costs and revenue. A program is developed and a dynamic impact and effect of changing Fare, Distance, Capacity, and market demand will immediately reflects in final results in defining the breakeven point and minimum passengers required.

Recommended
More Related Content
What's hot
What's hot (20)
Similar to Break even analysis
Similar to Break even analysis (20)
More from Mohammed Awad
More from Mohammed Awad (20)
Recently uploaded
Recently uploaded (20)
Break even analysis
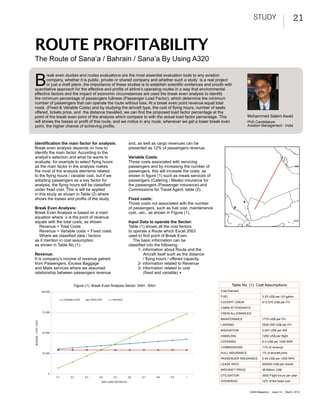
- 1. study 21 Route Profitability The Route of Sana’a / Bahrain / Sana’a By Using A320 B reak even studies and routes evaluations are the most essential evaluation tools to any aviation company, whether it is public, private or shared company and whether such a study is a real project or just a draft plans ,the importance of these studies is to establish scientific evidences and proofs with quantitative approach for the effective and profits of airline’s operating routes in a way that environmental effective factors and the impact of economic circumstances are used the break even analysis to identify the minimum percentage of passengers fullness (Passenger Load Factor), which determine the minimum number of passengers that can operate the route without loss. At a break even point revenue equal total costs (Fixed & Variable Costs) and by studying the aircraft type, the cost of flying hours, number of seats offered, tickets price, and the distance travelled, we can find the proposed load factor percentage at the point of the break even point of the analysis which compare to with the actual load factor percentage. This Mohammed Salem Awad will shows the losses or profit of this route, and we notice in any route, whenever we get a lower break even PhD Candidature point, the higher chance of achieving profits. Aviation Management - India Identification the main factor for analysis: and, as well as cargo revenues can be Break even analysis depends on how to presented as 12% of passengers revenue. identify the main factor. According to the analyst’s selection and what he wants to Variable Costs: evaluate, for example to select flying hours Those costs associated with servicing as the main factor in the analysis makes passengers and by increasing the number of the most of the analysis elements related passengers, this will increase the costs, as to the flying hours / variable cost, but if we shown in figure (1) such as meals services of adopting passengers as a key factor for passengers (Catering / Meals) insurance for analysis, the flying hours will be classified the passengers (Passenger insurance) and under fixed cost. This is will be applied Commissions for Travel Agent. table (2). in this study as shown in Table (2) where shows the losses and profits of the study. Fixed costs: Those costs not associated with the number Break Even Analysis: of passengers, such as fuel cost, maintenance Break Even Analysis is based on a main cost...etc., as shown in Figure (1). equation where x is the point of revenue equals with the total costs, as shown Input Data to operate the Sector: Revenue = Total Costs Table (1) shows all the cost factors Revenue = Variable costs + Fixed costs to operate a Route which Excel 2003 Where we classified data / factors used to find point of Break Even. as it mention in cost assumption The basic information can be as shown in Table No.(1). classified into the following: 1- information about Route and the Revenue: Aircraft itself such as the distance It is company’s income of revenue gained / flying hours / offered capacity. from Passengers, Excess Baggage 2- information related to Revenue and Mails services where we assumed 3- information related to cost relationship between passengers revenue (fixed and variable)8 BREAK EVEN ANALYSIS Sector : SAH - Analysis Sector: SAH - BAH Figure (1): Break Even BAH Table No. (1): Cost Assumptions 100,000 Cost Element FUEL 3.25 US$ per US gallon VARIABLE COST FIXED COST REVENUE COCKPIT CREW 413.375 US$ per FH CABIN ATTENDANTS 75,000 CREW ALLOWANCES MAINTENANCE 1775 US$ per FH REVENUE - COST (USD) LANDING 2939.259 US$ per FH NAVIGATION 0.547 US$ per KM 50,000 HANDLING 1280 US$ per flight CATERING 6.4 US$ per 1000 RPK COMMISSIONS 11% of revenue 25,000 HULL INSURANCE 1% of aircraft price PASSENGER INSURANCE 0.49 US$ per 1000 RPK LEASE RATE 450000 US$ per month AIRCRAFT PRICE 36 Million US$ 0 0٫1 0٫2 0٫3 0٫4 0٫5 0٫6 0٫7 0٫8 0٫9 1 UTILISATION 3500 Flight hours per year SEAT LOAD FACTOR (%) OVERHEAD 12% of the fixed cost CAMA Magazine | issue 14 | March, 2012
- 2. 22 study Case study (Sana’a / Table No. (2) Bahrain/Sana’a Route): Costs Costs by taking information sector Route SECTOR DATA SAH-BAH BAH-SAH Fixed Cost SAH-BAH BAH-SAH Variable Cost SAH-BAH BAH-SAH of Sana’a /Bahrain and by using Distance (nm) 739 739 Fuel 7100 7100 Catering 1509 1509 all the assumptions shows in Block Time Landing 2939 2939 Passengers Inssurance Table (1) some of assumptions Flight Time 3.15 3.15 Handling 1280 1280 Commissions 8096 8096 provided by Airbus or we can Block Fuel (US G) 2184.7 2184.7 Navigation 749 749 rely on the information of the x x Cockpit Crew Total Cost 42,287 42,287 company’s final accounts in Passengers to be determine Cabin Attendance order to have the similar values Seat Avialable 160 160 Crew Allowances BREAK EVEN ANALYSIS to those assumptions, as we Average Fare (USD) 400 400 Maintenance 11002 11002 Passenger Break Even will represent the load factor Hull Insurance 1250 1250 Load Factor 48 48 percentage by unknown variable Lease Rate 4860 4860 Number of Passengers value (x), This will reflect the ratio Total Fixed Cost 29180 29180 at Break Even 77 77 of Break Even point analysis, Revenue Average No. of Pax/Flt and we can apply linear equation Pax Revenue 64000 64000 based on 5 Flts/week 81 81 (y=mx+c), which represent a fixed Cargo Revenue 9600 9600 Overhead 3501.6 3501.6 No. of Pax 4 4 cost factor (c) and variable cost Total Revenue 73,600 73,600 Sub Total Cost 32,682 32,682 (Profit / Losses) Profit Profit (mx) and represent revenue by another equation x which pass Table No. (3) by point of starting (origin) and REPUBLIC OF YEMEN represent (y=nx). And at the CITY AIRLINE DISEMBARKED EMBARKED TOTAL CUMULATIVE 2010/2009 intersecting point of two lines, JAN-DEC 10 JAN-DEC 10 CUMLATIVE 10 LAST YEAR 09 GROWTH % the break even point will define. which can be found by solving ADEN(ADE) GULF AIR (GF) 5,938 1,952 7,890 - - the previous equation i.e SANNAA(SAH) GULF AIR (GF) 12,630 14,488 27,118 35,225 -23% y = mx + c 2,067 - 2,067 10,379 -80% SANNAA(SAH) JAZEERA AIRWAYS (J9) y = nx so accordingly, we can easily SANNAA(SAH) YEMENIA-YEMEN AIRWAYS (IY) 1,938 3,285 5,223 5,771 -9% find the Average Load Factor TOTAL 22,573 19,725 42,298 51,375 -18% at the point of the break even and then find the number of Figure (2): Ideal Operation for A320 passengers at the point to more profits. And by breaking the break even, that is through competition with other airlines Frequencies Vs Market Demand by A 320 of 160 Seat average load factor multiplied could be reduced ticket prices 450 100 100 100 by Aircraft Capacity. as shown validity after that break even in Table (2). So by referring percentage, whether in the form 407 90 to market demand of 2010, of of groups or individually, giving 400 85 Bahrain airport, Yemen segment the company an competitive operation, the total demand advantage than other companies. 350 No. of Pax 80 was 42,298 and the outcomes Good example is airport Load Factor Number of Passengers Per Flight of the break even analysis by office that provide tickets at 70 300 using A320 of 160 seat is 48% the departure called (Ticket On 64 i.e equivalent to 77 passengers Departure) to accept tickets 60 Load Factor % as shown in Figure (2). at the last moments before 250 51 > 48 ( break even This shows that the companies departure if seats still available. 50 Not Recommend to operate load factor ) due to spill passangers can operate profitability when So these seats must be sold if 200 203 42 frequencies 3-5 frequency per possible to increase the revenue 40 weeks where as any operation of the company. Finally we can 36 150 greater than will lead to losses, evaluate all the routes and its 136 32 30 while operation less than that profitability by comparing the will lead to spill of passengers. rate of actual payload factor 100 102 81 Pax 20 with the number of passengers 68 Yield management: resulted from the break even 50 Ideal 58 51 analysis for the same route. Losses in 10 The importance of this analysis Operation based on applying it by yield Here a decision can be for A320 Operation management policy as an empty taken to continue to operate 0 0 seat when the plane take off has the route or not operating. 1 2 3 4 5 6 7 8 no value or as they say does not Number of Frequencies come back. And this issue can be Yemen – Bahrain Market: solved by applying this technique. Yemen – Bahrain market is Summary: when flight reaches the clearly shown in table no. (3) The break even analysis considered as the most important equivalent point (Revenue as the competition between 3 tool for making decision of airlines, especially in Commercial = Cost), these goals must airlines i.e Gulf Air, Yemenia, Department/Revenue Management where airlines’ policies might be planned by the airline’s and Al-Jazeera while Gulf Air be built to increase revenue and the most important elements decision-makers and carried deminated the biggest market for analysis are these values and assumptions which provided out by those who are in work share, operating A320 of 160 by company’s final financial accounts report. Also it shows the field (Booking Offices- first line) (assume) and according to appropriate capacity for this aircraft in this sector/route. in terms of their ability to be 2010 Bahrain airport statistics, So it is possible to determine the suitable aircraft with break even flexible and take the appropriate mainly of 42298 pax, so the percentage, either if it is too tight and whether there is no way for decision in right moment, by typical load factor (B.E.) will be profits or the offered capacity is more than required of market accepting revenue which is 48% equivalent to 77 pax, and demand and what are the appropriate solutions, is it in re-sizing really considered a profit to the that will be visible when the aircraft type? or changing the offered capacity? or evaluate the company at reasonable prices airline operate 5 frequencies per market fare?■ in order to increase and gain week as shown in Figure (2). CAMA Magazine | issue 14 | March, 2012
- 3. Route Profitability The Most Beautiful Country Civil Aviation & Meteorology Authority (Yemen) January - March 2012, issue 14 Airopts Forecasting BAHRAIN Civil aviation overview www.camamagazine.com