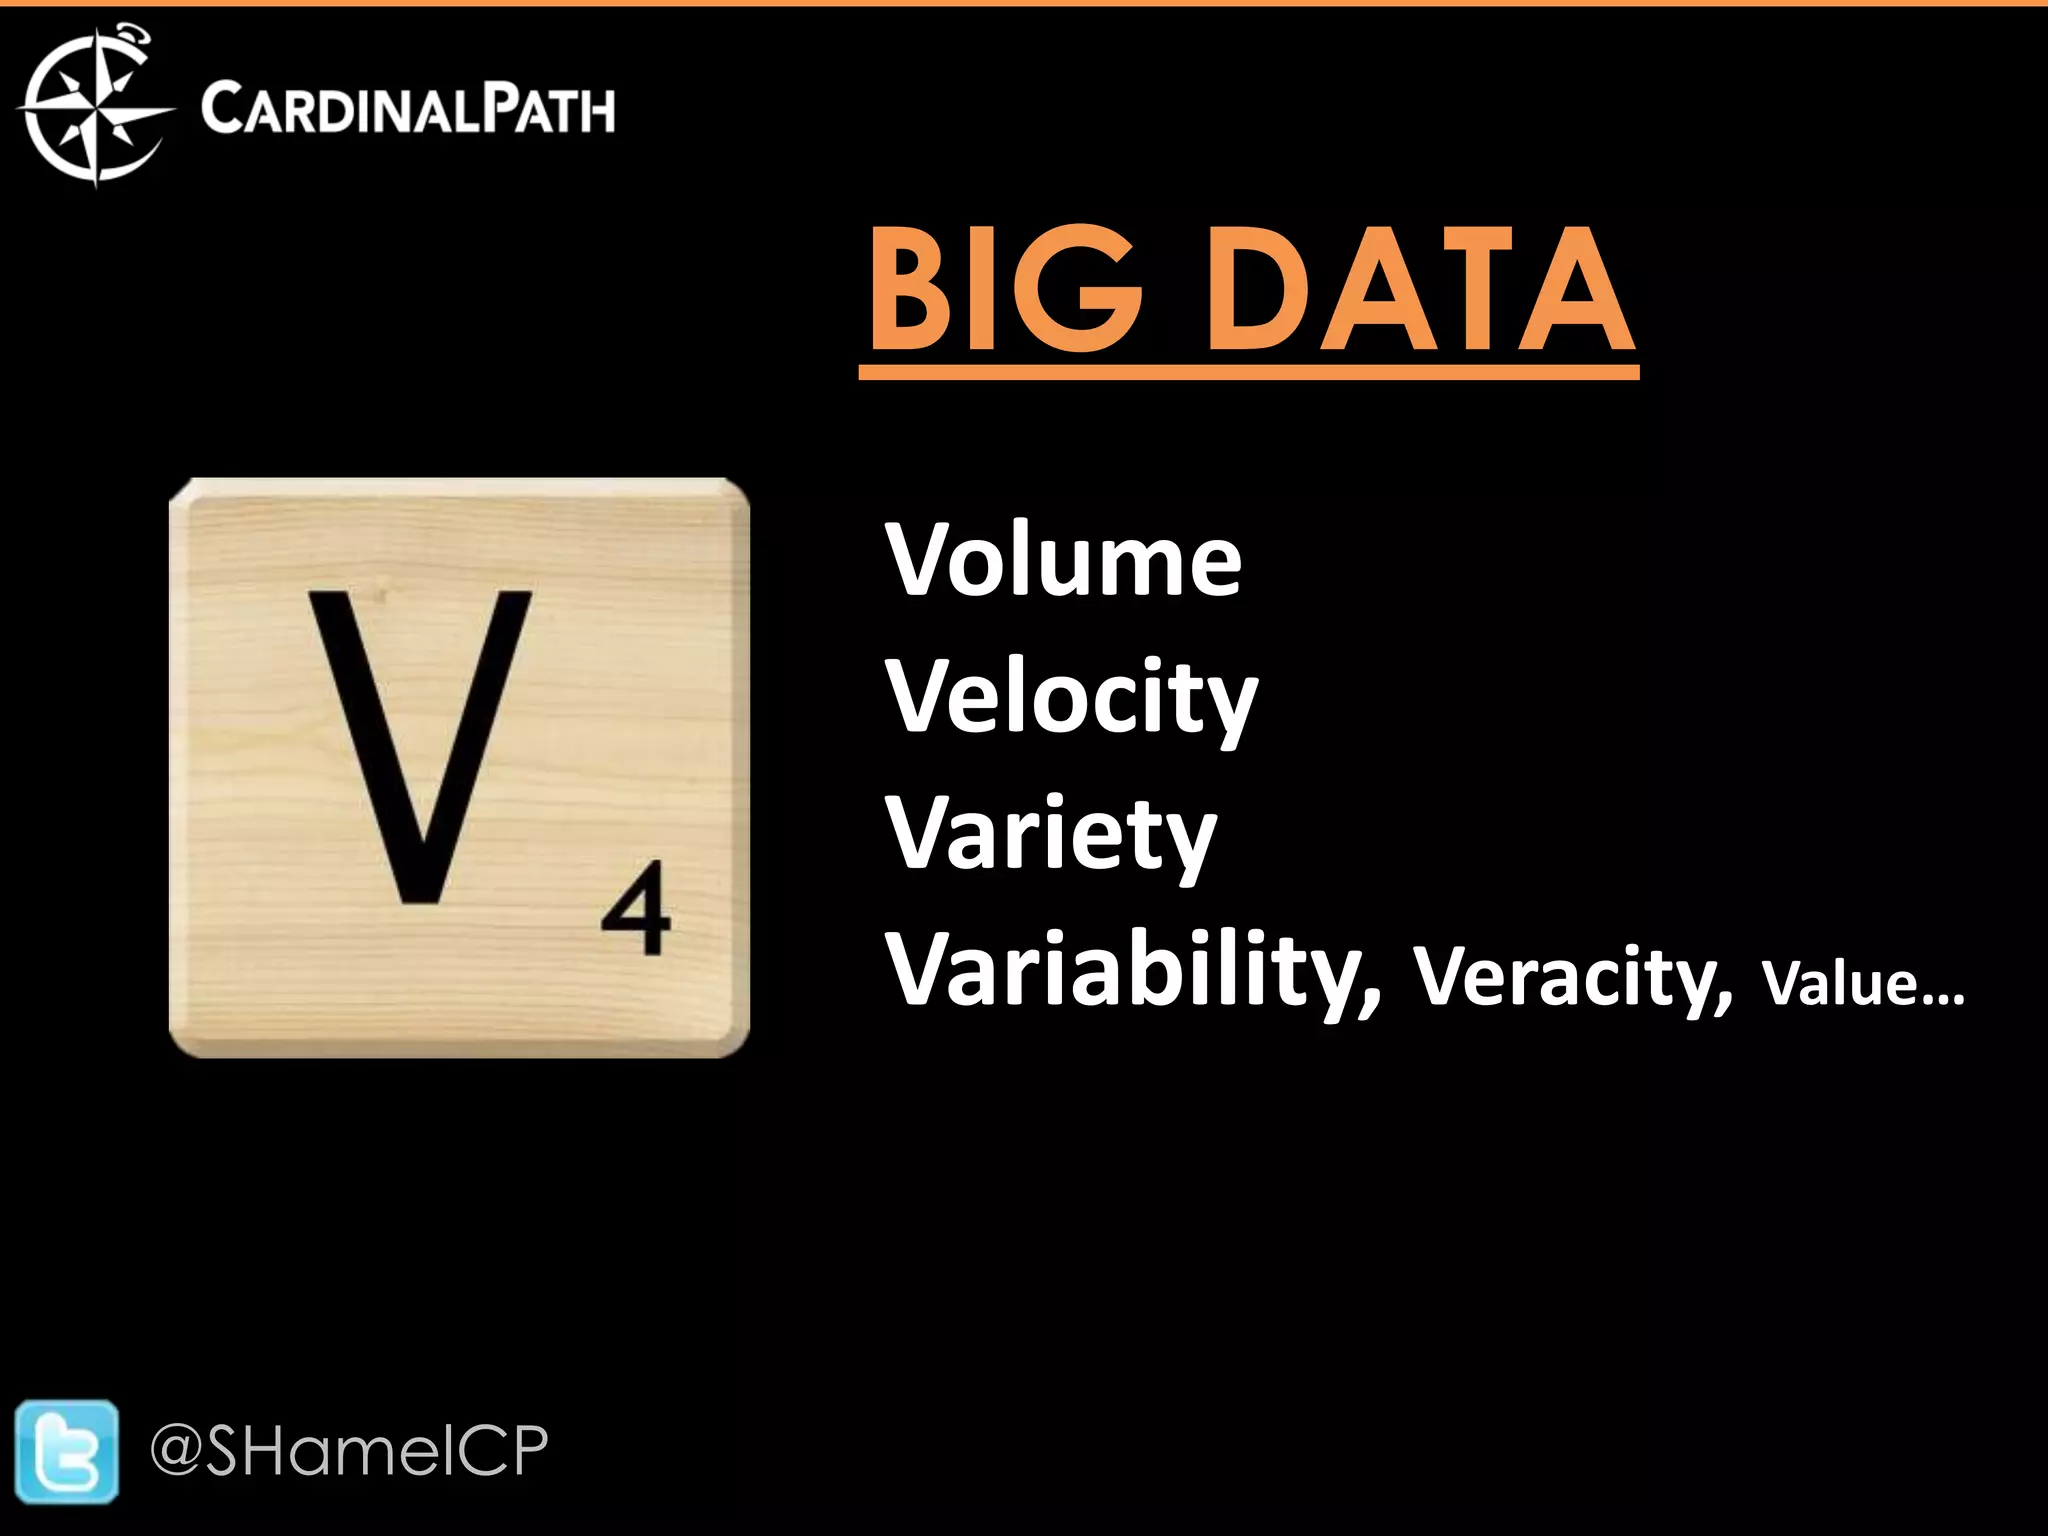
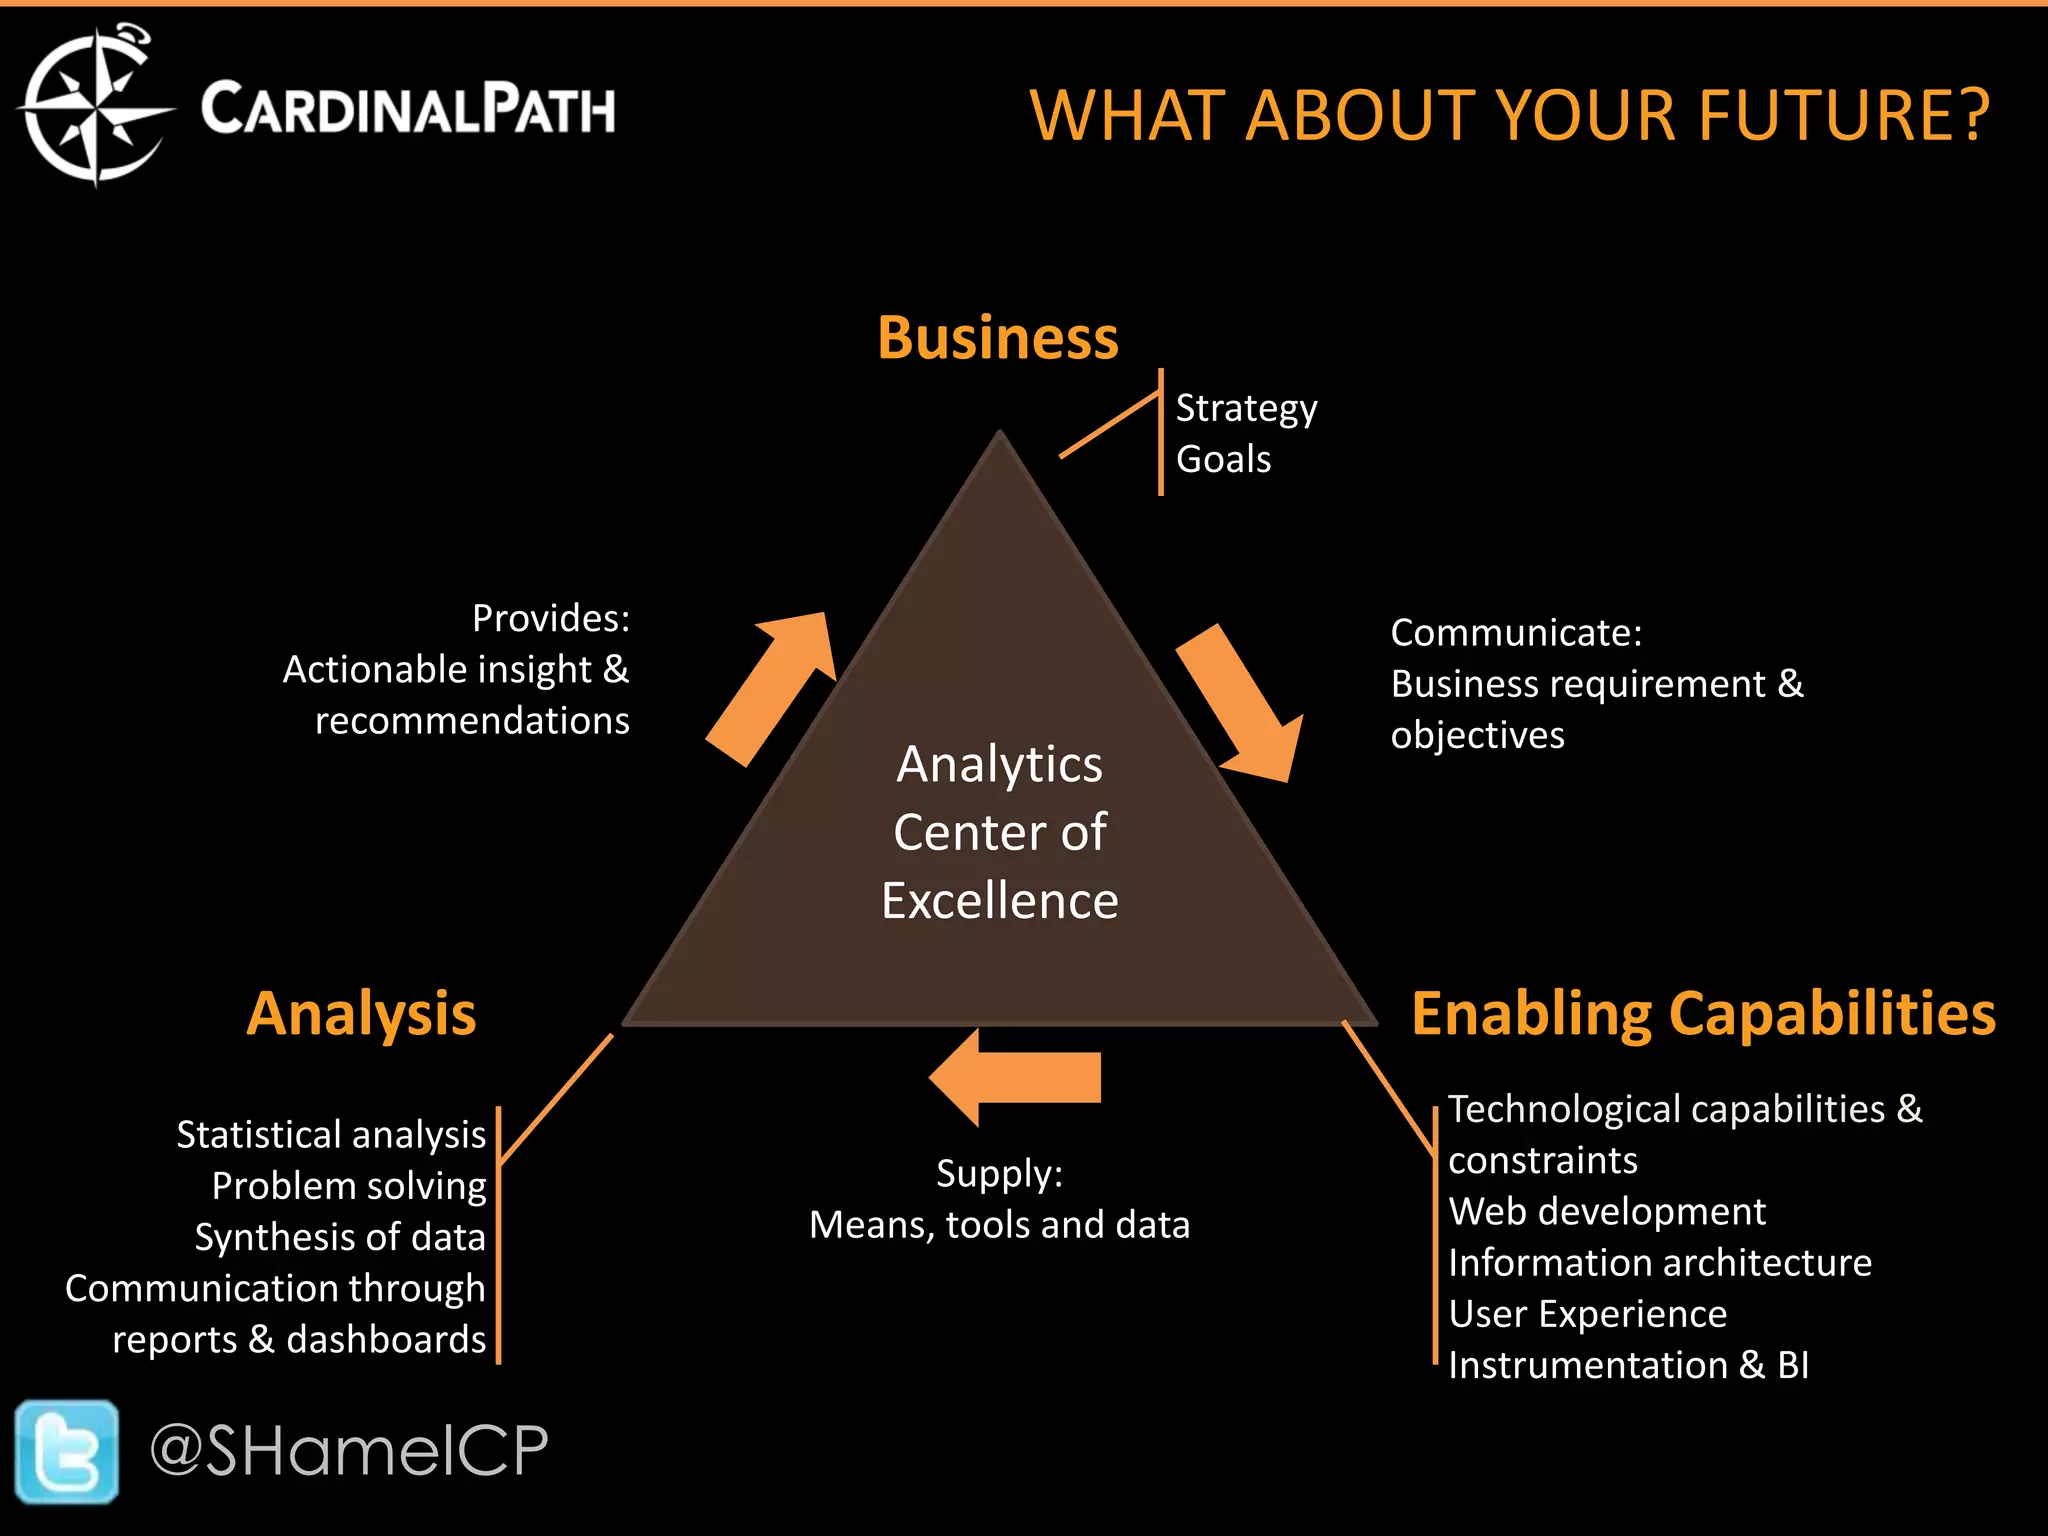
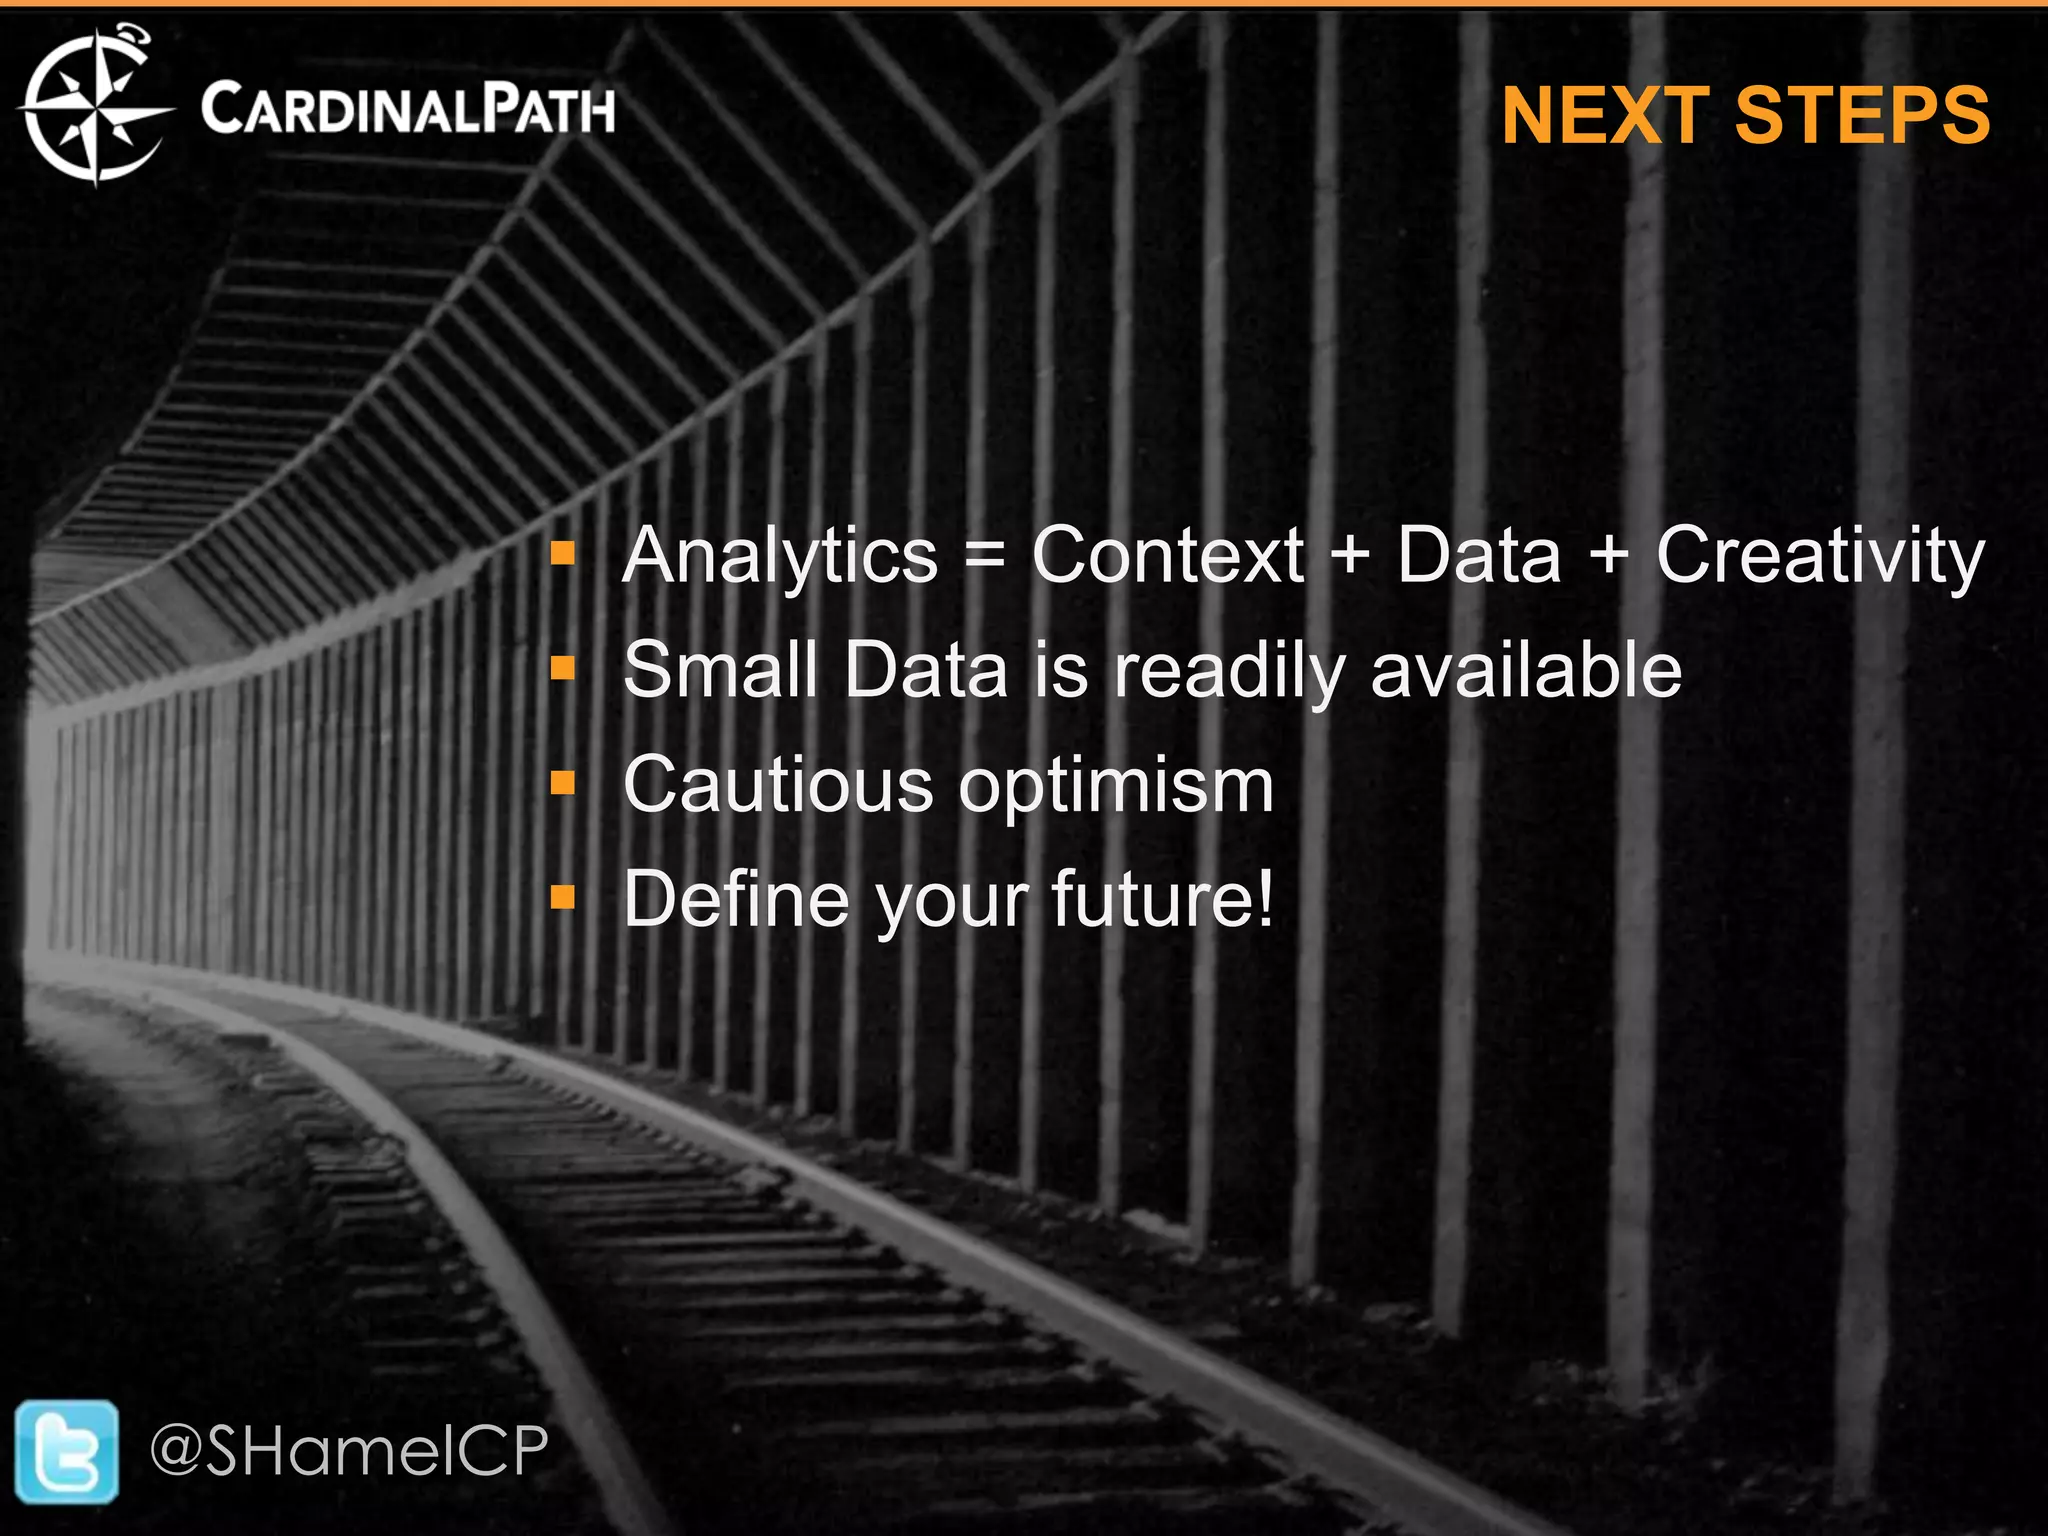
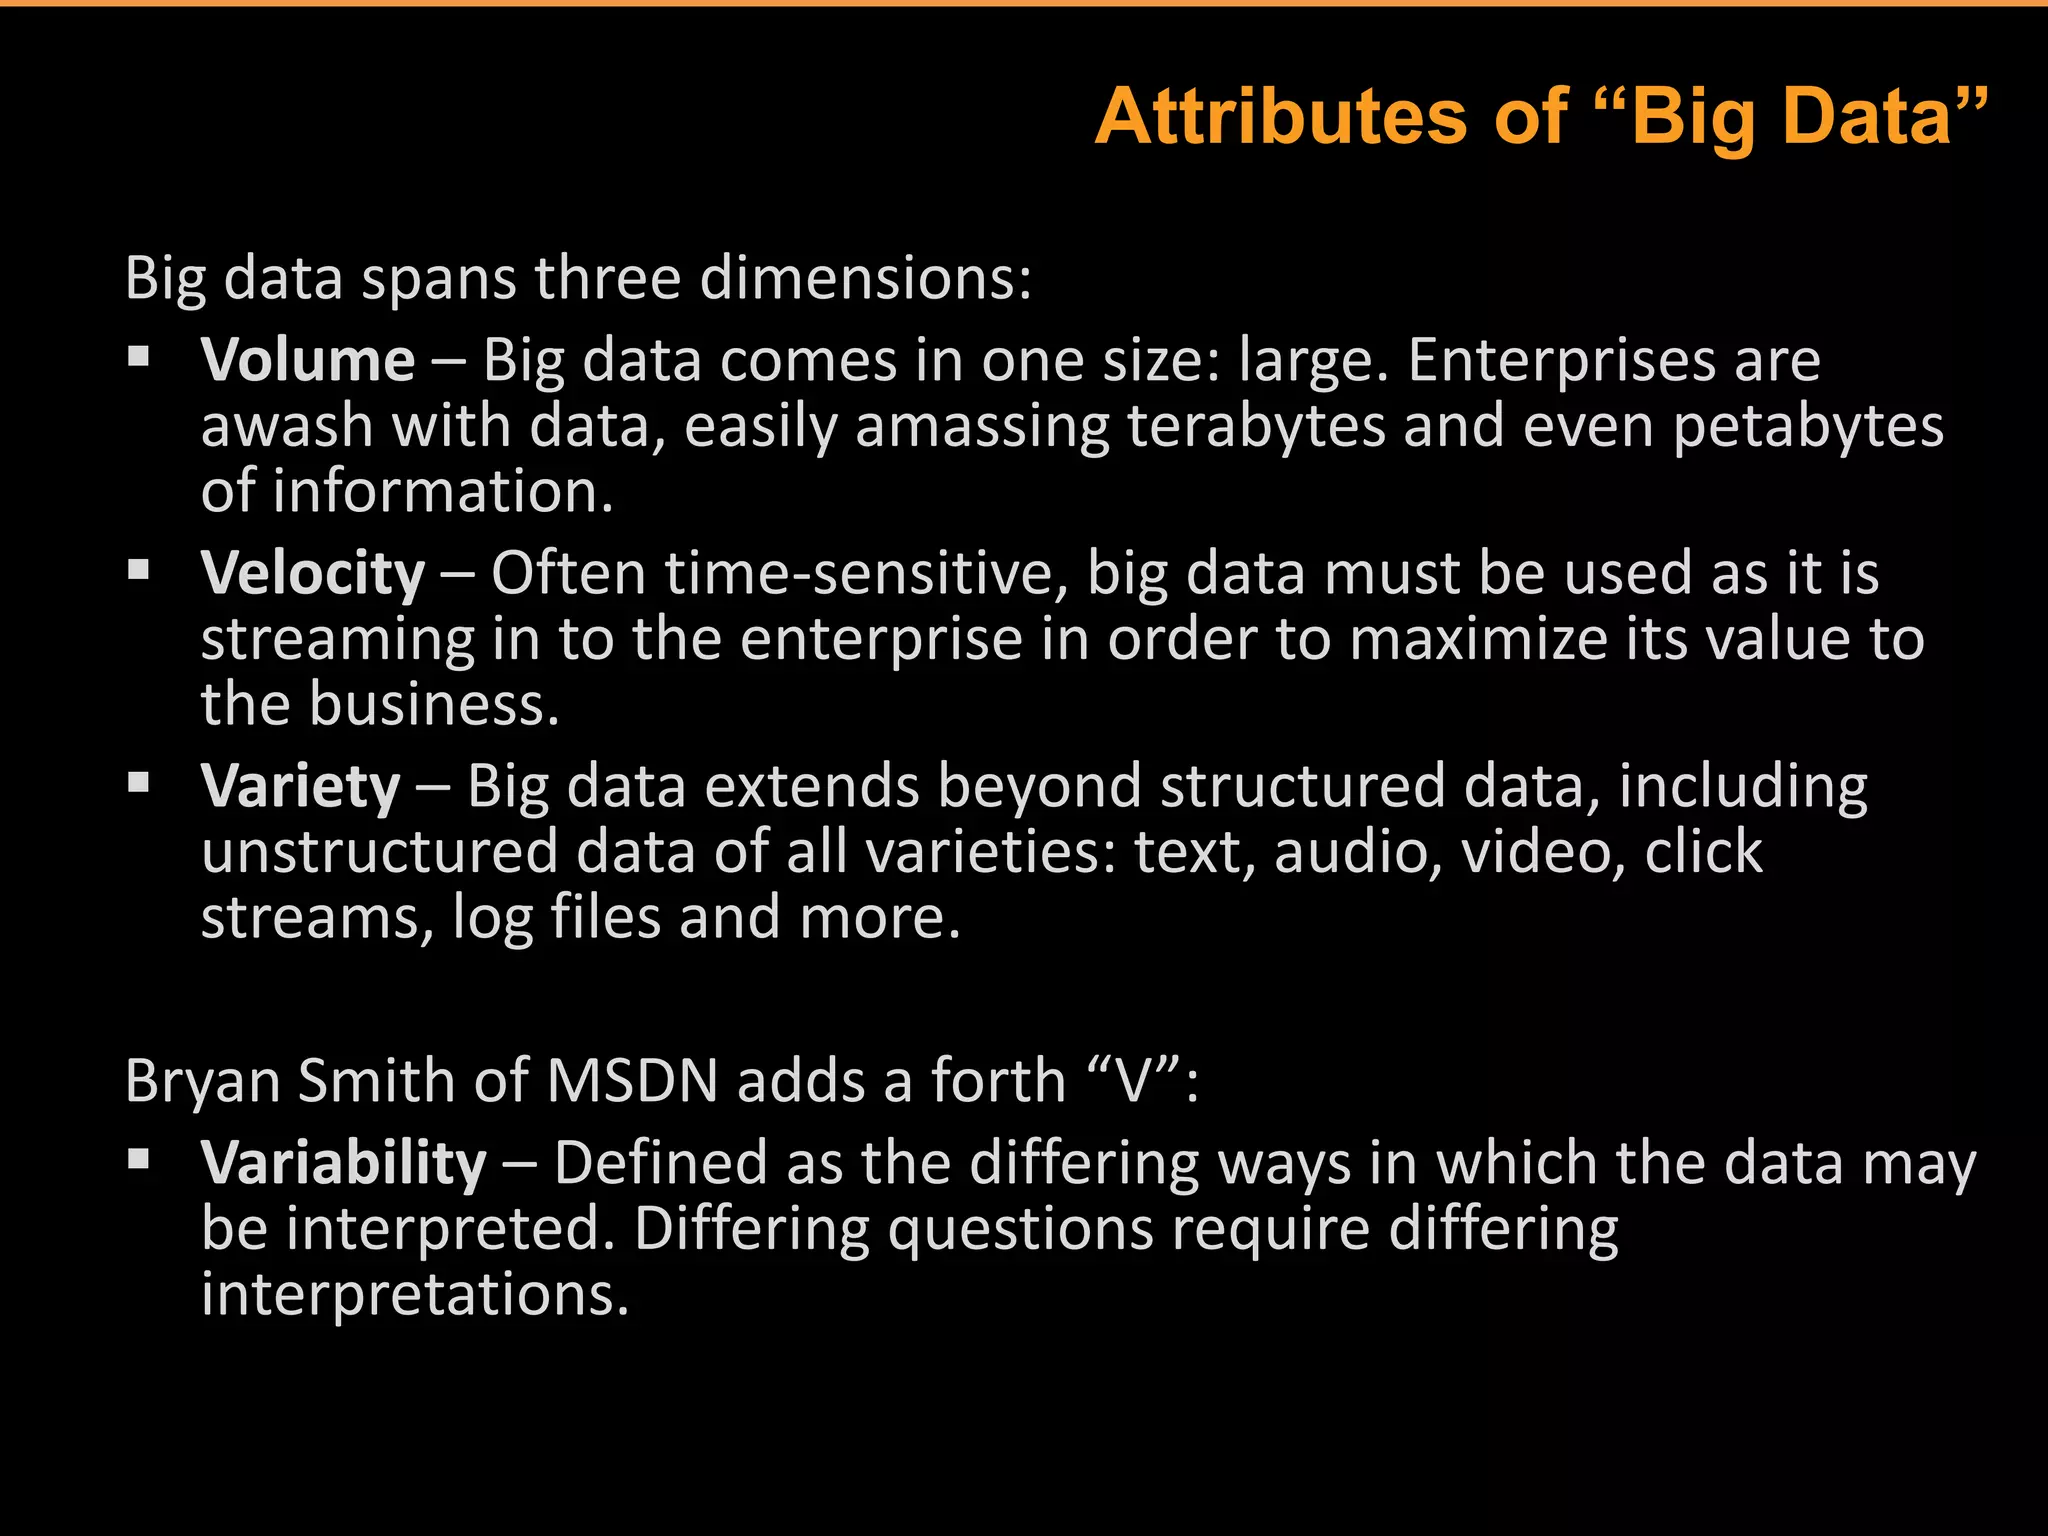
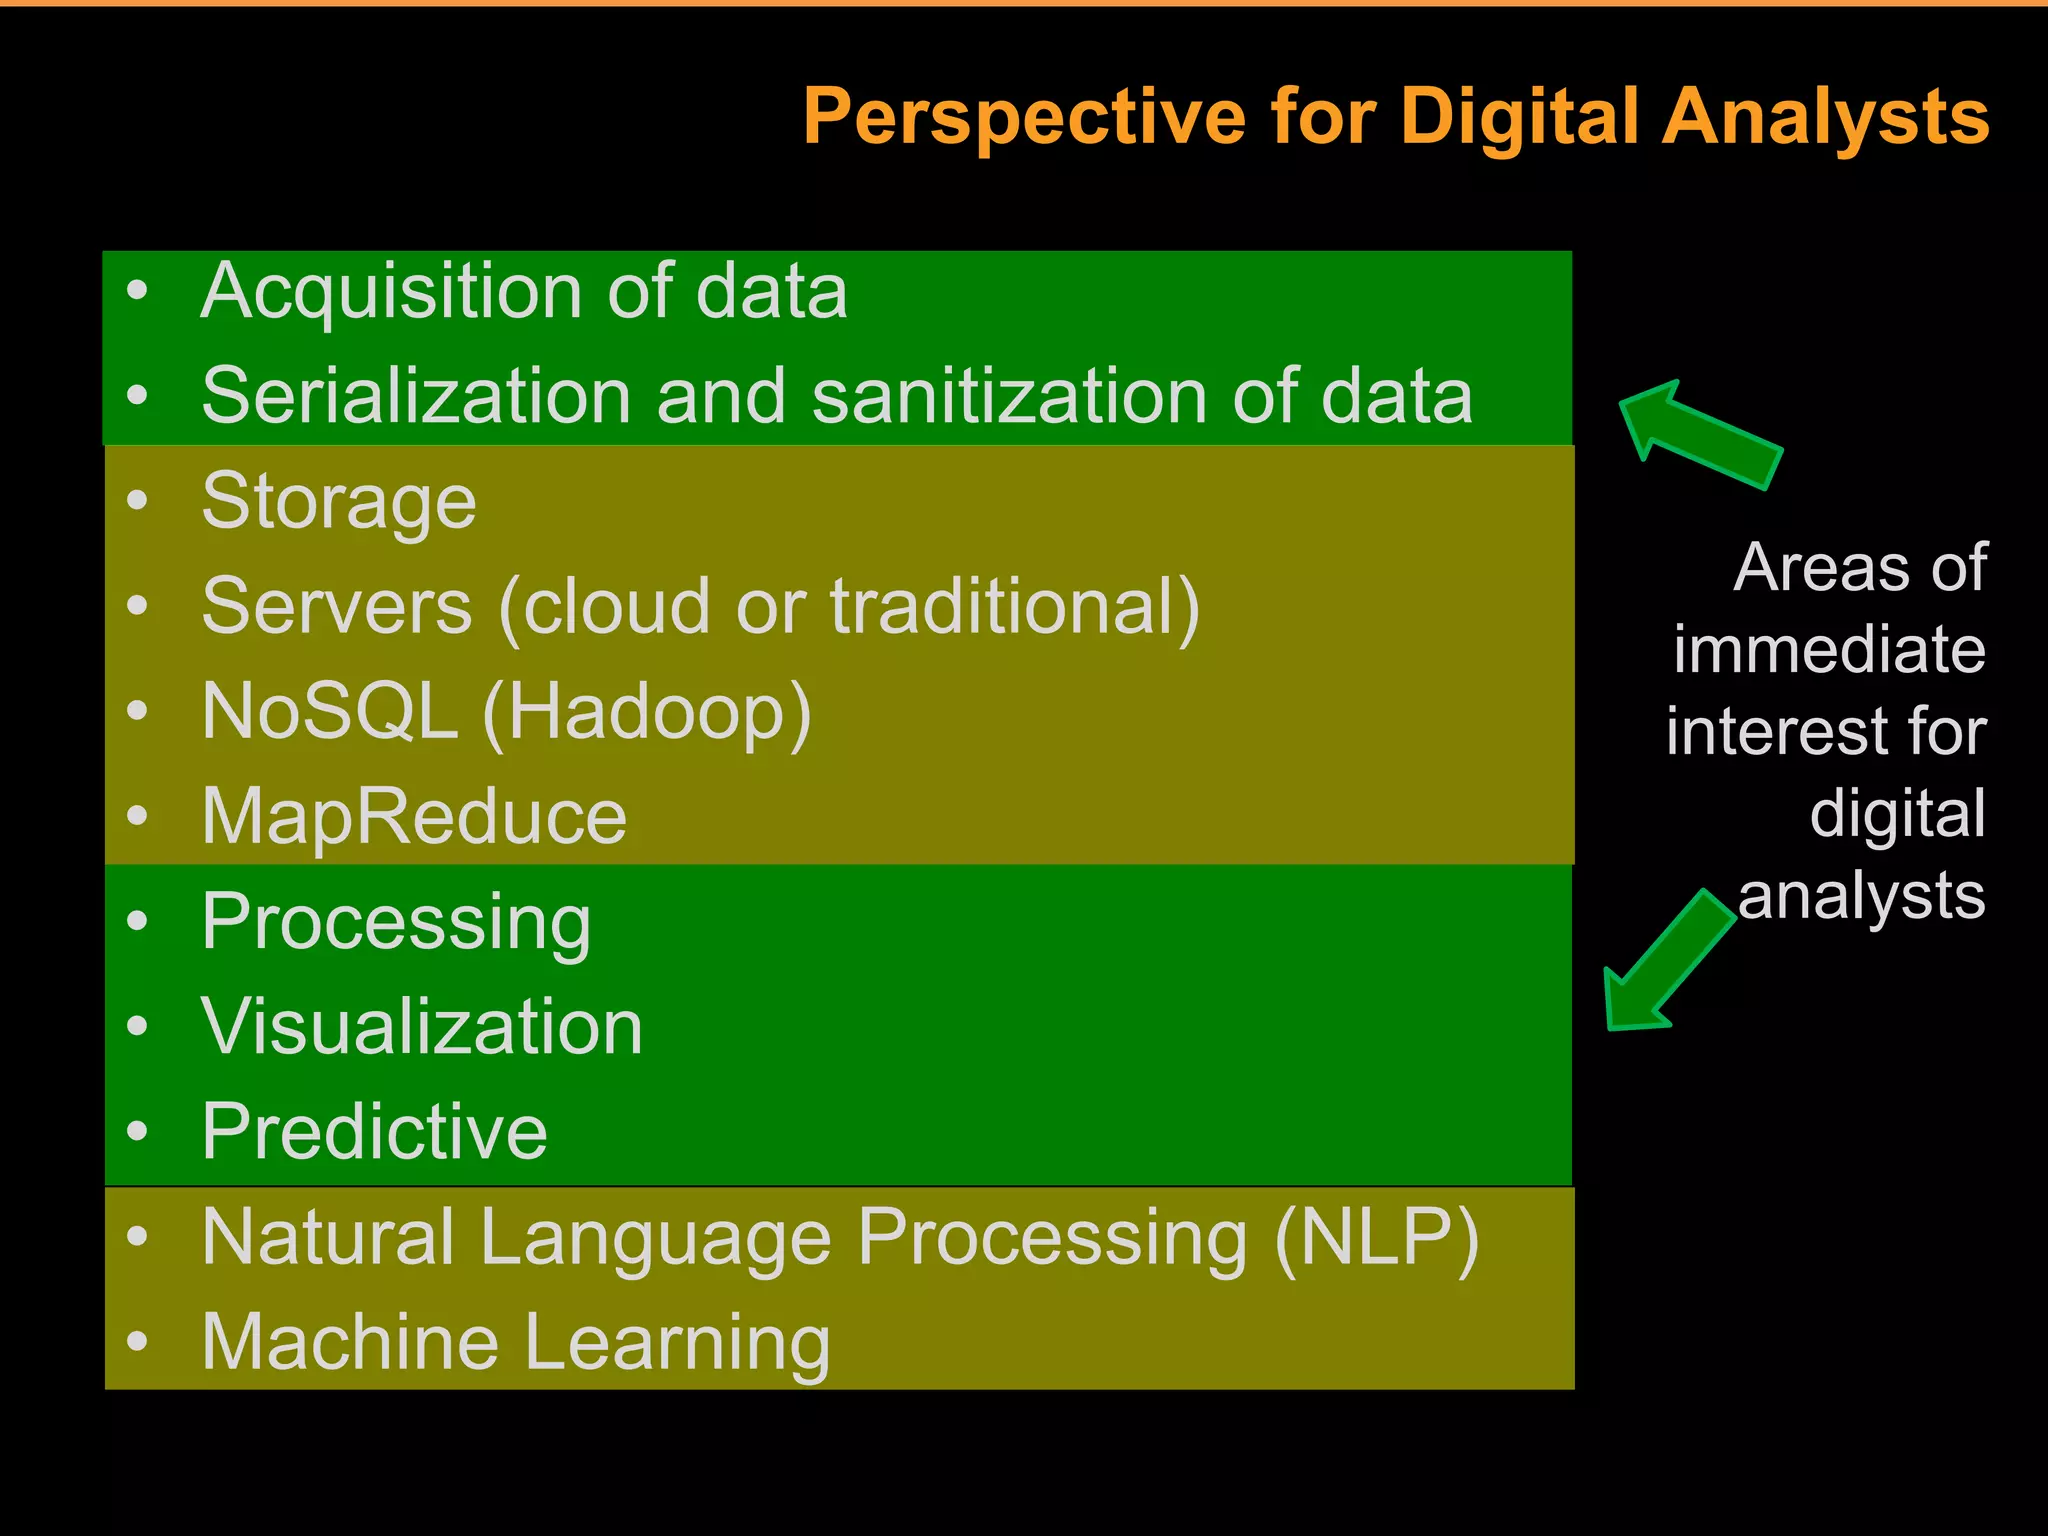
Big Data
What it Means for
the Future of the
  Digital Analyst
         @SHamelCP
Stéphane Hamel
Director of Strategic Services   Quebec City, QC, Canada
                                    Stephane Hamel
shamel@cardinalpath.com             @SHamelCP
Tel: 418-454-2637                www.CardinalPath.com
Hydro-Québec, circa 1992


@SHamelCP
Jan
            Feb
            Mar
            Apr
            May
            Jun
              Jul
            Aug
            Sep
            Oct
            Nov
            Dec


@SHamelCP
             Jan
            Feb
            Mar
            Apr
            May
            Jun
              Jul
            Aug
            Sep
            Oct
            Nov
            Dec
             Jan
            Feb
            Mar
            Apr
            May
            Jun
              Jul
            Aug
            Sep
            Oct
            Nov
            Dec
             Jan
            Feb
                                                        Big Data


                                       Business
                                        Intelligence


                     Web Analytics
BS   =
              BUZZWORDS
               SENTENCE


@SHamelCP
BIG DATA
            Volume
            Velocity
            Variety
            Variability, Veracity, Value…


@SHamelCP
It doesn’t fit in Excel!


                        VisiCalc, 1979
@SHamelCP       Apple II, 8k of memory
WHAT IS DIFFERENT?


@SHamelCP
Marketing
Front office
Decisional
Sampling & confidence
Adaptive…
Digital Analytics
                        Business Intelligence
                                             IT
                                    Back office
                                   Operational
                            Precise & accurate
                                        Slow…
   @SHamelCP
@SHamelCP
@SHamelCP
Data is the raw material of our craft.

  @SHamelCP
                     Photo credit: BRAD J. GOLDBERG, bradjgoldberg.com
ANALYTICS = Context +
                Data +
                Creativity


@SHamelCP
@SHamelCP
Extract-Transform-Load


             http://AnalyticsCanvas.com


@SHamelCP
http://TableauSoftware.com
@SHamelCP
@SHamelCP
Customer Value Modeling

        What are customers worth?
LTV » AR = SR ´ p + PR ´ (1- p)


@SHamelCP
Value tiers!

                          All add value: some are better investments than others

              60% of
             revenue                                   10%                  7%
                                 20%                                        10%
                                                                                      29% of
                                                                                    customers
                                                       16%
                                                                            12%
   Value Tier Quintiles


                                 20%
                                                       19%                  16%

                                 20%
                                                       22%
                                             Info retained                            71% of
                                                                                    customers
                                 20%                                        55%

                 40% of
                                                       33%
                revenue          20%


                             Total Revenue   Student Allocation of Student Allocation of
                           Total Revenue     Customer Allocation ofCustomer Allocation of
                                                 Potential Value
                                                Potential Value
                                                                        Actual Value
                                                                        Actual Value

@SHamelCP
What to do…


            Who are they?
    29%
            How can you attract more of them?


            Who are they?
    71%
            How much are you spending to acquire them?


@SHamelCP
Cheating churn
 Certain factors drives churn…
  Multivariate model used to measure factors influencing customer profile
                                                               Female
                                             Male
                                                                   Age (+)
                                                                                    Demo
                                                             Doctorate
                                                                Master
Bachelor
    Associate                                                                       Education
  Diploma
          Certificate
                                                         A
                                    Info retained   B
                                                               H
                                                    E                                Factors
                                                                    L
                                     X
                                                                   Zip Income (+)   Location
               Isolate the Value Targeting factors that can be used to
                           attract a higher value segments!

   @SHamelCP
Channel Marketing Efficiency Grid


                Channel Conversion               Use Value Targeting and shift spend from
                                                 inefficient Channels and go after
                                                 a higher value prospect

                                                 Bubble size represents number of
                                                 customers,, alumni, donor added by
                                                 channel.


               Info retained

Channel Life
 Time Value


                                     Feeder Channel


   @SHamelCP
@SHamelCP
WHAT ABOUT YOUR FUTURE?

                                      Business
                                                       Strategy
                                                       Goals


                      Provides:                                   Communicate:
            Actionable insight &                                  Business requirement &
             recommendations                                      objectives
                                       Analytics
                                      Center of
                                      Excellence

          Analysis                                                 Enabling Capabilities
                                                                     Technological capabilities &
     Statistical analysis
                                         Supply:                     constraints
       Problem solving
                                   Means, tools and data             Web development
      Synthesis of data
                                                                     Information architecture
Communication through
                                                                     User Experience
  reports & dashboards
                                                                     Instrumentation & BI

    @SHamelCP
NEXT STEPS


           Analytics = Context + Data + Creativity
           Small Data is readily available
           Cautious optimism
           Define your future!


@SHamelCP
bit.ly/oamm


@SHamelCP
Stéphane Hamel
Director of Strategic Services   Quebec City, QC, Canada
                                    Stephane Hamel
shamel@cardinalpath.com             @SHamelCP
Tel: 418-454-2637                www.CardinalPath.com
Additional info

Chime in at http://online-
behavior.com/analytics/big-data
Gartner Hype Cycle


Technology   Peak of Inflated      Trough of                           Slope of                        Plateau of
  Trigger     Expectations      Disillusionment                     Enlightenment                      Productivity

 @SHamelCP
                                                                                    A visualization of all the Hype Cycle data
                                                                                        January 26th, 2013 by Mark Raskino
                                http://blogs.gartner.com/hypecyclebook/2013/01/26/a-visualization-of-all-the-hype-cycle-data/
Attributes of “Big Data”
Big data spans three dimensions:
 Volume – Big data comes in one size: large. Enterprises are
   awash with data, easily amassing terabytes and even petabytes
   of information.
 Velocity – Often time-sensitive, big data must be used as it is
   streaming in to the enterprise in order to maximize its value to
   the business.
 Variety – Big data extends beyond structured data, including
   unstructured data of all varieties: text, audio, video, click
   streams, log files and more.

Bryan Smith of MSDN adds a forth “V”:
 Variability – Defined as the differing ways in which the data may
   be interpreted. Differing questions require differing
   interpretations.
Perspective for Digital Analysts

•   Acquisition of data
•   Serialization and sanitization of data
•   Storage
                                                Areas of
•   Servers (cloud or traditional)           immediate
•   NoSQL (Hadoop)                           interest for
•   MapReduce                                     digital
•   Processing                                  analysts
•   Visualization
•   Predictive
•   Natural Language Processing (NLP)
•   Machine Learning

Big Data: What it means for the future of the digital analyst

  • 1.
    Big Data What itMeans for the Future of the Digital Analyst @SHamelCP
  • 2.
    Stéphane Hamel Director ofStrategic Services Quebec City, QC, Canada Stephane Hamel shamel@cardinalpath.com @SHamelCP Tel: 418-454-2637 www.CardinalPath.com
  • 3.
  • 4.
    Jan Feb Mar Apr May Jun Jul Aug Sep Oct Nov Dec @SHamelCP Jan Feb Mar Apr May Jun Jul Aug Sep Oct Nov Dec Jan Feb Mar Apr May Jun Jul Aug Sep Oct Nov Dec Jan Feb  Big Data  Business Intelligence  Web Analytics
  • 5.
    BS = BUZZWORDS SENTENCE @SHamelCP
  • 6.
    BIG DATA Volume Velocity Variety Variability, Veracity, Value… @SHamelCP
  • 7.
    It doesn’t fitin Excel! VisiCalc, 1979 @SHamelCP Apple II, 8k of memory
  • 8.
  • 9.
    Marketing Front office Decisional Sampling &confidence Adaptive… Digital Analytics Business Intelligence IT Back office Operational Precise & accurate Slow… @SHamelCP
  • 10.
  • 11.
  • 12.
    Data is theraw material of our craft. @SHamelCP Photo credit: BRAD J. GOLDBERG, bradjgoldberg.com
  • 13.
    ANALYTICS = Context+ Data + Creativity @SHamelCP
  • 14.
  • 15.
    Extract-Transform-Load http://AnalyticsCanvas.com @SHamelCP
  • 16.
  • 17.
  • 18.
    Customer Value Modeling What are customers worth? LTV » AR = SR ´ p + PR ´ (1- p) @SHamelCP
  • 19.
    Value tiers! All add value: some are better investments than others 60% of revenue 10% 7% 20% 10% 29% of customers 16% 12% Value Tier Quintiles 20% 19% 16% 20% 22% Info retained 71% of customers 20% 55% 40% of 33% revenue 20% Total Revenue Student Allocation of Student Allocation of Total Revenue Customer Allocation ofCustomer Allocation of Potential Value Potential Value Actual Value Actual Value @SHamelCP
  • 20.
    What to do… Who are they? 29% How can you attract more of them? Who are they? 71% How much are you spending to acquire them? @SHamelCP
  • 21.
    Cheating churn Certainfactors drives churn… Multivariate model used to measure factors influencing customer profile Female Male Age (+) Demo Doctorate Master Bachelor Associate Education Diploma Certificate A Info retained B H E Factors L X Zip Income (+) Location Isolate the Value Targeting factors that can be used to attract a higher value segments! @SHamelCP
  • 22.
    Channel Marketing EfficiencyGrid Channel Conversion Use Value Targeting and shift spend from inefficient Channels and go after a higher value prospect Bubble size represents number of customers,, alumni, donor added by channel. Info retained Channel Life Time Value Feeder Channel @SHamelCP
  • 24.
  • 25.
    WHAT ABOUT YOURFUTURE? Business Strategy Goals Provides: Communicate: Actionable insight & Business requirement & recommendations objectives Analytics Center of Excellence Analysis Enabling Capabilities Technological capabilities & Statistical analysis Supply: constraints Problem solving Means, tools and data Web development Synthesis of data Information architecture Communication through User Experience reports & dashboards Instrumentation & BI @SHamelCP
  • 26.
    NEXT STEPS  Analytics = Context + Data + Creativity  Small Data is readily available  Cautious optimism  Define your future! @SHamelCP
  • 27.
  • 28.
    Stéphane Hamel Director ofStrategic Services Quebec City, QC, Canada Stephane Hamel shamel@cardinalpath.com @SHamelCP Tel: 418-454-2637 www.CardinalPath.com
  • 29.
    Additional info Chime inat http://online- behavior.com/analytics/big-data
  • 30.
    Gartner Hype Cycle Technology Peak of Inflated Trough of Slope of Plateau of Trigger Expectations Disillusionment Enlightenment Productivity @SHamelCP A visualization of all the Hype Cycle data January 26th, 2013 by Mark Raskino http://blogs.gartner.com/hypecyclebook/2013/01/26/a-visualization-of-all-the-hype-cycle-data/
  • 31.
    Attributes of “BigData” Big data spans three dimensions:  Volume – Big data comes in one size: large. Enterprises are awash with data, easily amassing terabytes and even petabytes of information.  Velocity – Often time-sensitive, big data must be used as it is streaming in to the enterprise in order to maximize its value to the business.  Variety – Big data extends beyond structured data, including unstructured data of all varieties: text, audio, video, click streams, log files and more. Bryan Smith of MSDN adds a forth “V”:  Variability – Defined as the differing ways in which the data may be interpreted. Differing questions require differing interpretations.
  • 32.
    Perspective for DigitalAnalysts • Acquisition of data • Serialization and sanitization of data • Storage Areas of • Servers (cloud or traditional) immediate • NoSQL (Hadoop) interest for • MapReduce digital • Processing analysts • Visualization • Predictive • Natural Language Processing (NLP) • Machine Learning

Editor's Notes

  • #2 http://www.google.com/trends/explore#q=business%20intelligence,%20web%20analytics,%20big%20data
  • #7 Typical definition of Big Data (by IBM) is Volume, Velocity, Variety – but add a 4th attribute: Variability (thanks to Bryan Smith from MSDN)Volume Big data comes in one size: large. Enterprises are awash with data, easily amassing terabytes and even petabytes of information.Velocity Often time-sensitive, big data must be used as it is streaming in to the enterprise in order to maximize its value to the business.VarietyBig data extends beyond structured data, including unstructured data of all varieties: text, audio, video, click streams, log files and more.Variability Defined as the differing ways in which the data may be interpreted. Differing questions require differing interpretations.
  • #8 There’s a big chasm when shifting from Excel to the next level.Small Data is fundamentally the same as Visicalc… invented nearly 35 years ago!
  • #9 BI is about back office – the roots we don’t see but supports the whole business.Web analytics used to be only about the front end, what is visible, how people interact with the business.But there was an obvious growing necessity to also connect to the back office.
  • #11 In the pre-big data era, statistical science was necessary to make up for the inherent limitations of incomplete data samples. Statisticians and scientists were forced to cleanse, hypothesize, sample, model, and analyze data to arrive at contingent.Big Data becomes akin more to a problem in algorithm and architecture design than one of learning and quantifying uncertain knowledge using statistical science.(Too Big to Ignore, Deloitereview.com)Most important skills:Understanding (and helping to articulate) an organization’s question, problems or strategic challenge and then translating them into the design of one or more data analysis projectBetter to have an approximate answer to the right question than a precise answer to the wrong question (John Tukey)Creation of innovative “data features”
  • #12 As rich and detailed as practical given the business context
  • #19 VO: Case specific, Heavy math. Tough Stuff. Elegantly complex. Beautifully simple. What does it mean? Huge opportunity.There are many different calculations and approaches.  Basically it is about understanding a customer's potential value (can you change from students to customers,  we can make it more anonymous), and likilihood that they will meet that potential (churn).
  • #20 Customer potential value starts off with a fairly even distribution that skews to a base of lower value customersAs churn begins, many potentially higher value customer drop out causing a very skewed value distributionUsing all back office data to do this.  We create 5 quintiles of total & potential revenue and see how many customers account for each quintile.  Purpose here is to understand how there are some customers that are just so much more value than others.  Many factors cause this to occur and the departure from potential to actual is churn at play.Total revenue is literally adding up all revenue and dividing by 5.  100 million in revenue makes 20 million buckets.  We do this for actual and potential revenue.  Potential is estimated based on customer behavior.  Actual comes from the cash register.The next 2 columns are the % of students that align to each 20 million bucket.  You will see from a potential perspective there are more customers that could drive a higher value but churn occurs and that is why the actual bar is more skewed.Another explanation is that there are some customers that have a potential of spending 100 dollars but due to churn they only spend 40.  That is why the bar charts change from potential to actual.Also,  Potential is twice as big as actual in this case.  50% of revenue is lost.  
  • #23 There is no automatic, purely algorithmic way to extract the right islands of information from oceans of raw dataIt requires a combination of domain knowledge, creativity, critical thinking, an understanding of statistical reasoning, and the ability to visualize and program with data(Putting the science in data science – deloitereview.com)
  • #24 “A wealth of information creates a poverty of attention” (Herbert Simon, quoted in deloitereview.com)“Analytics initiatives ultimately do not begin with data: with clearly articulated problems to be addressed and opportunities to be pursued. More data does not guarantee better decisions”
  • #25 2-5 yearsSource: http://www.gartner.com/newsroom/id/2124315