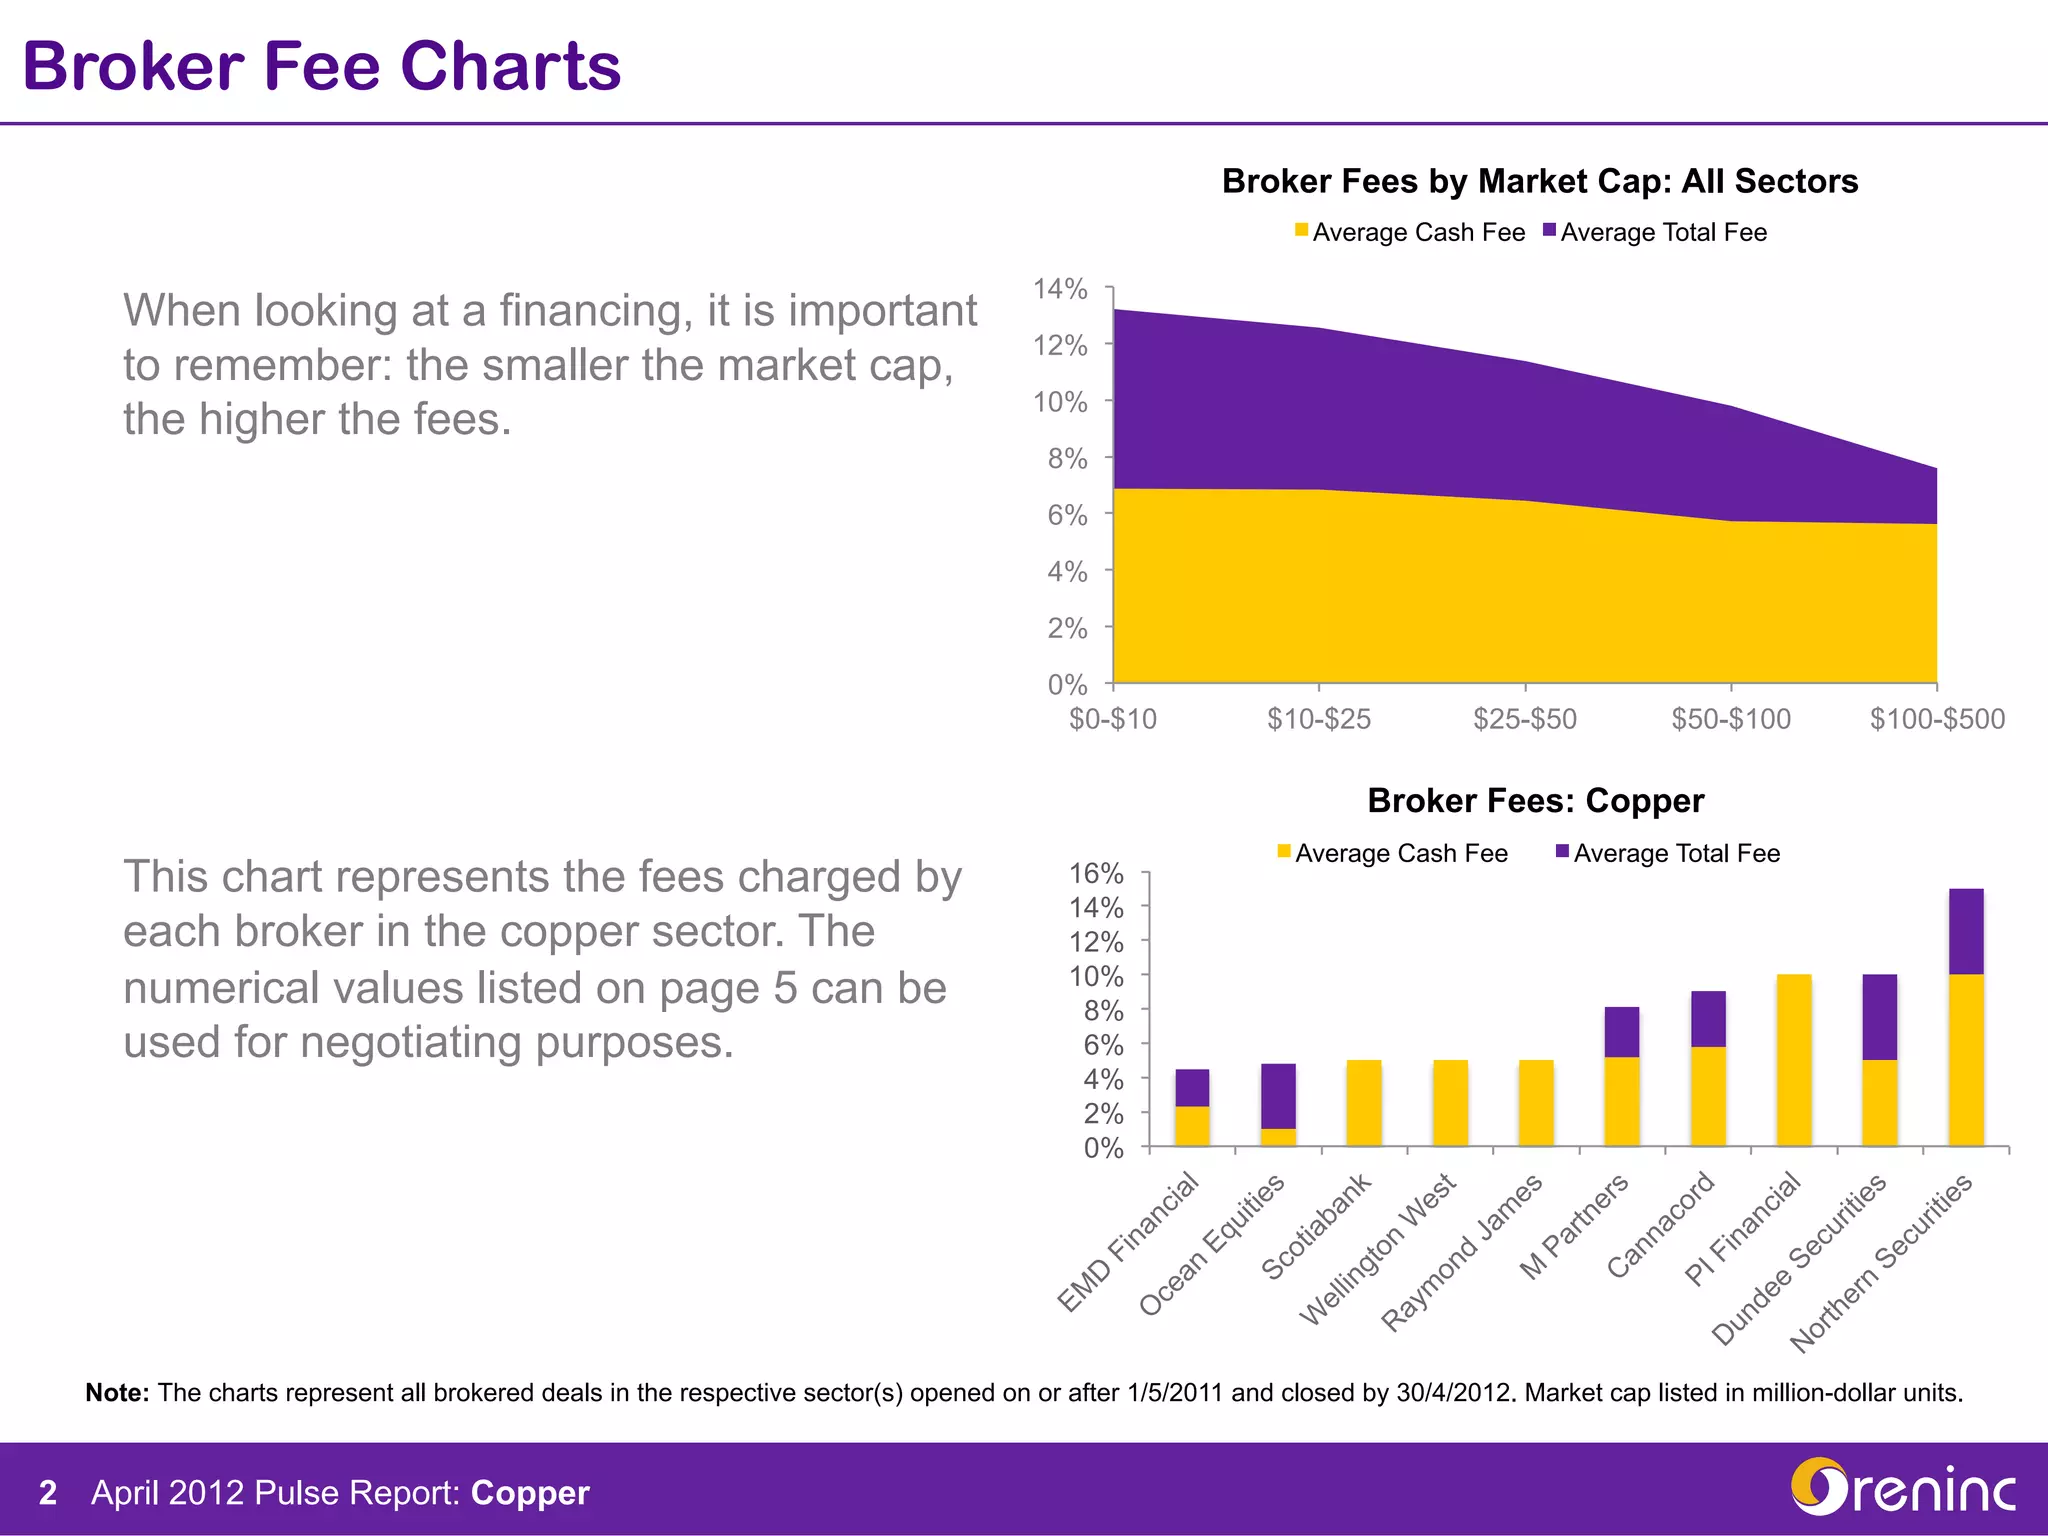
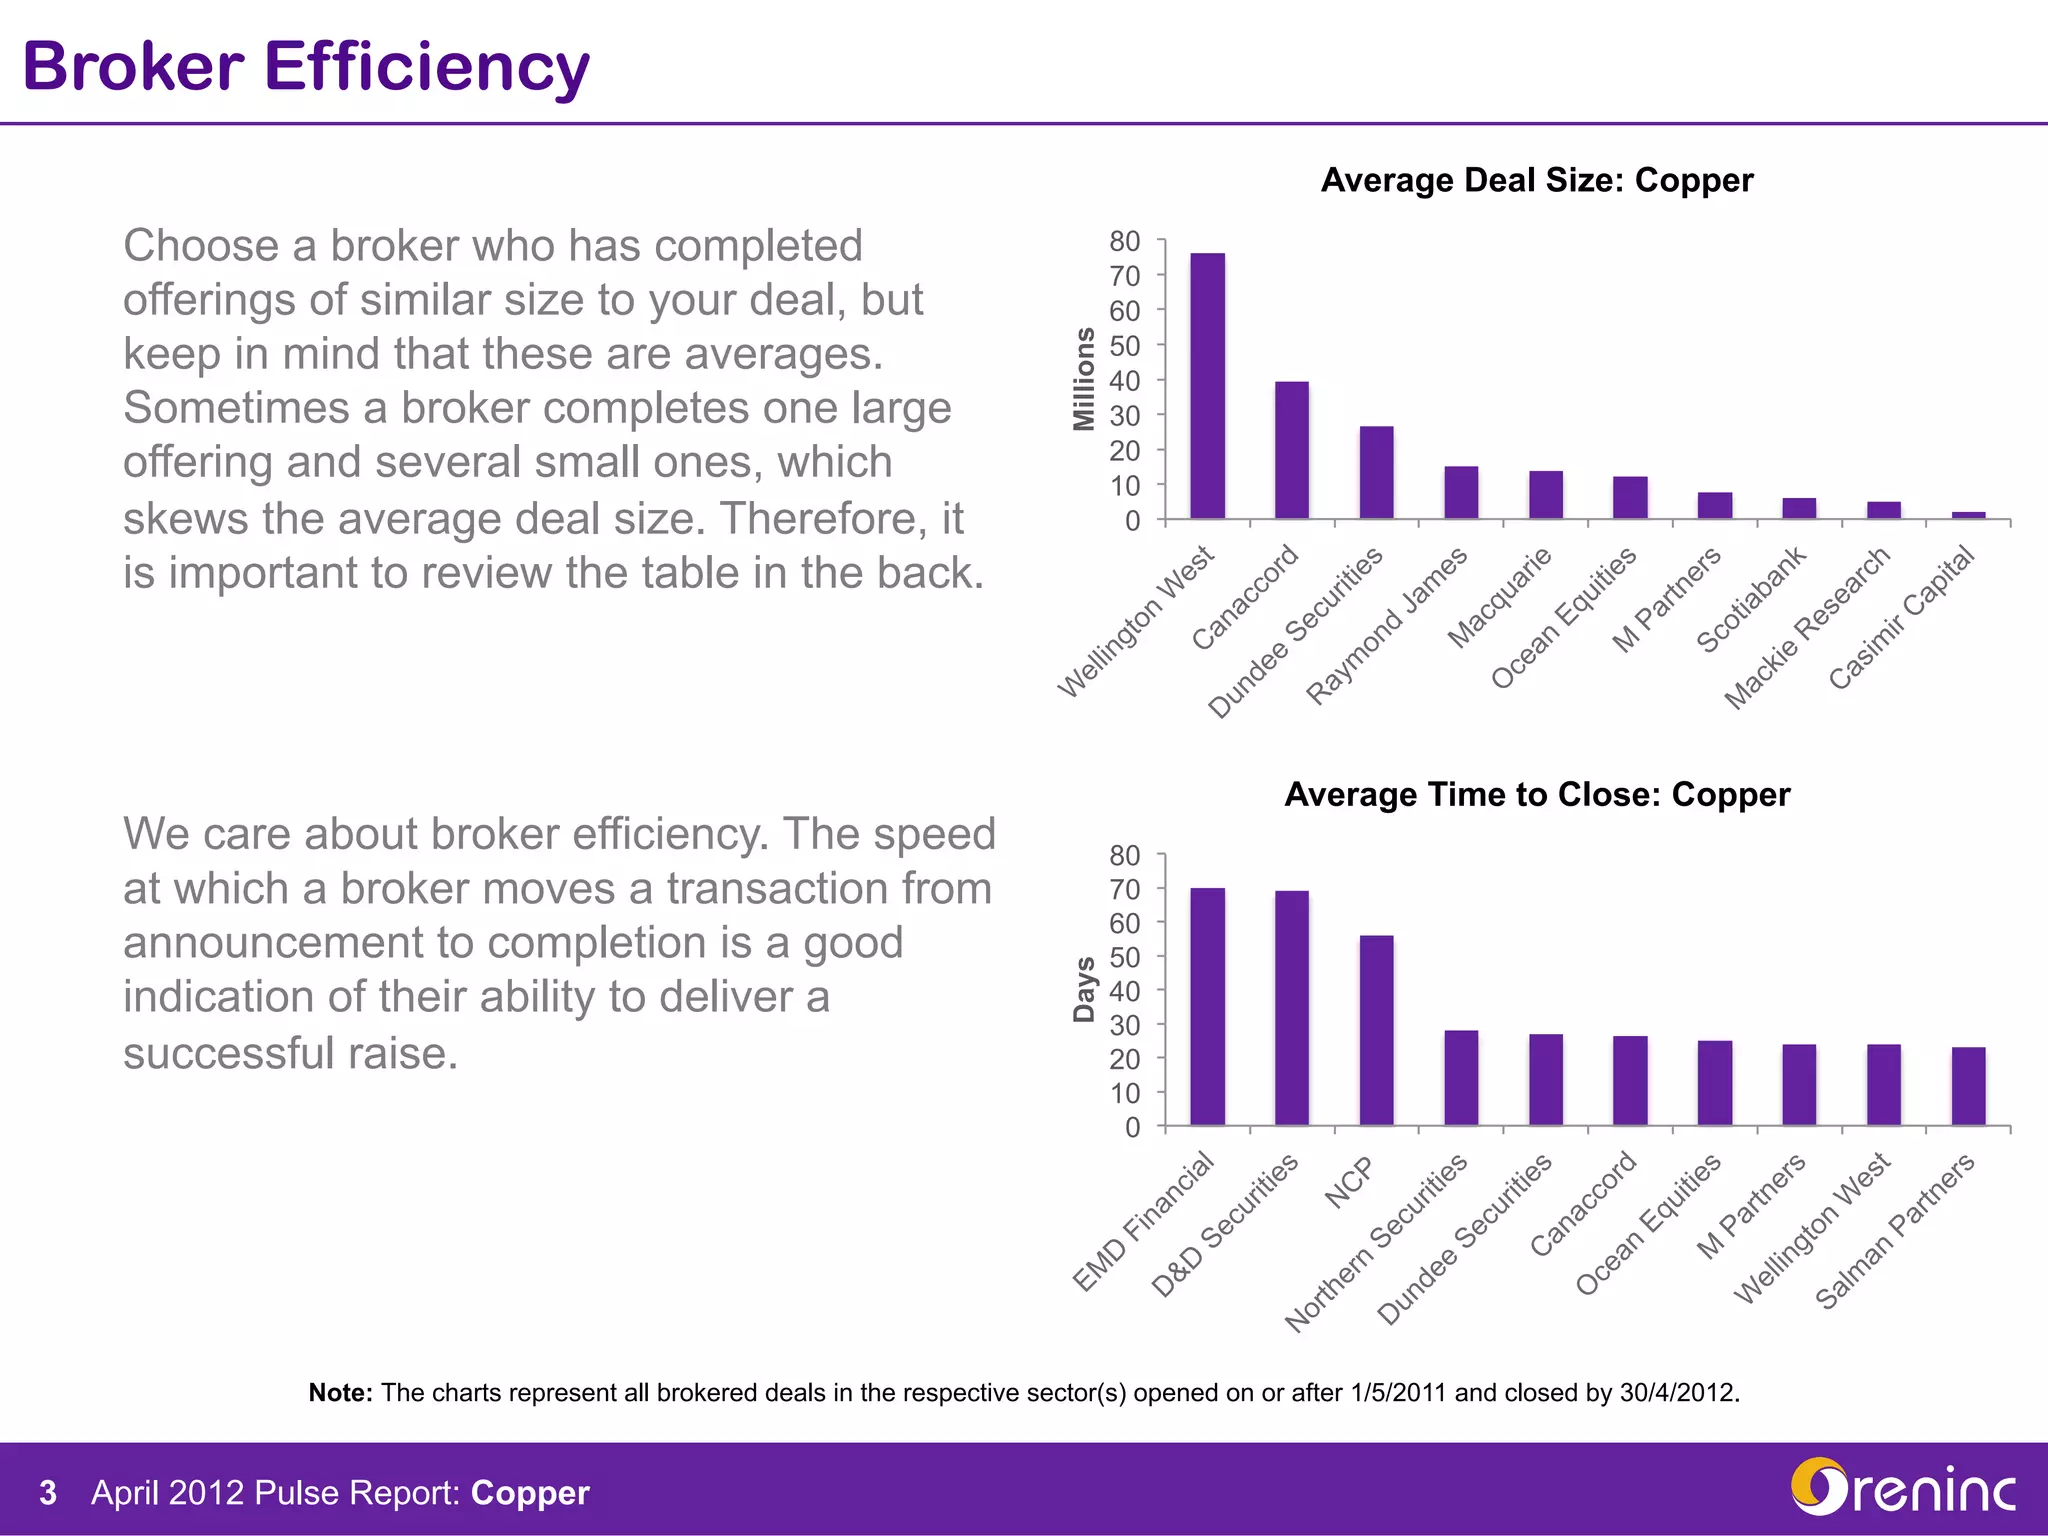
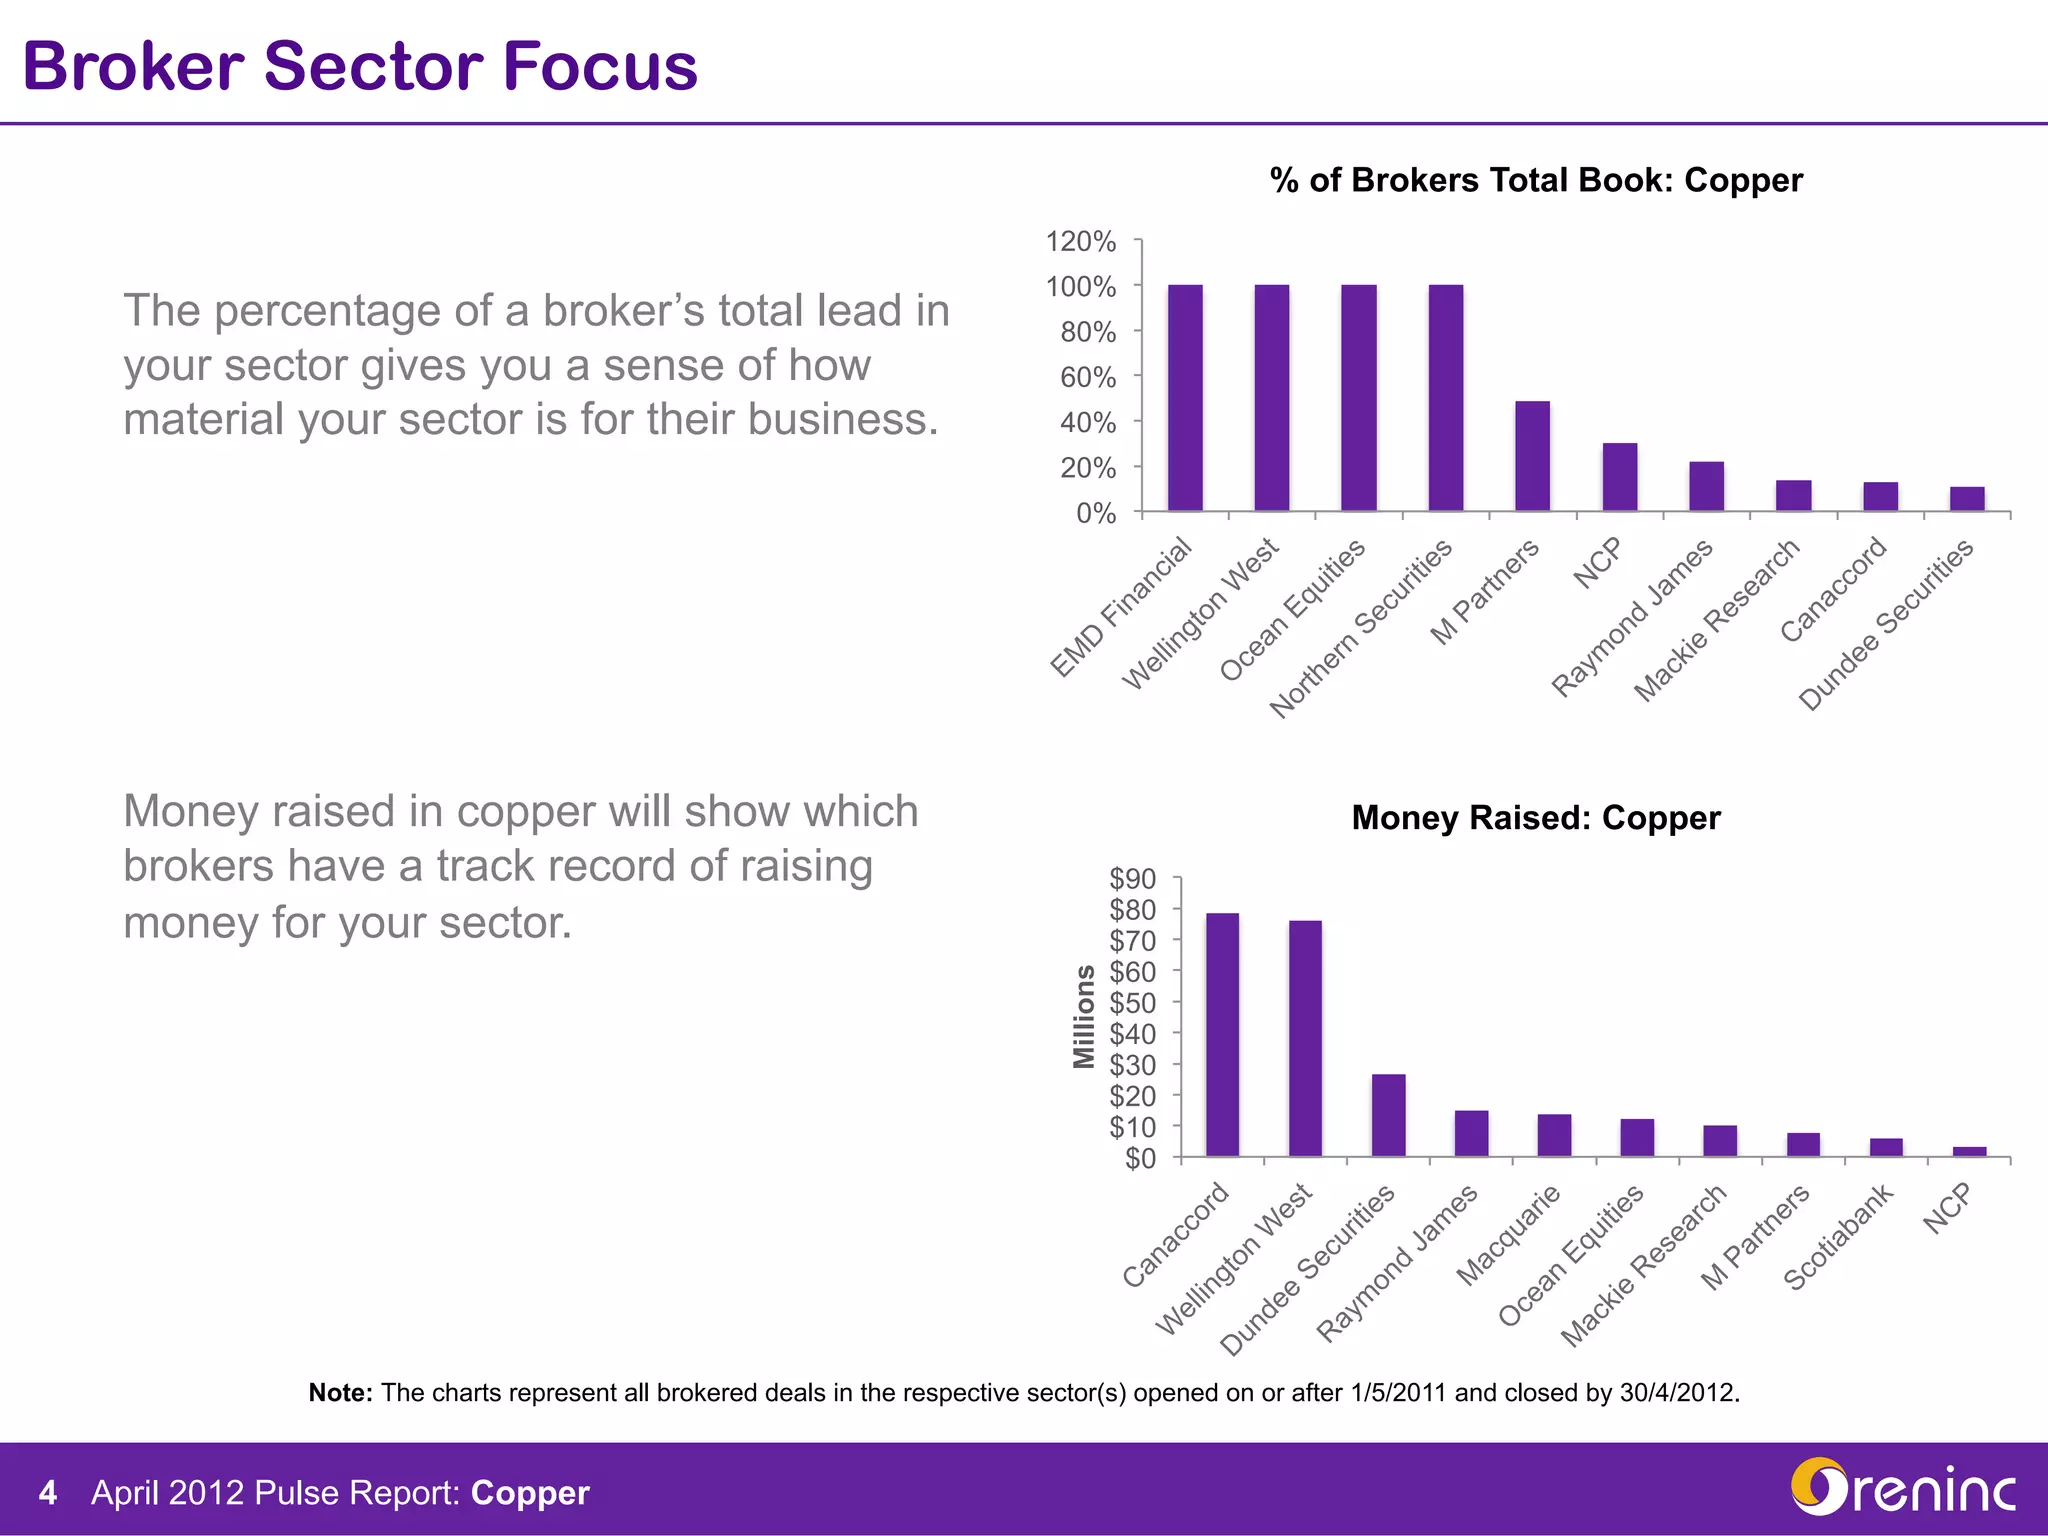
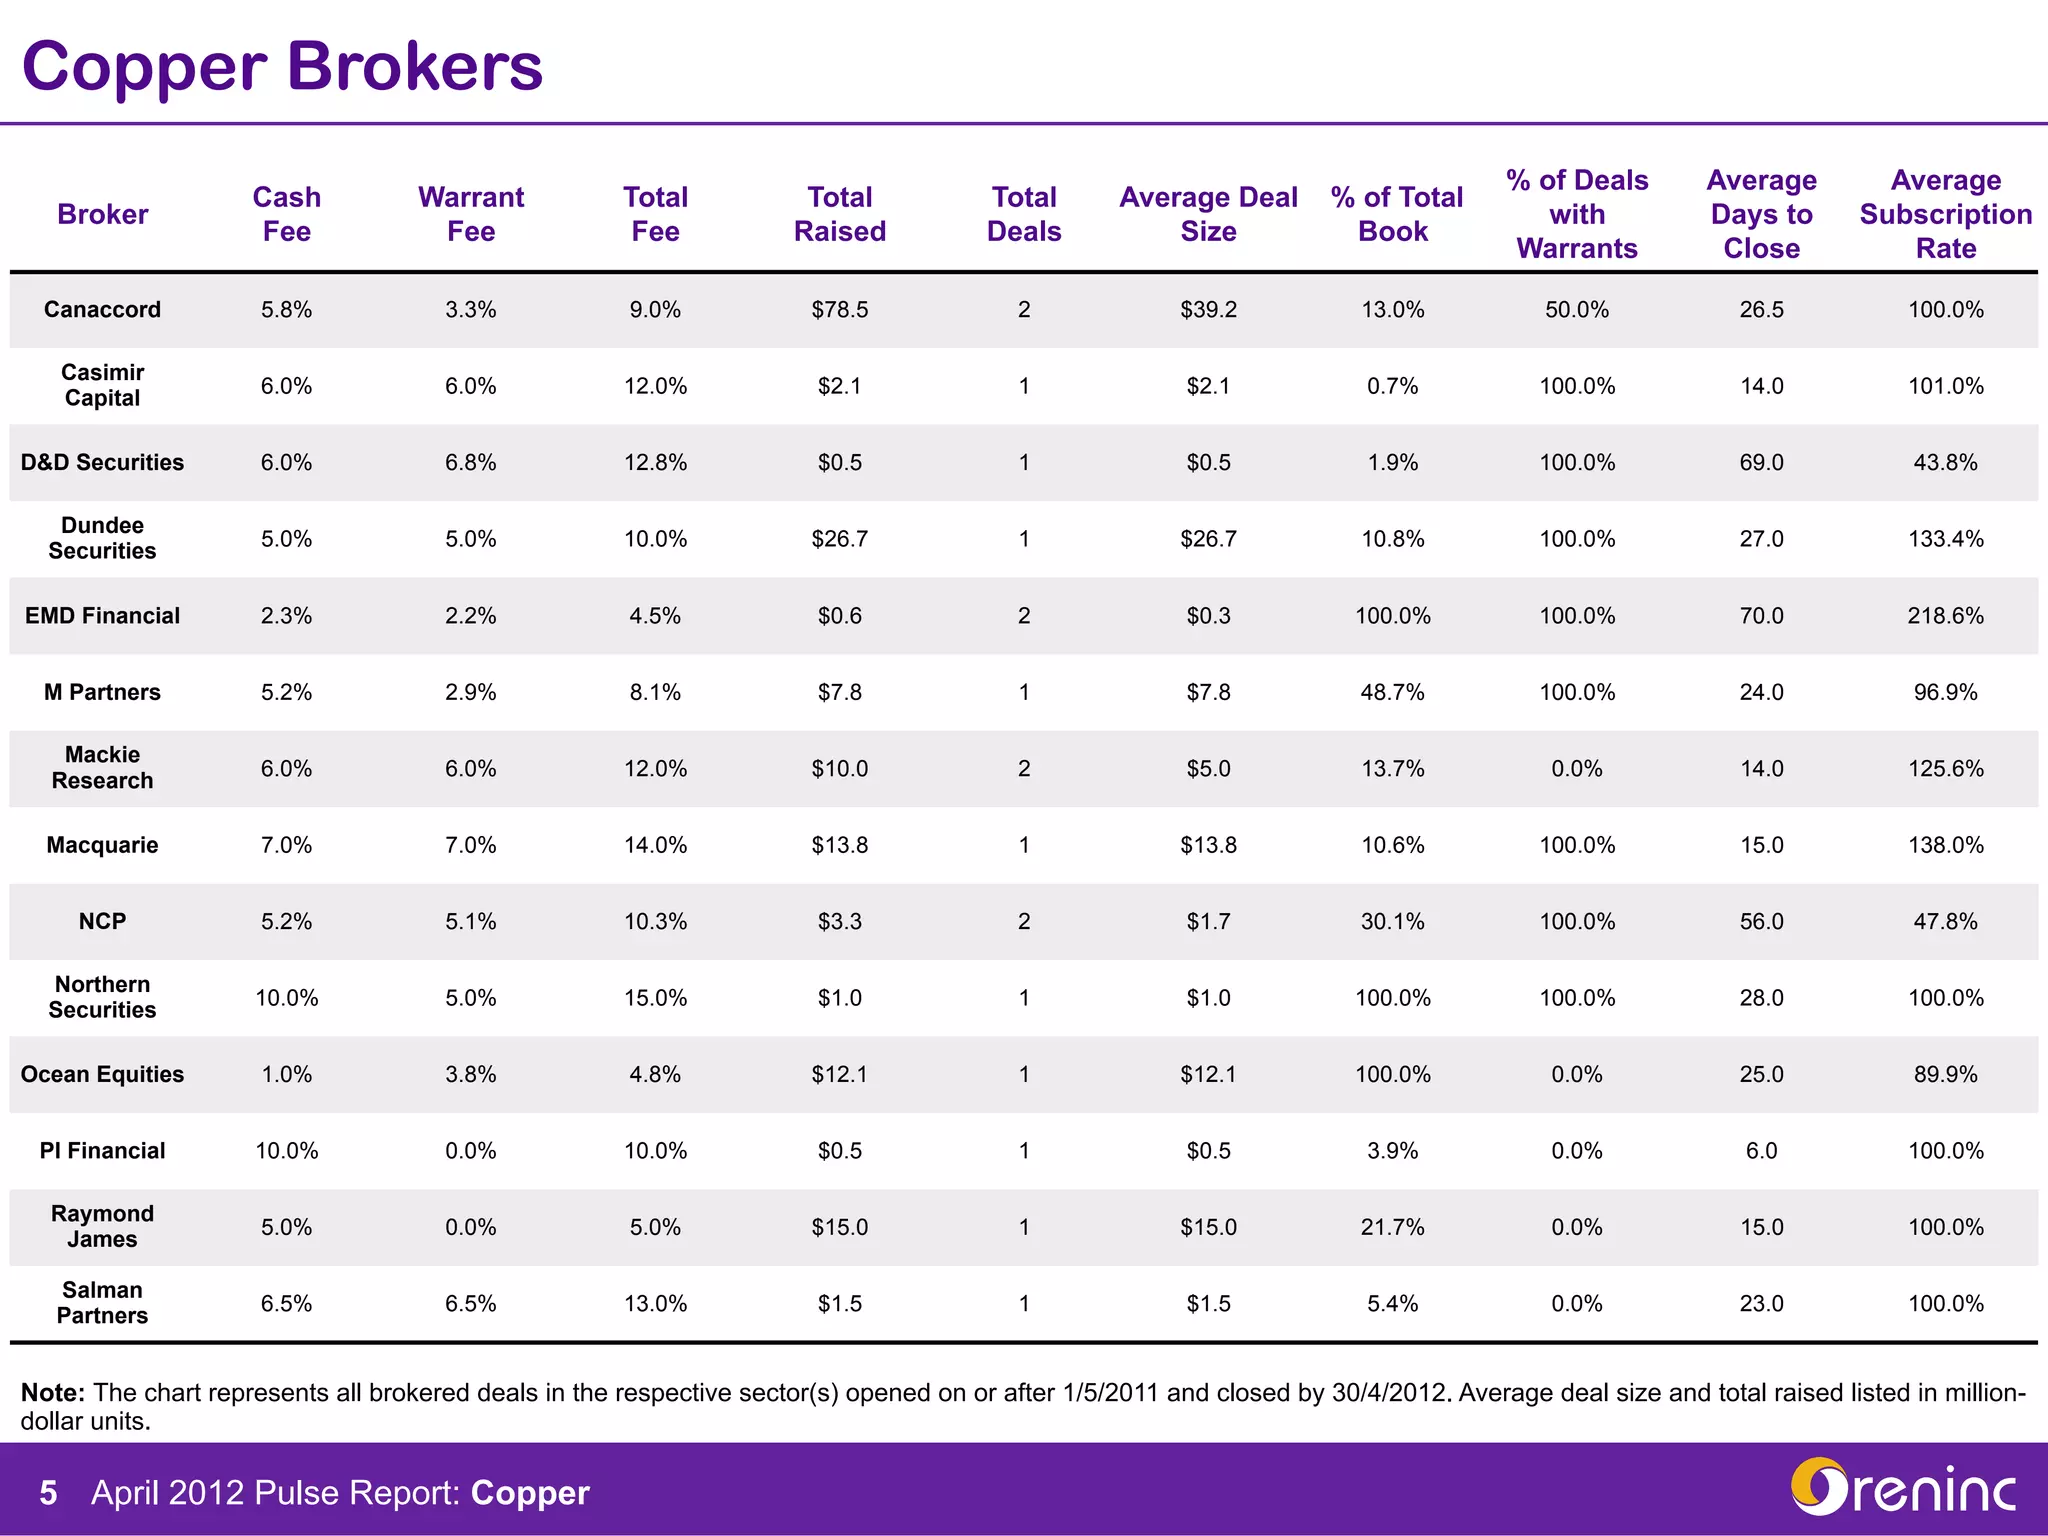
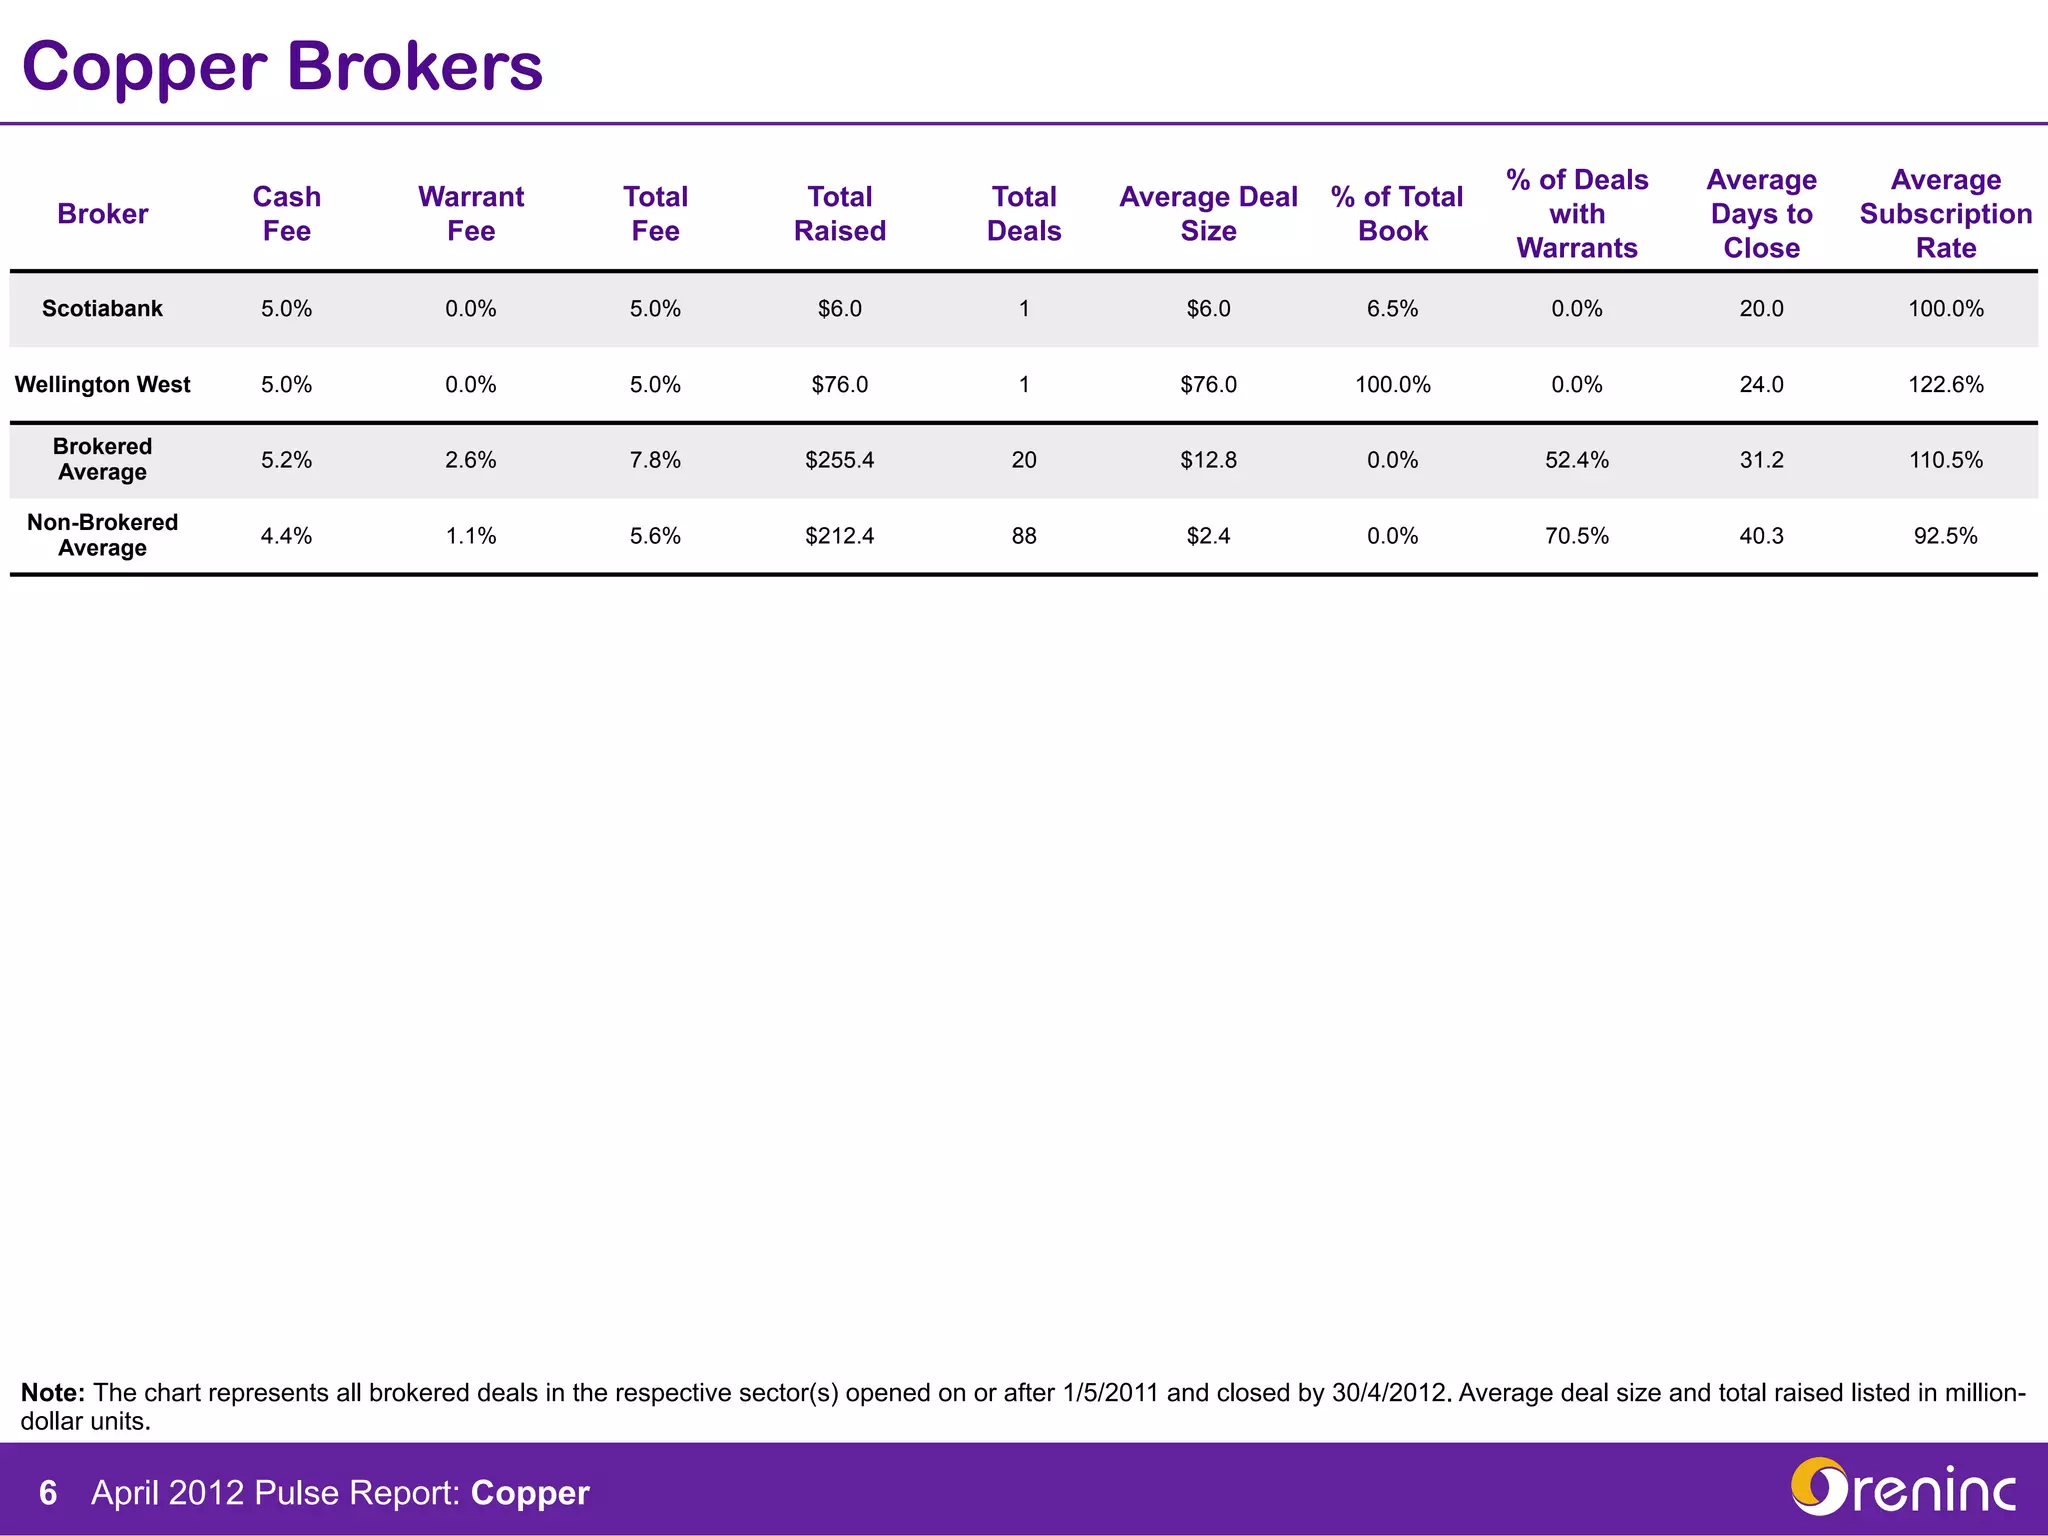
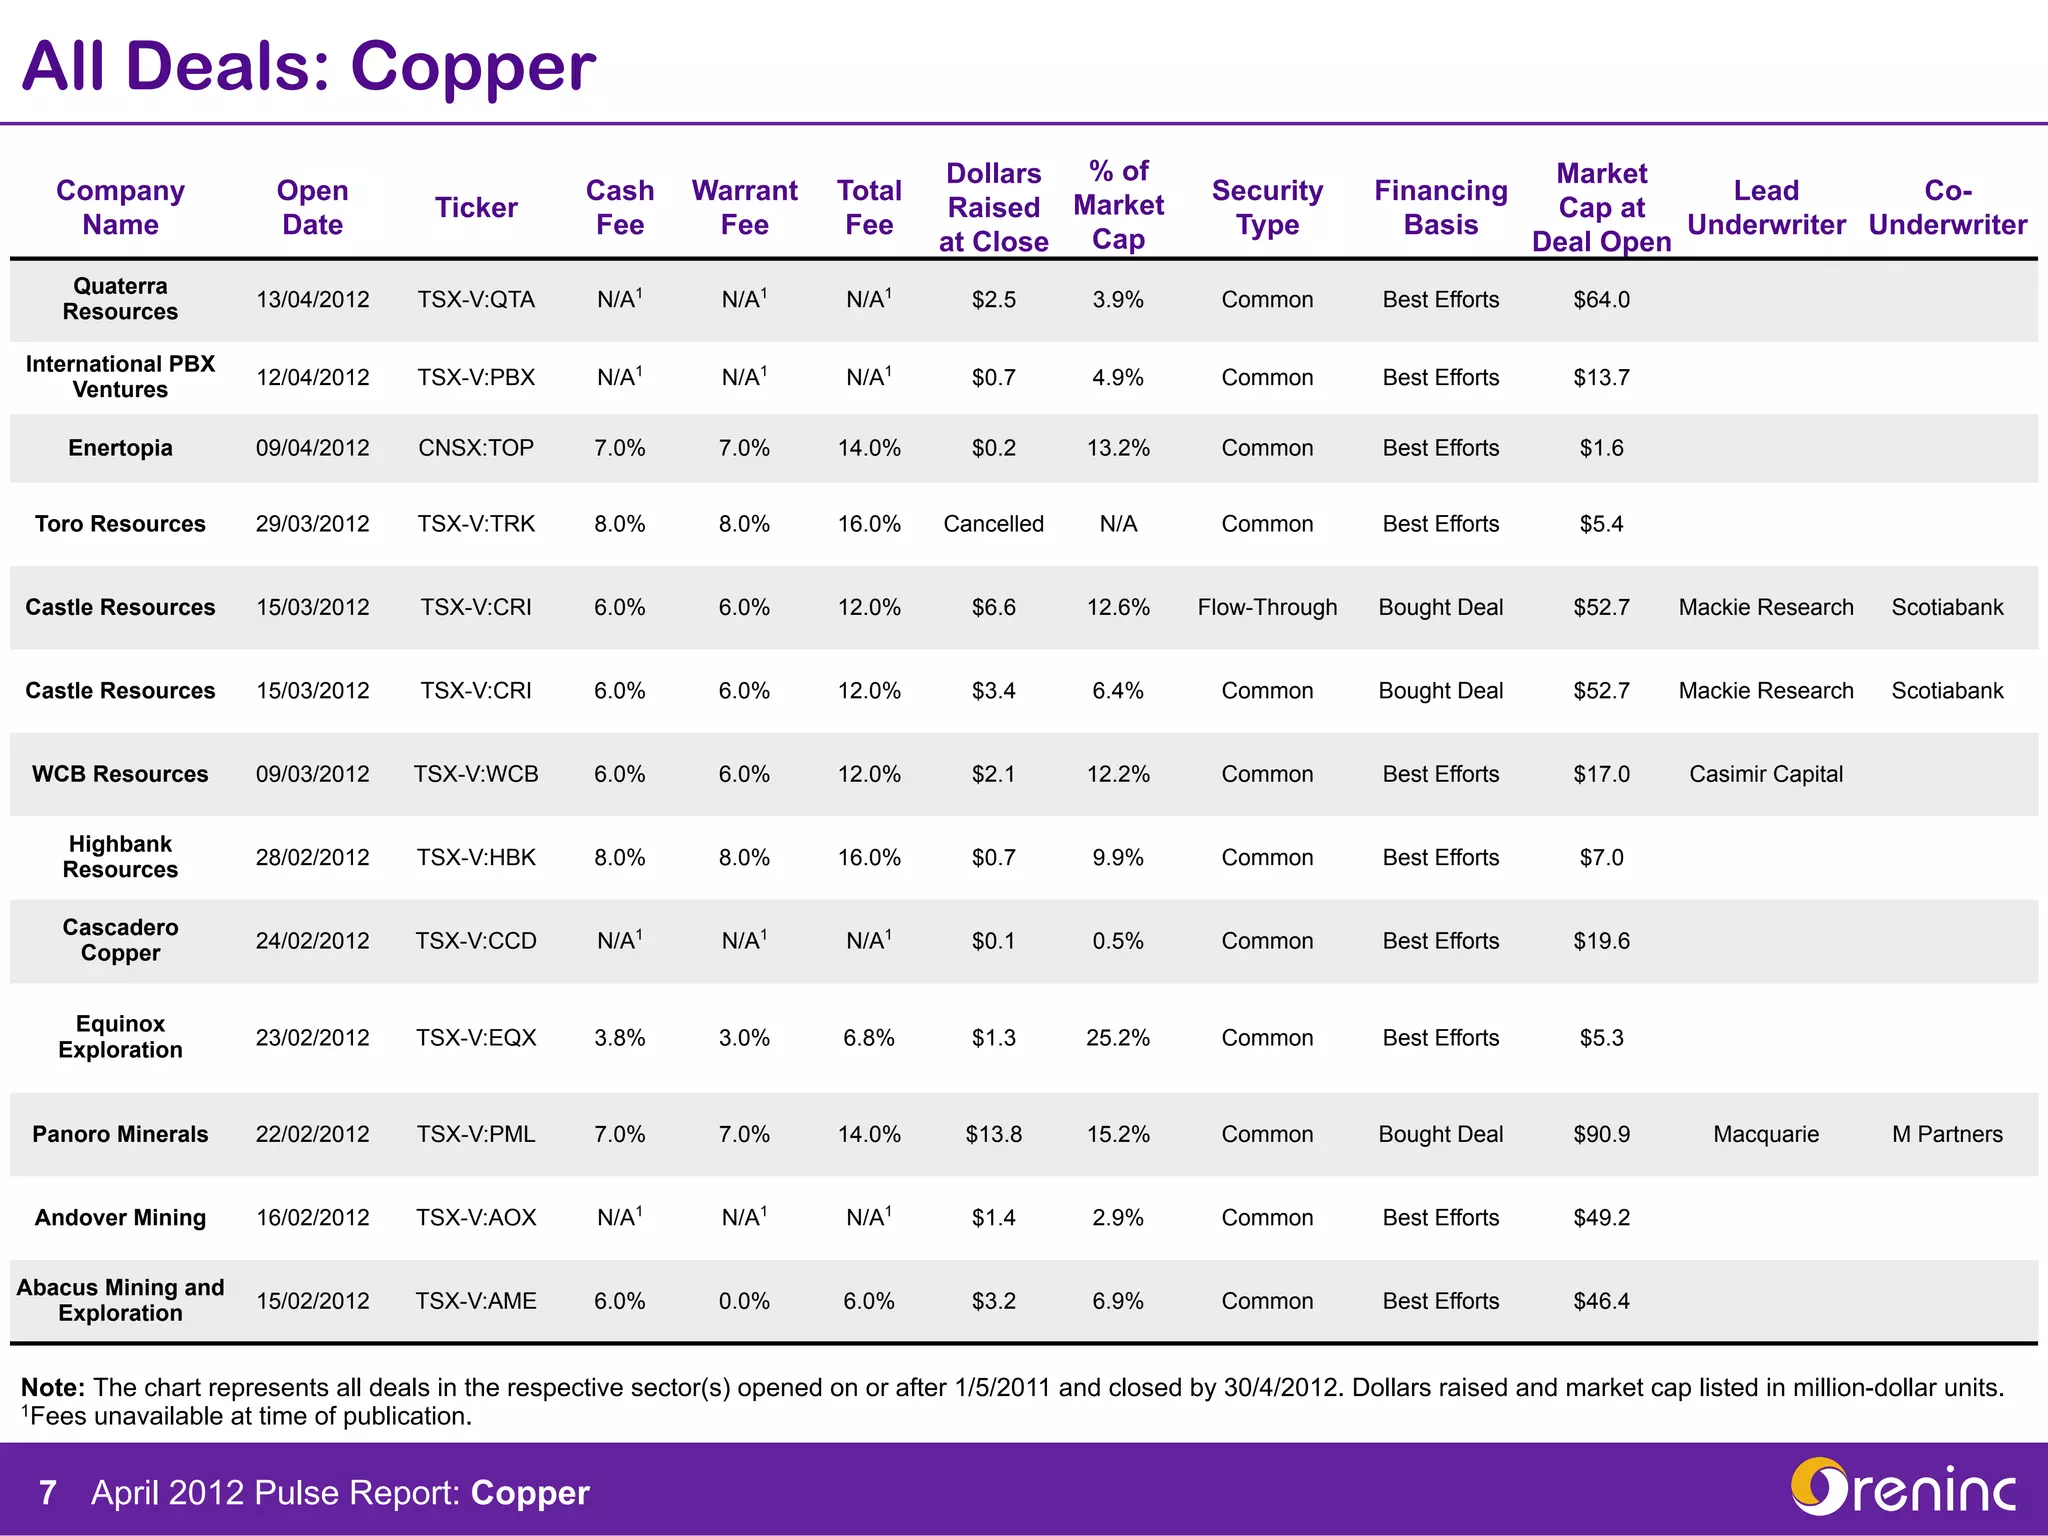
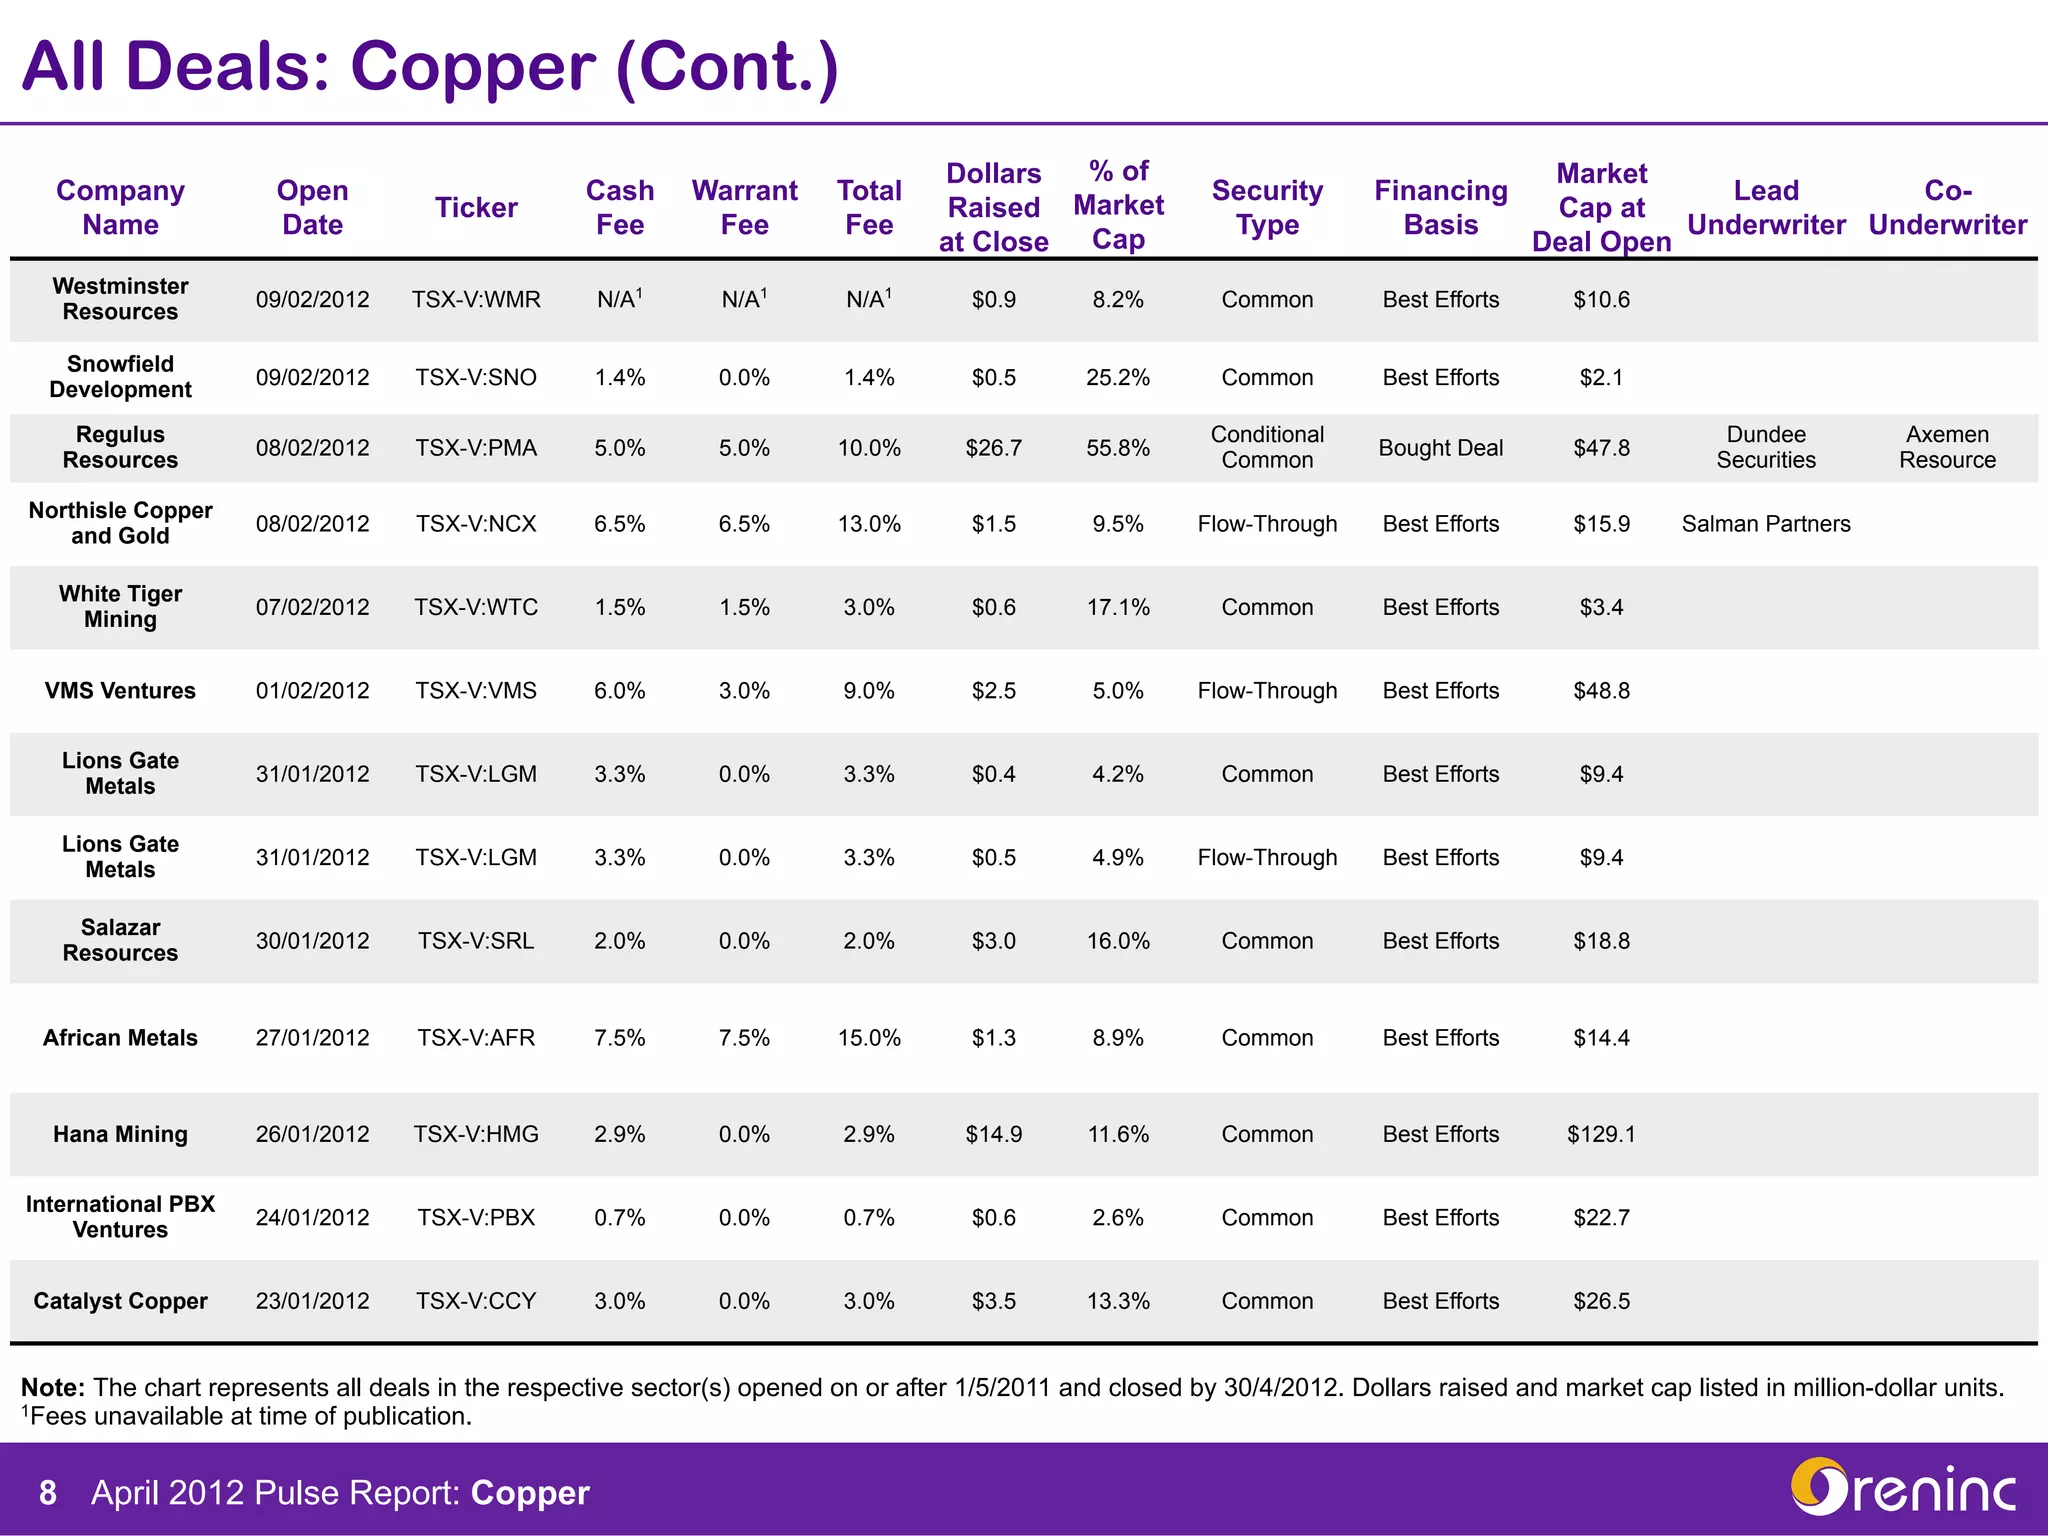
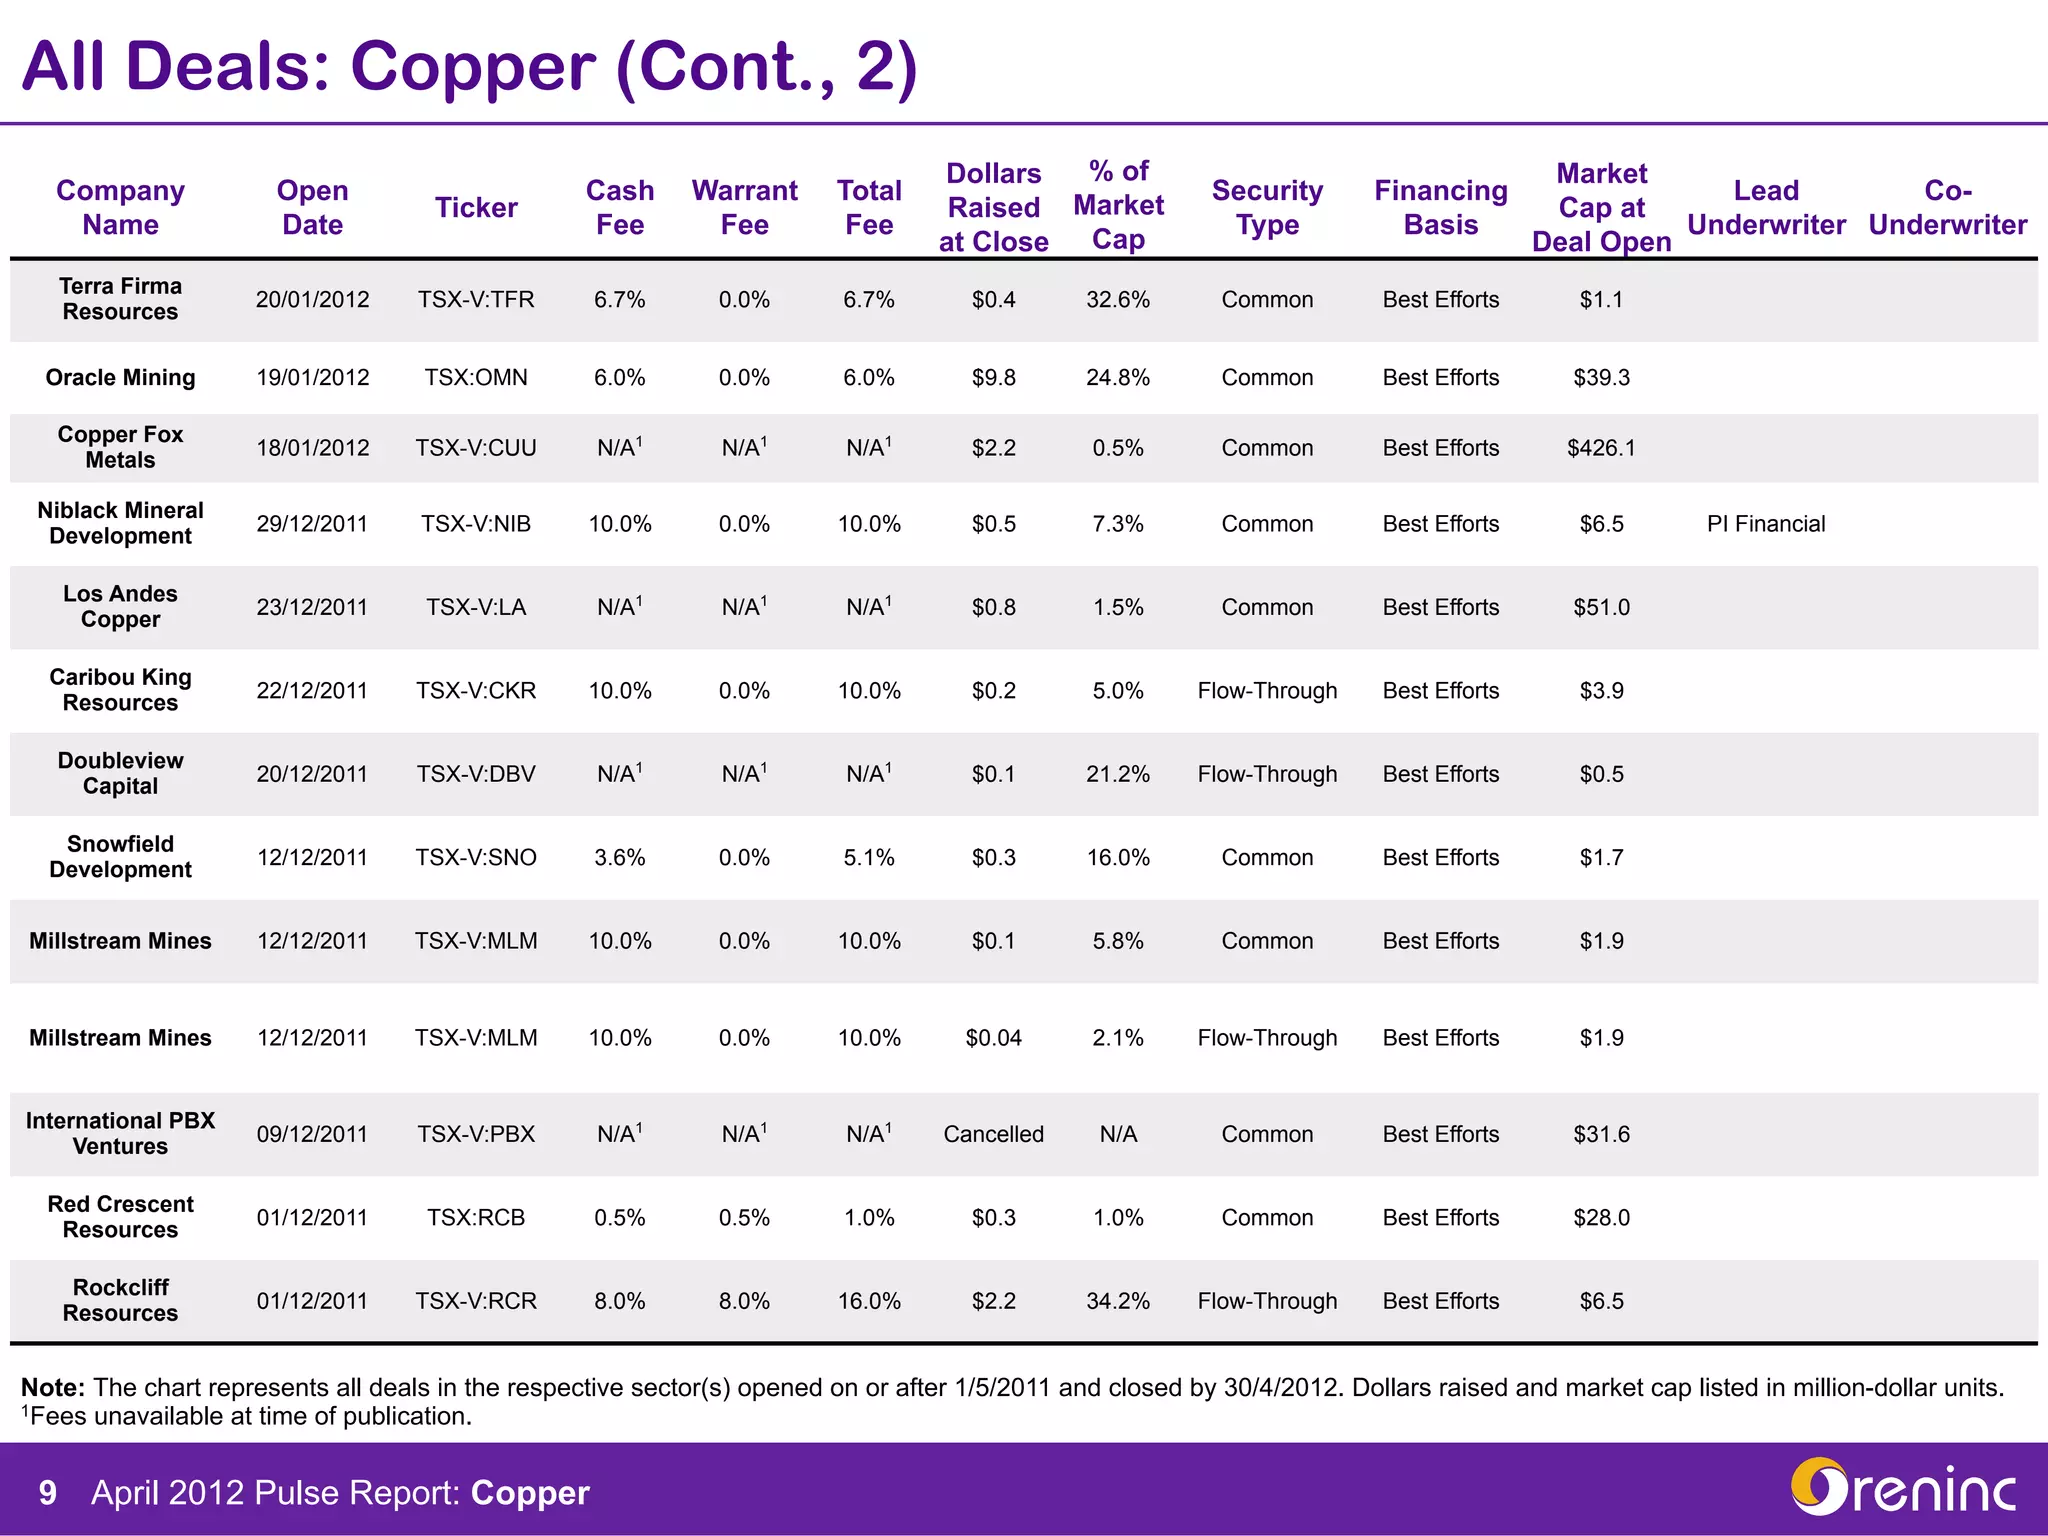
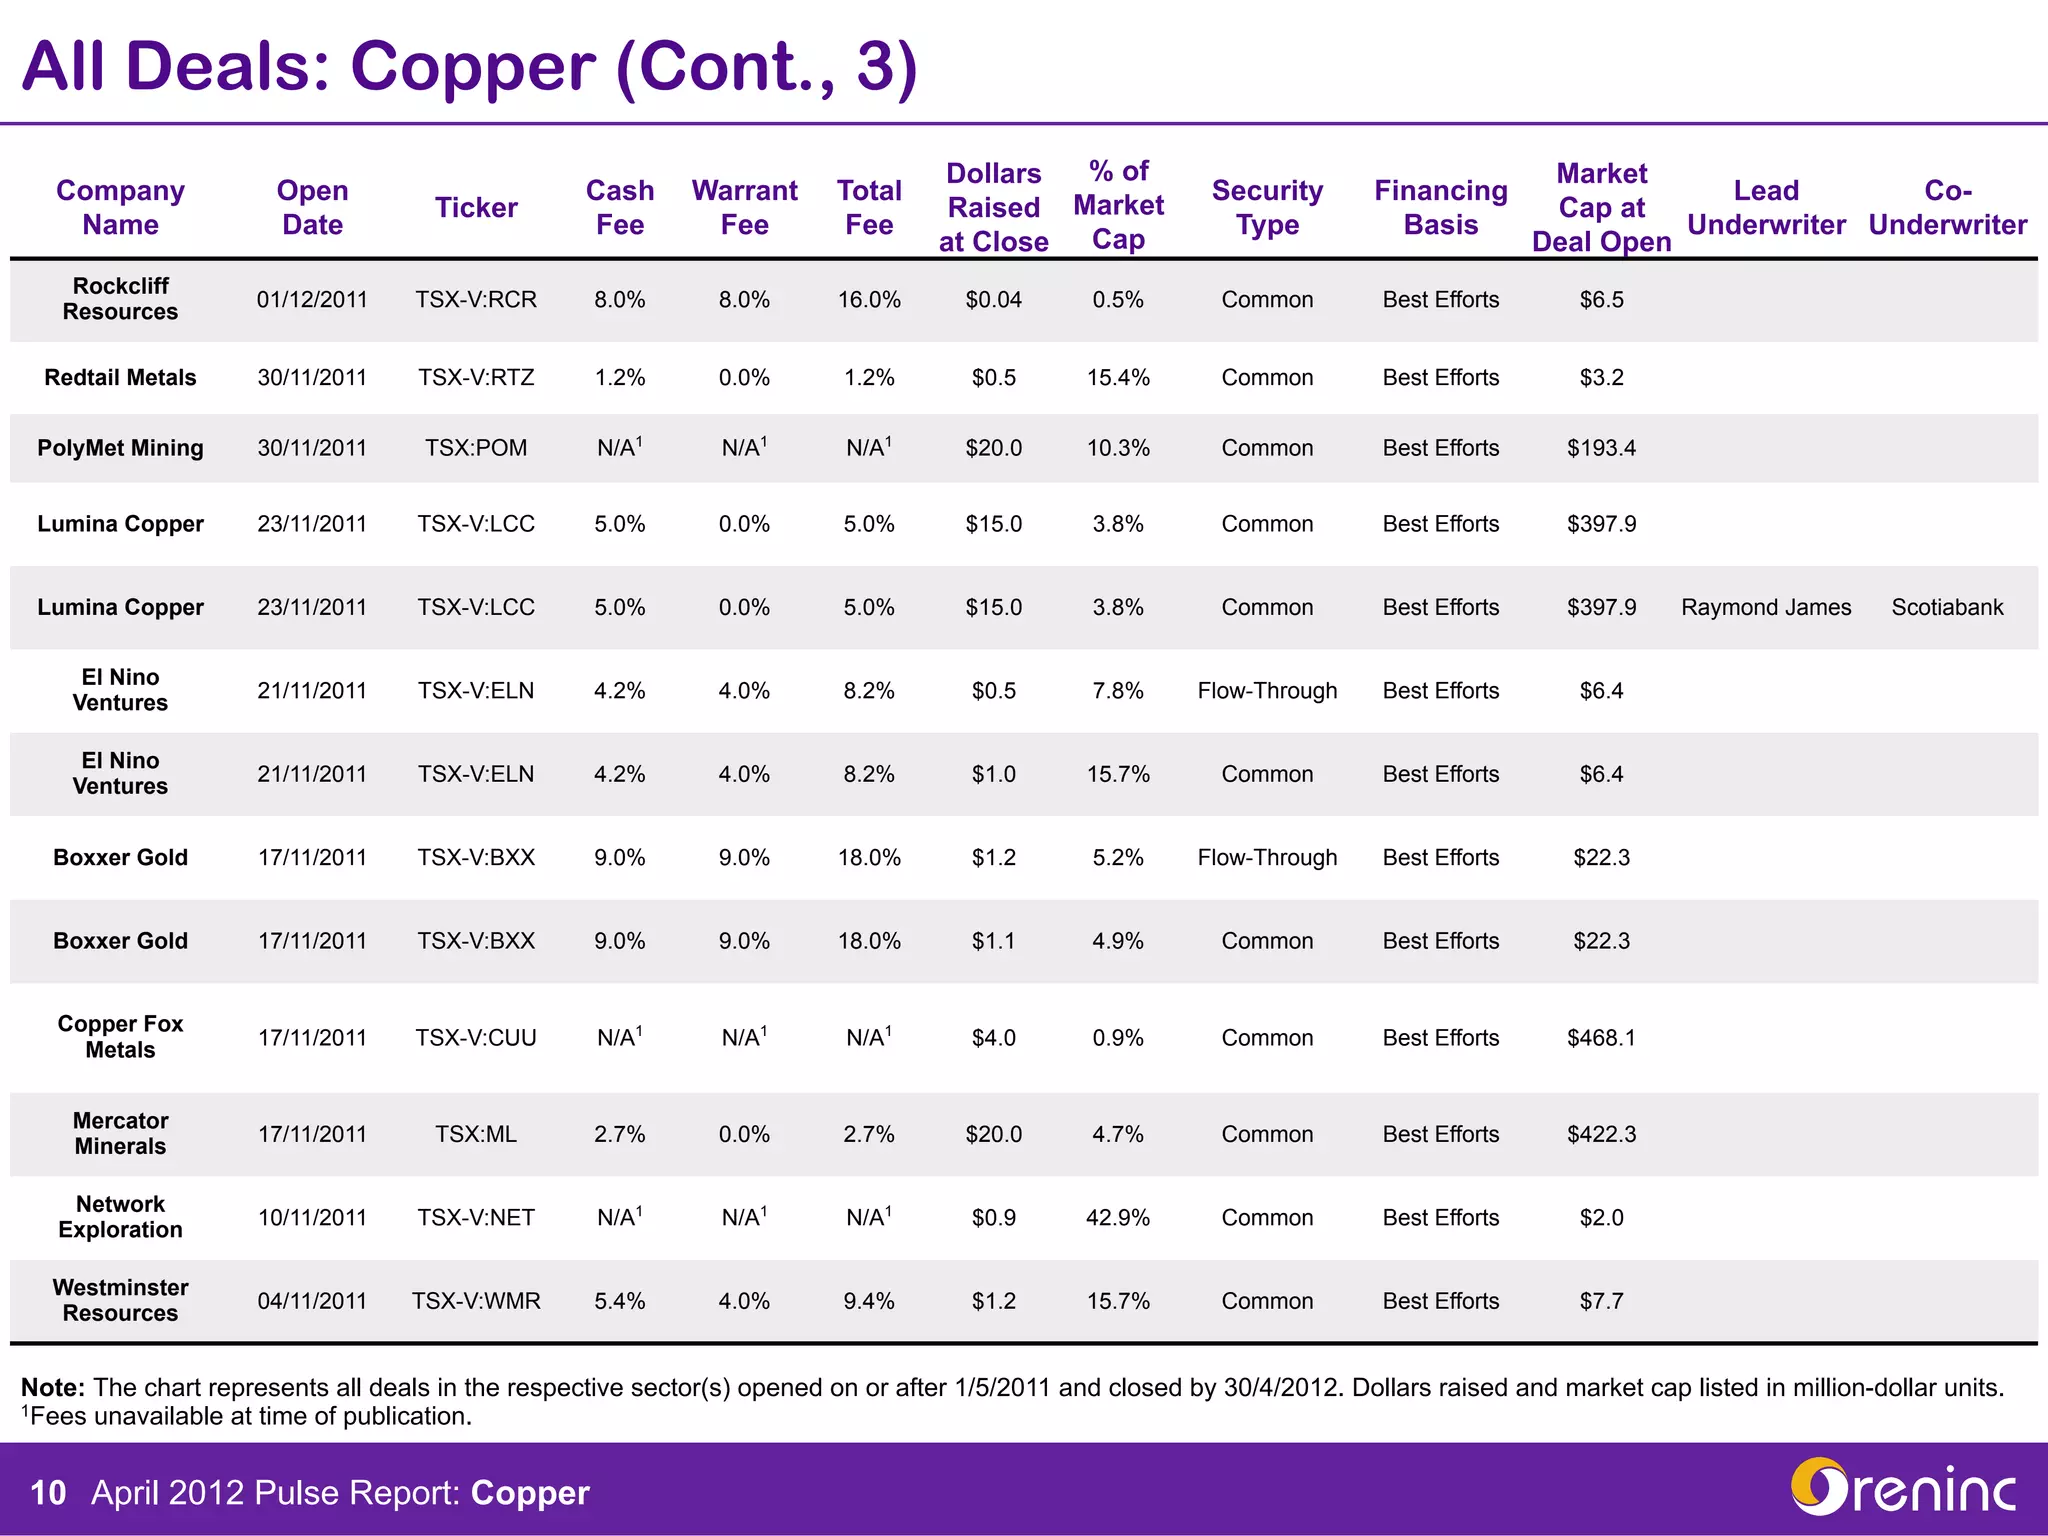
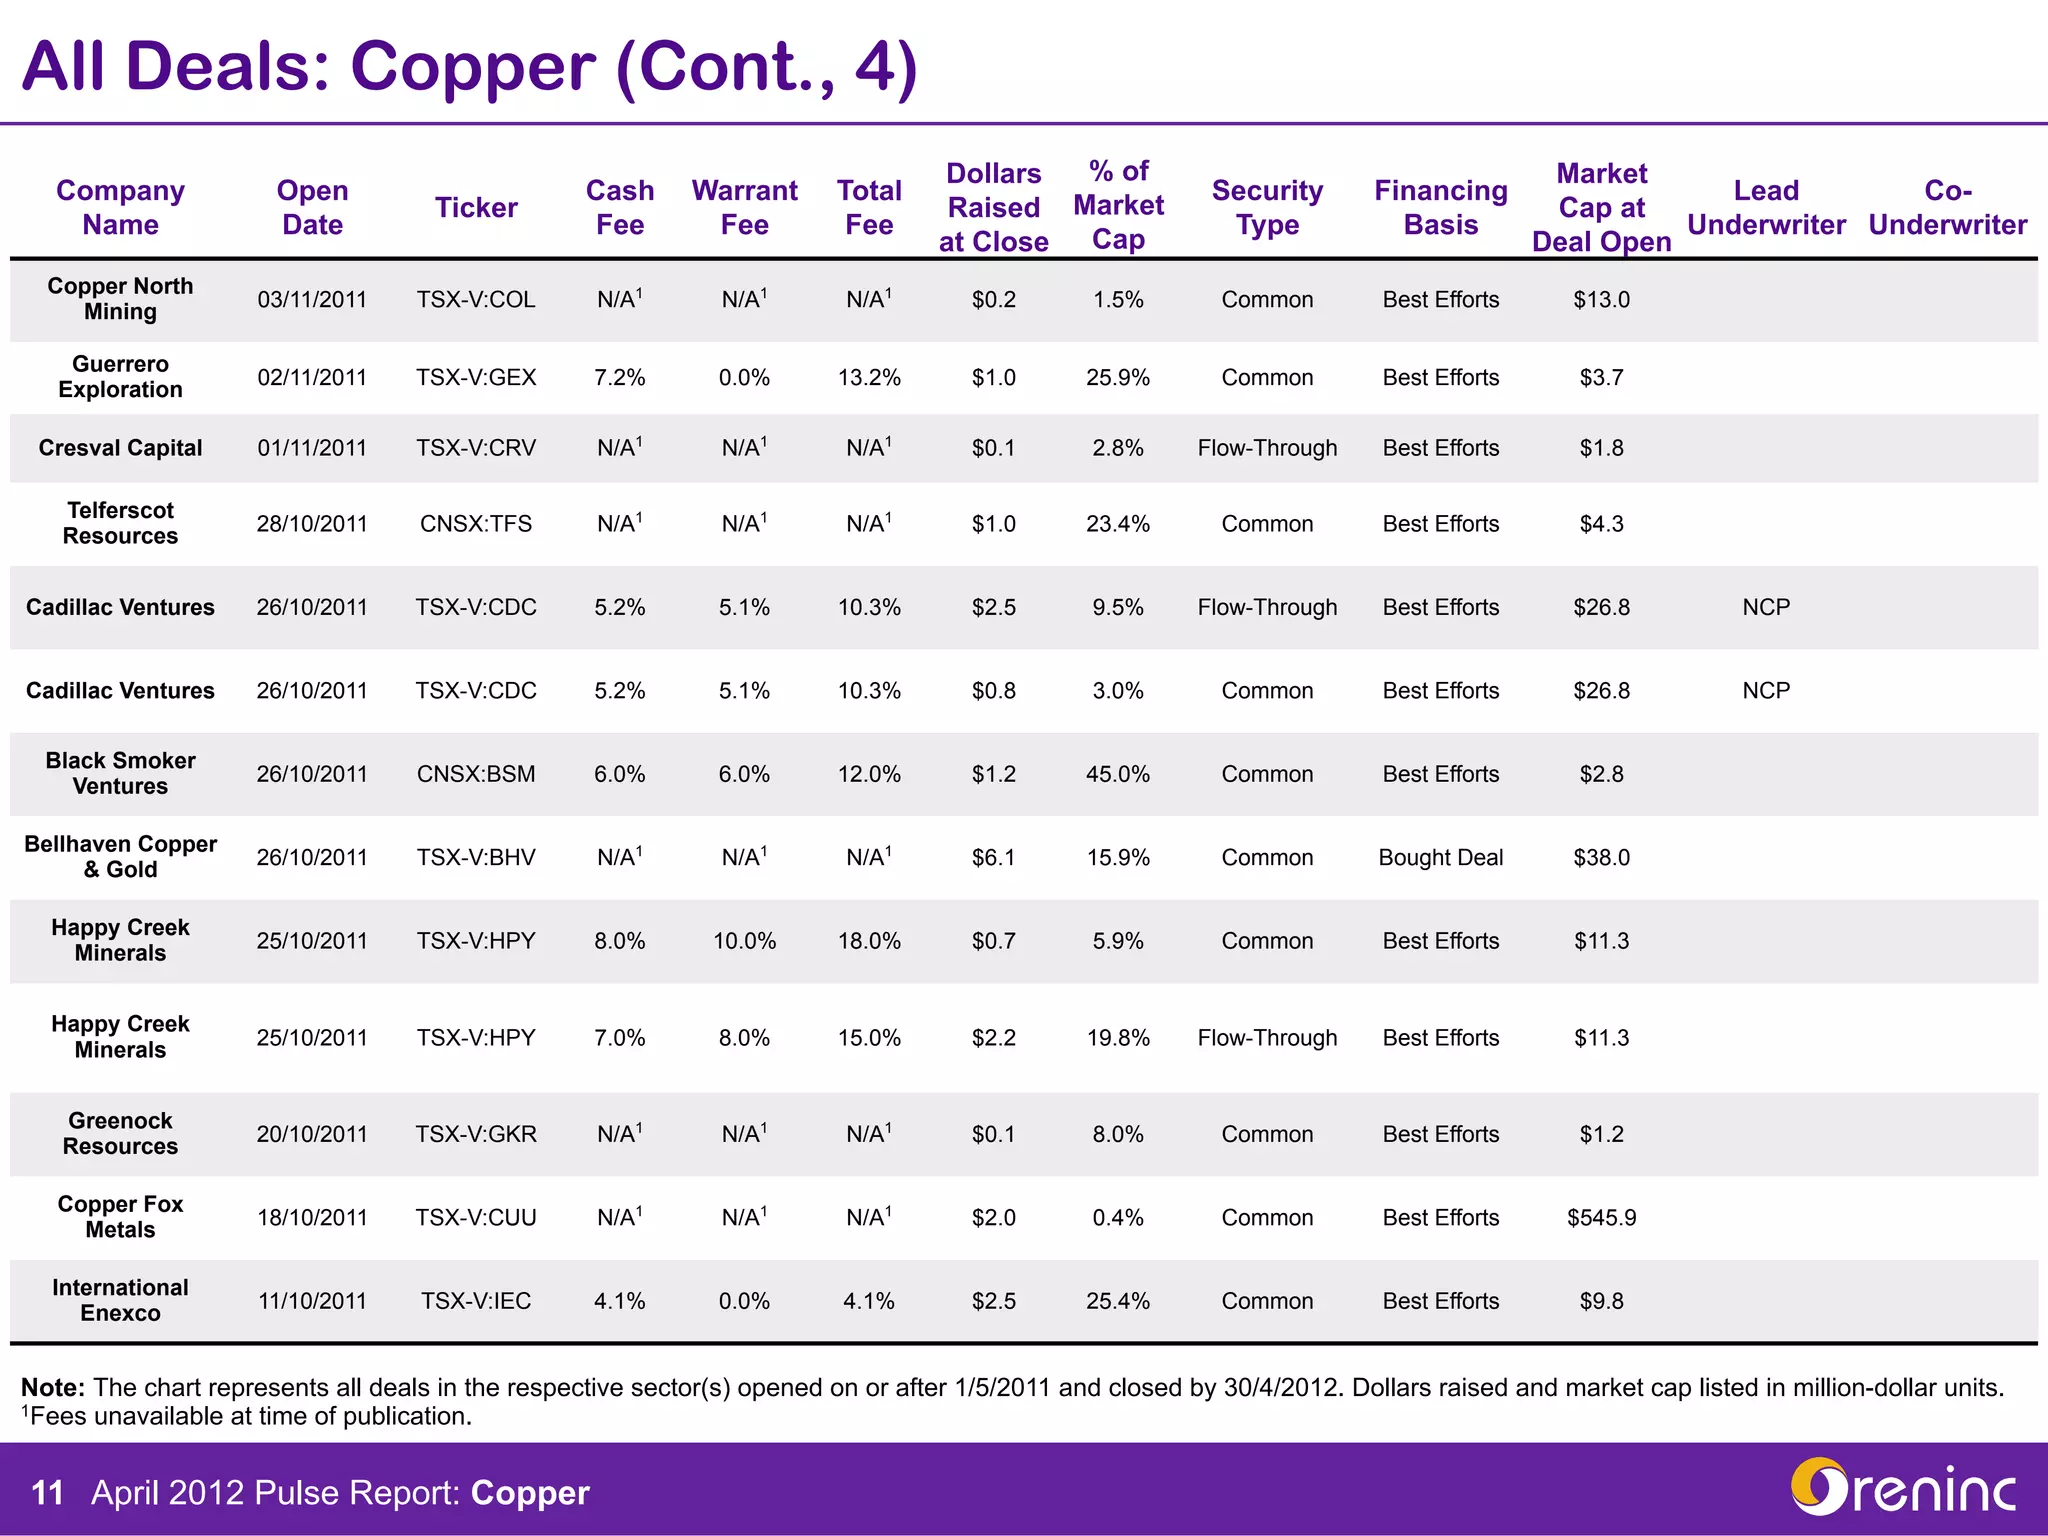
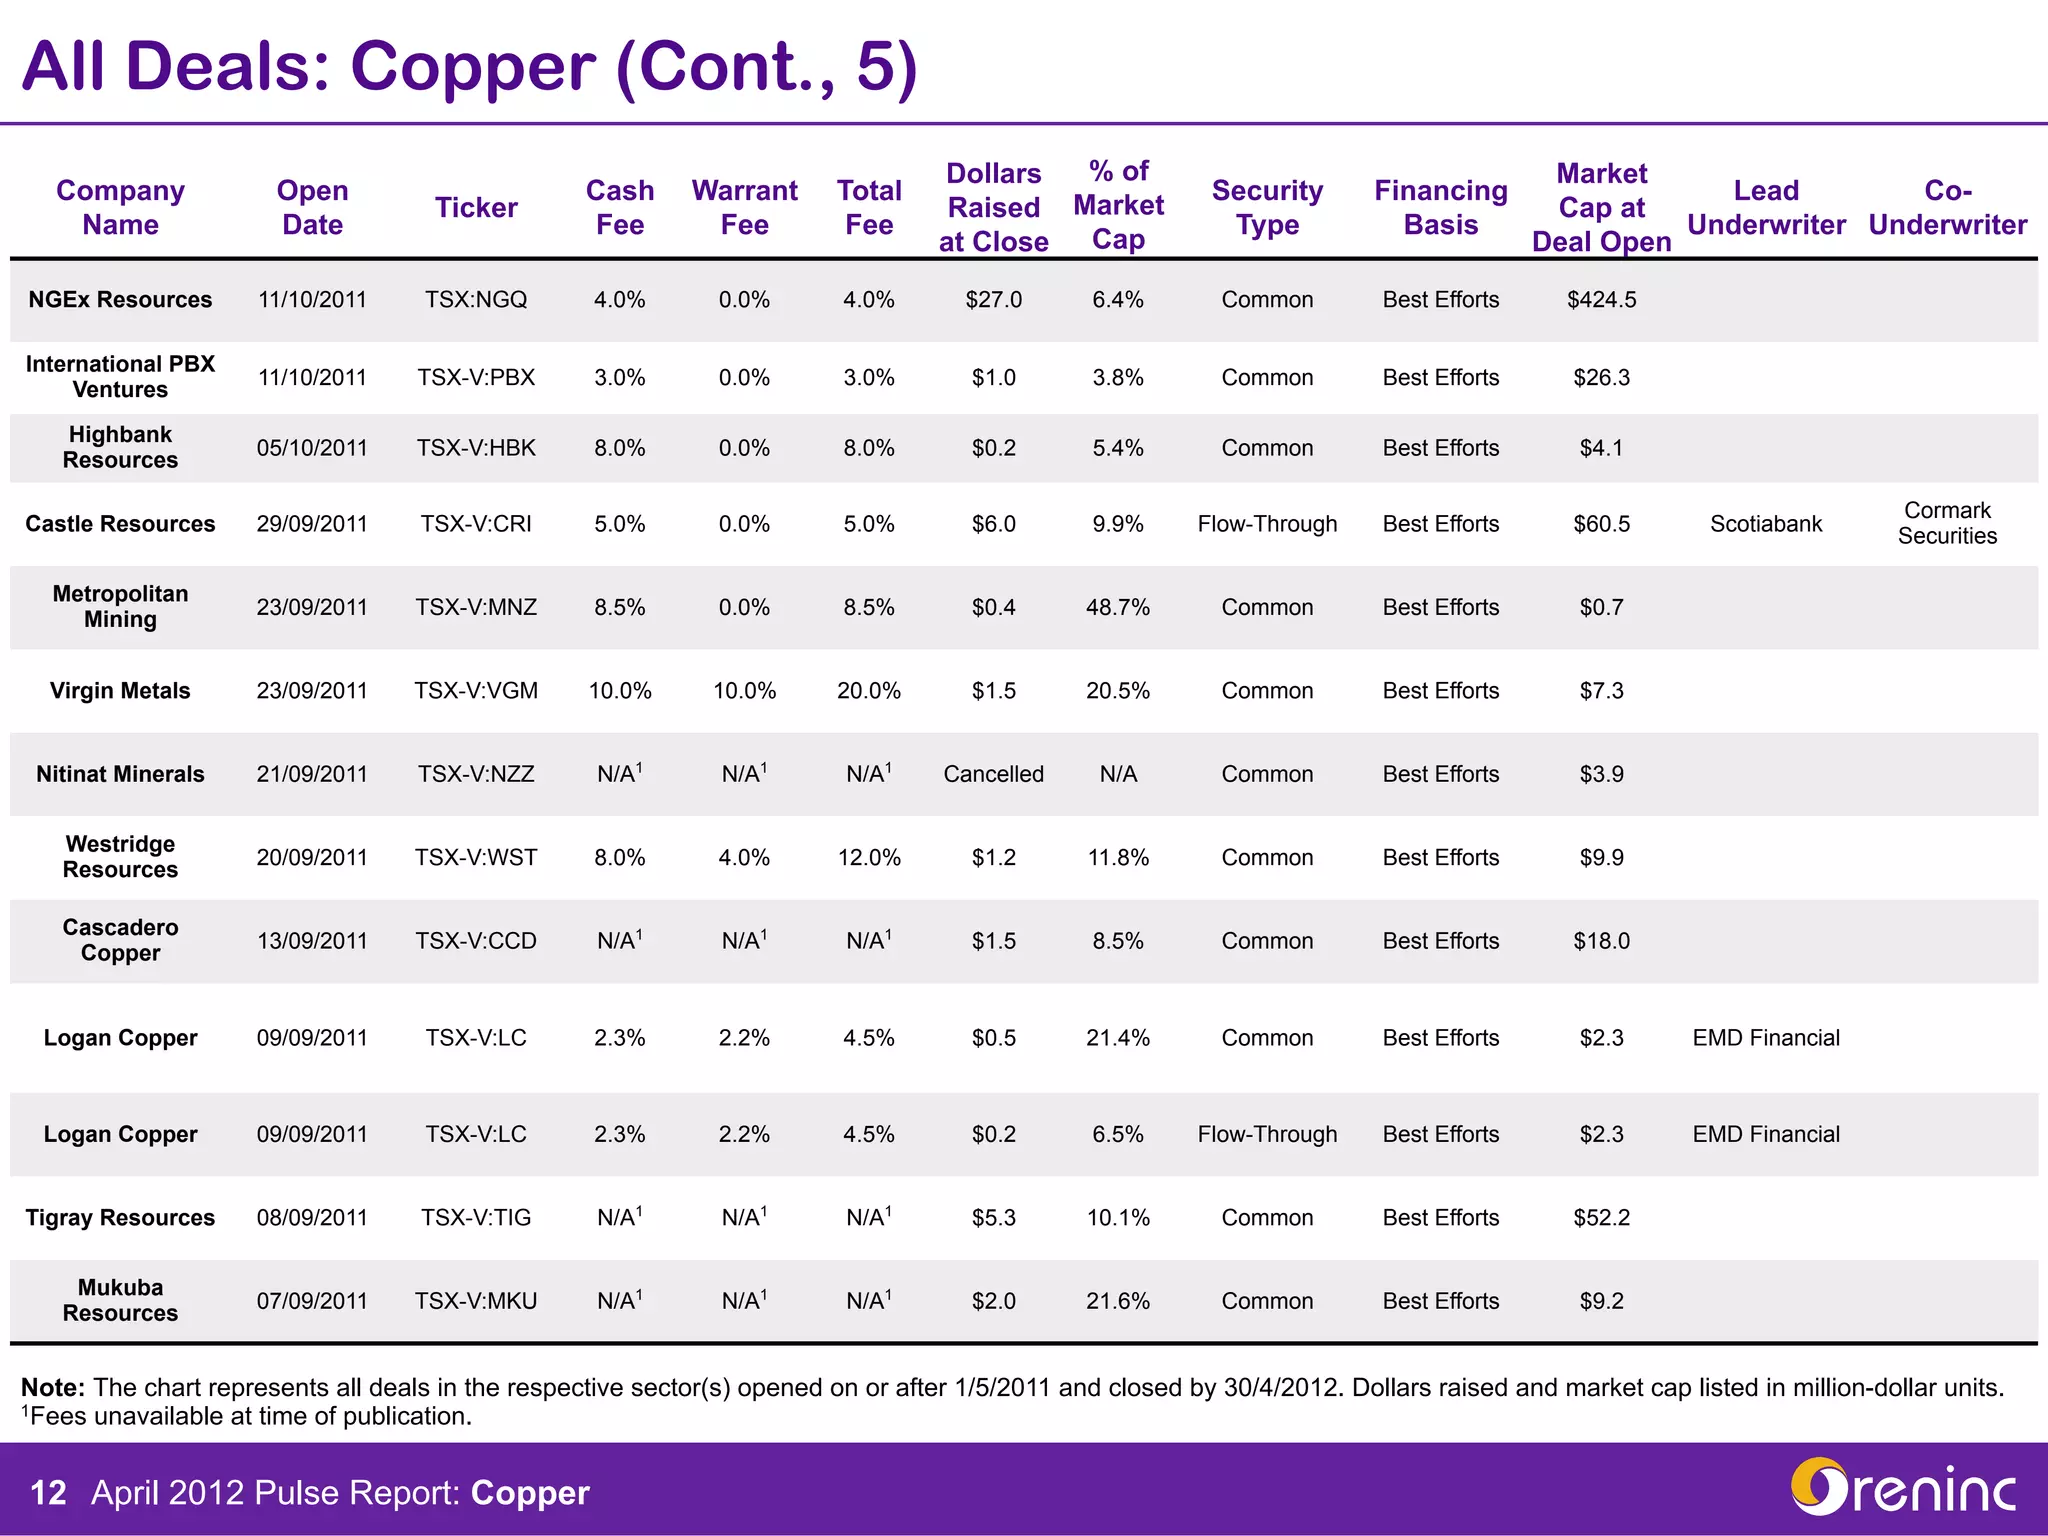
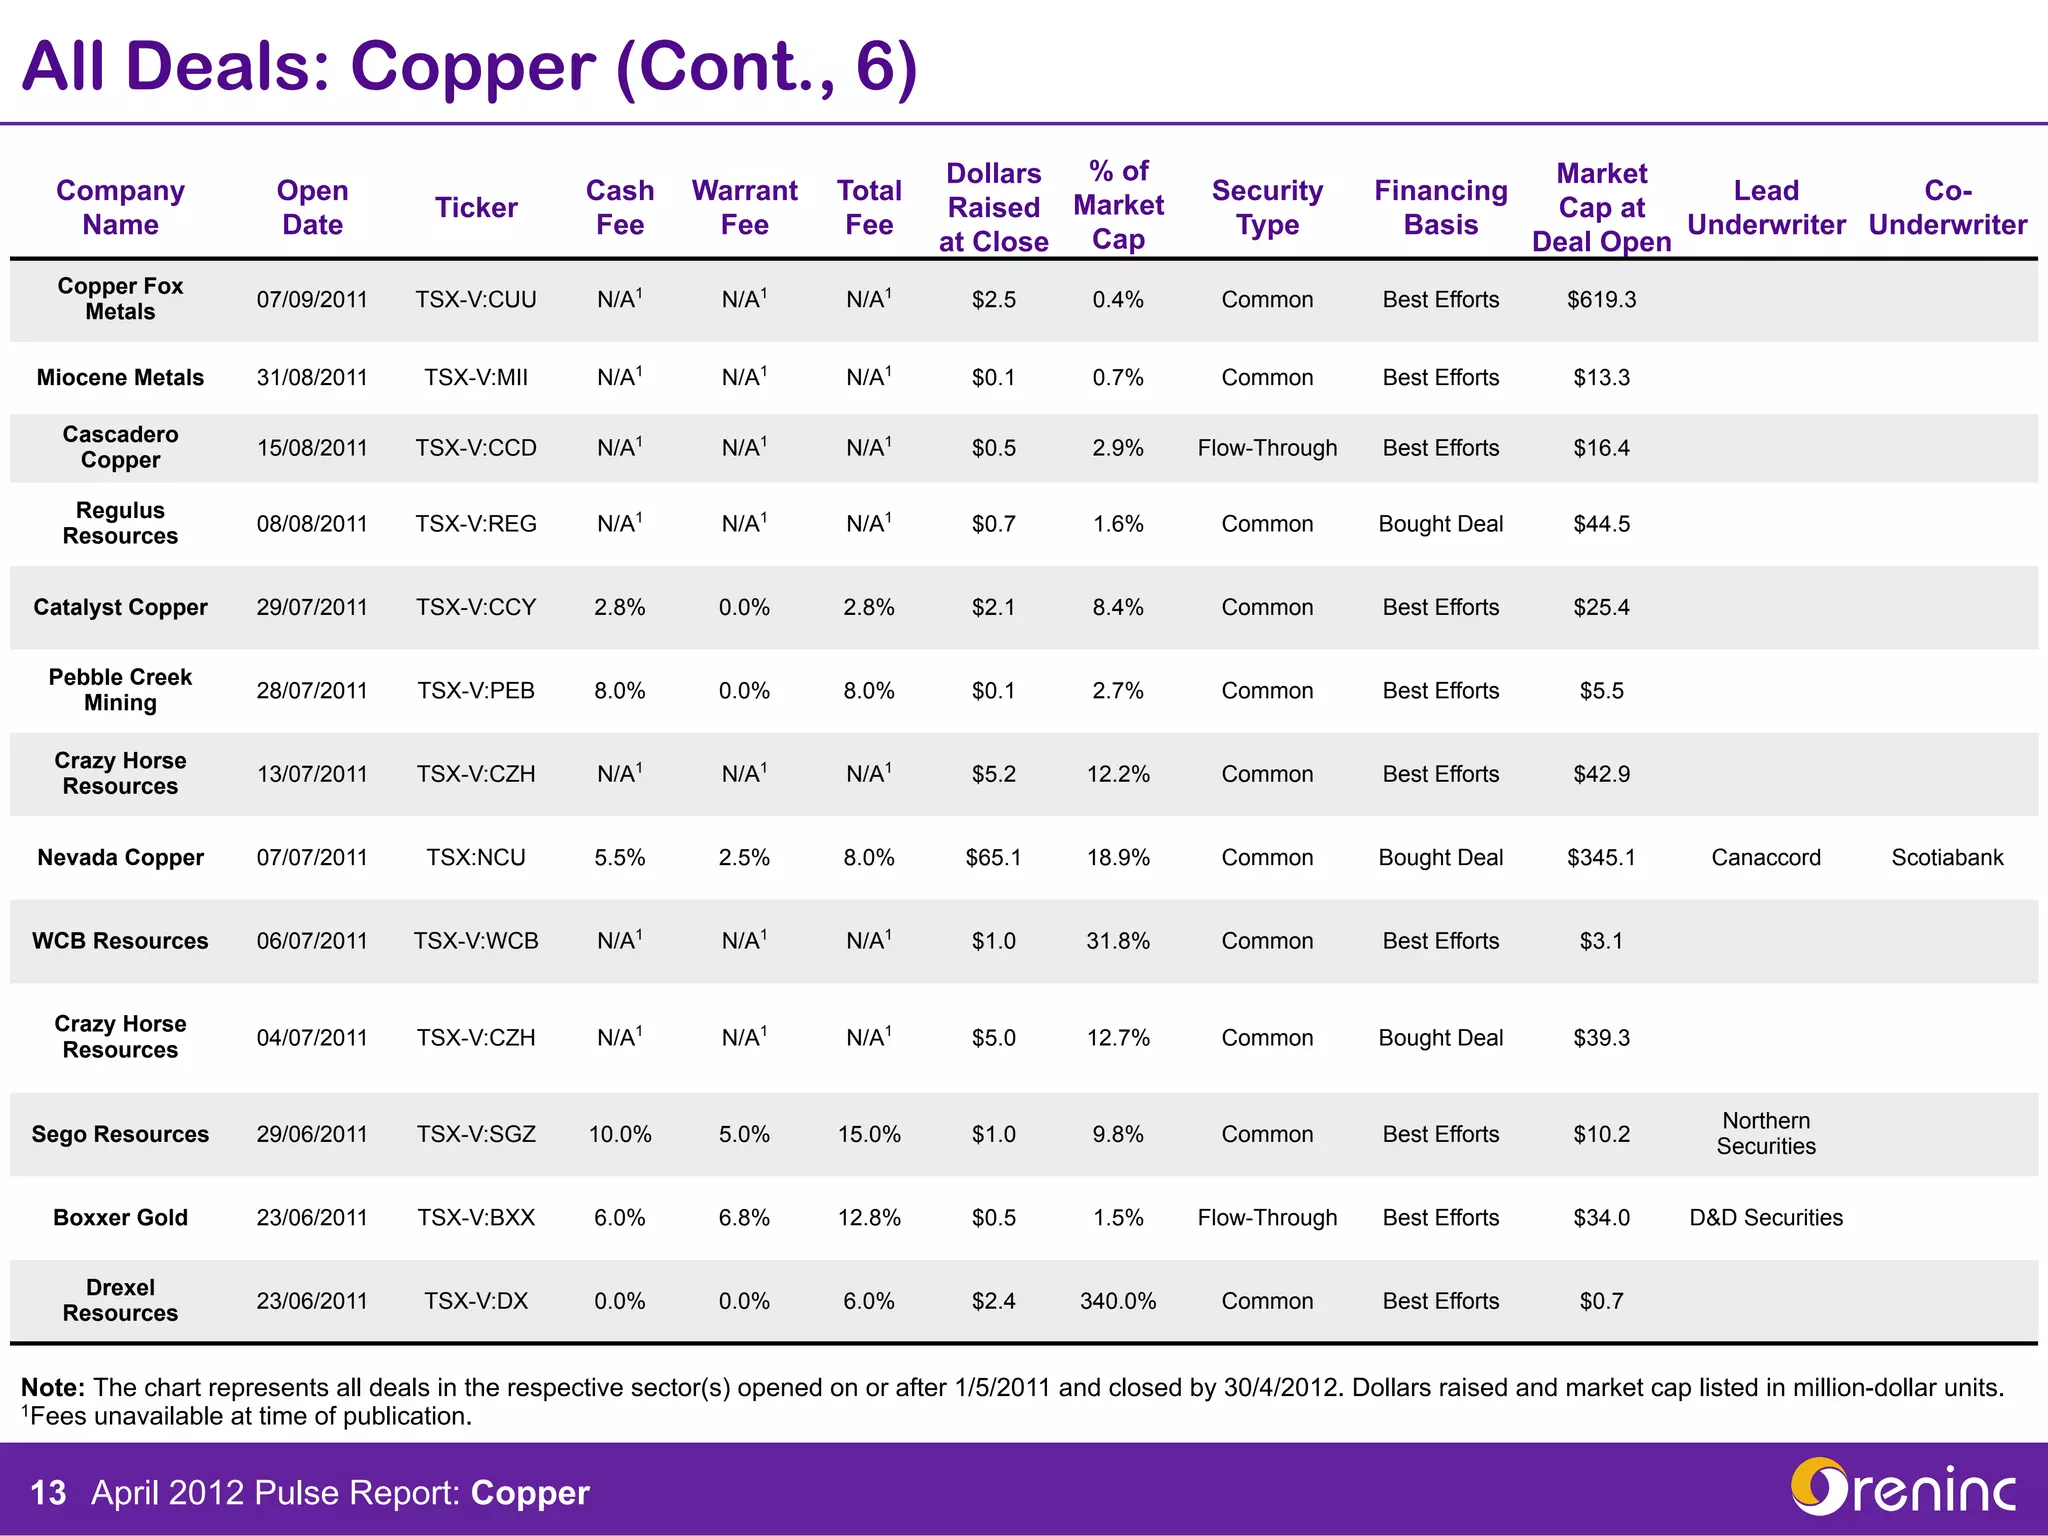
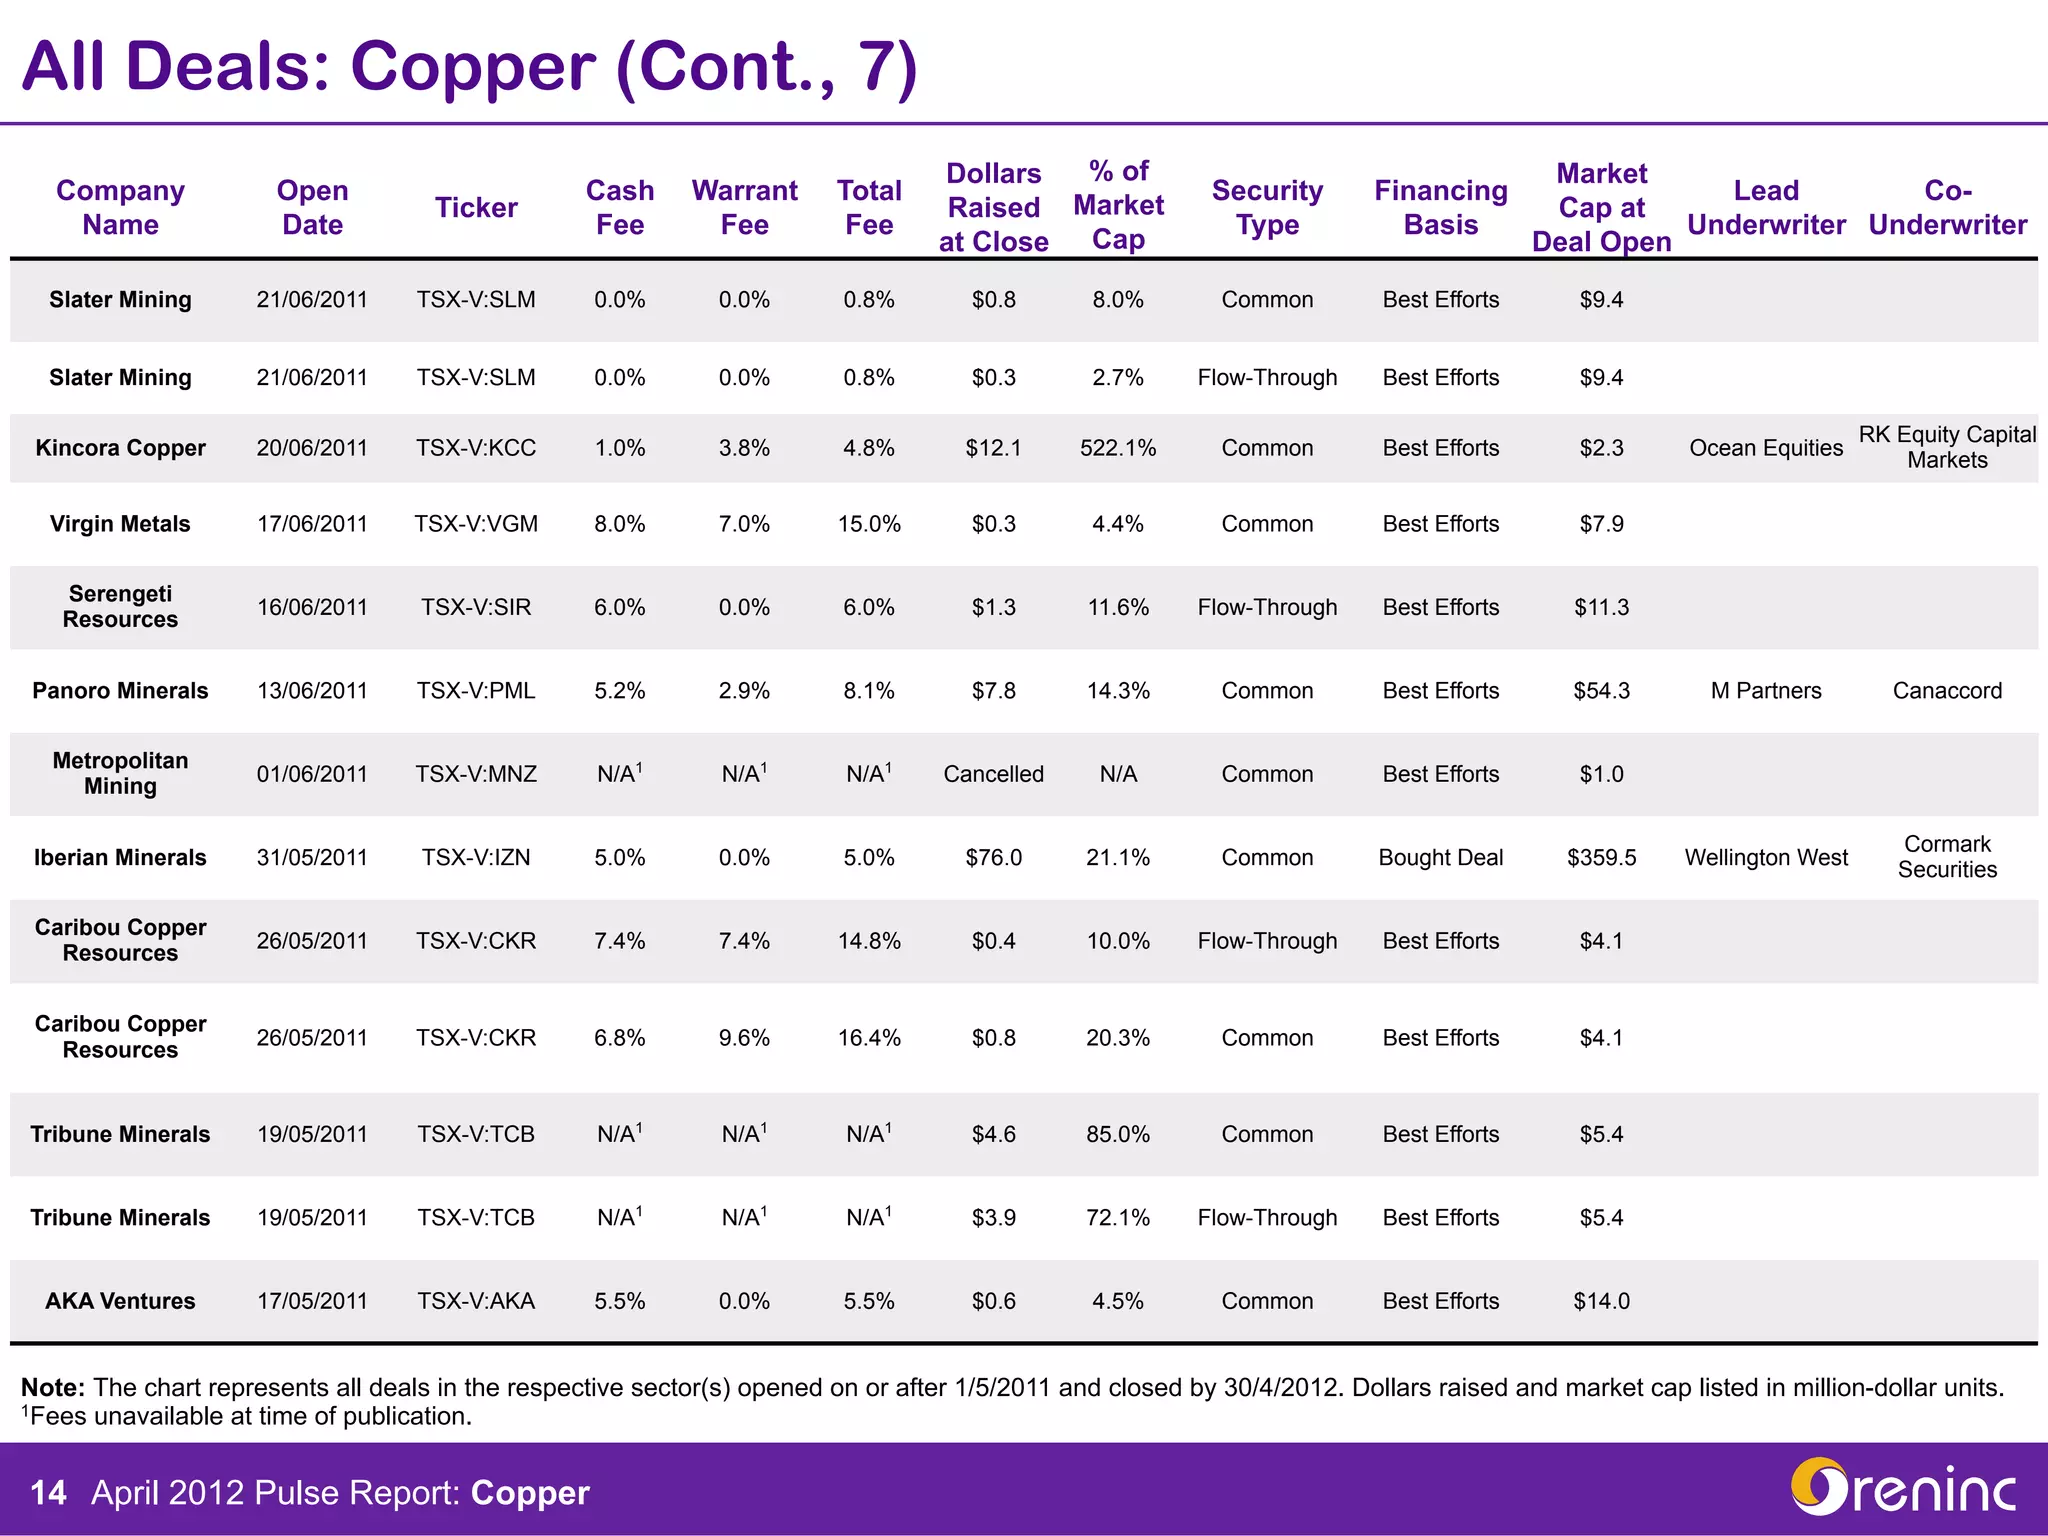
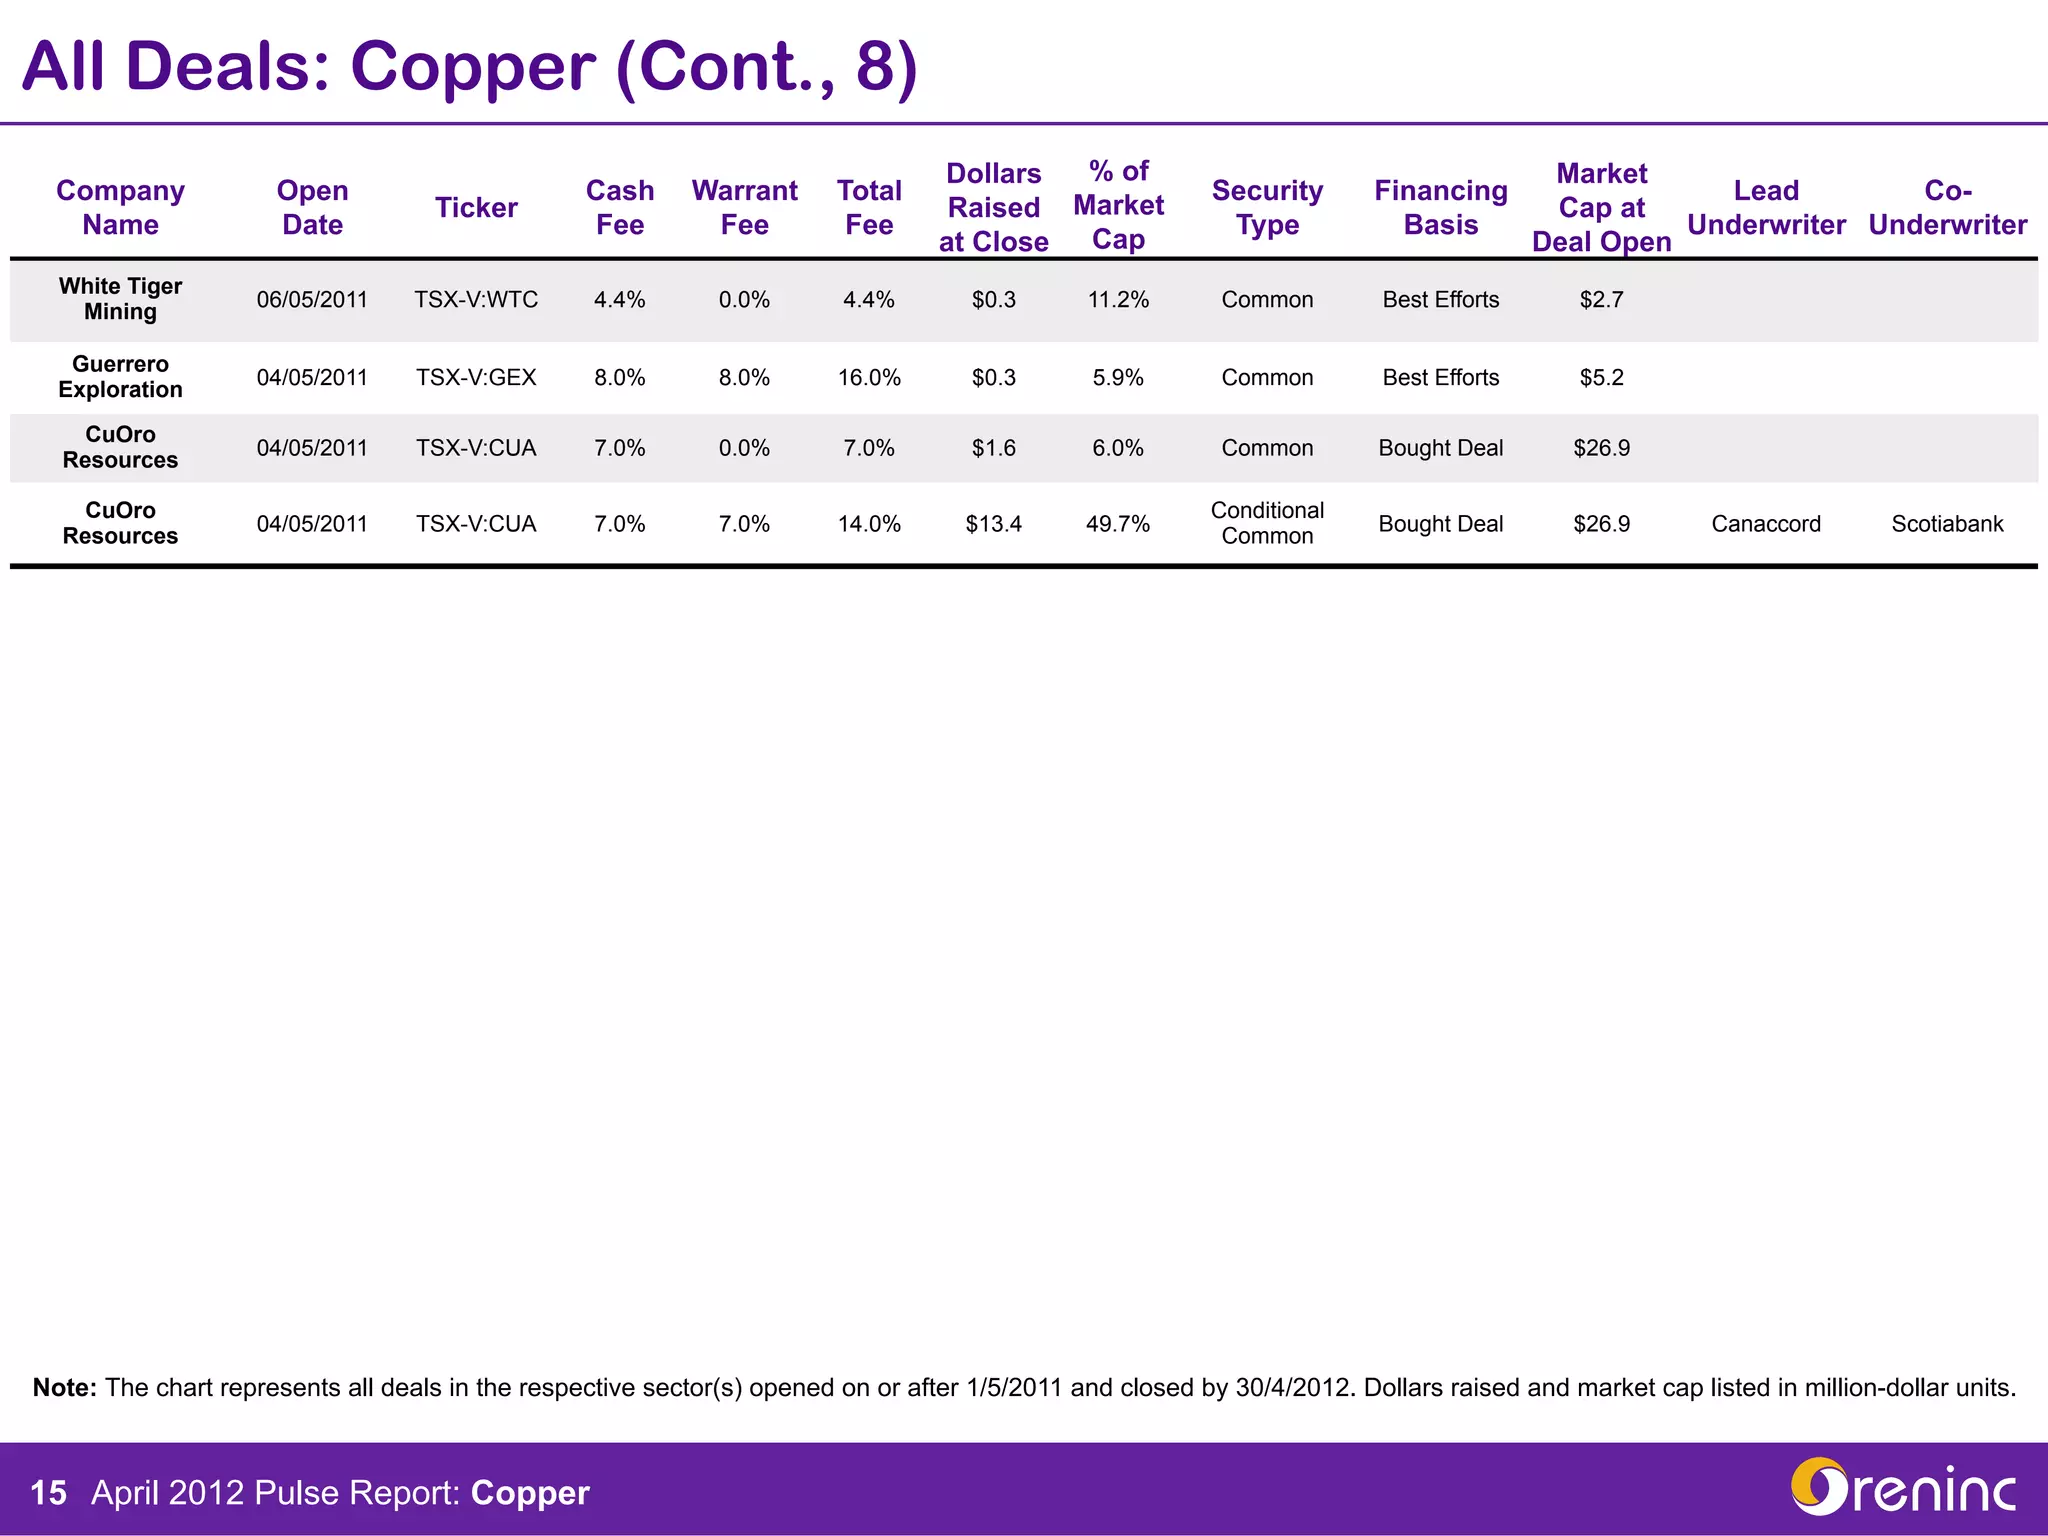
Sector	
                                                                                                          30 April 	
  

Pulse Report 2012
                                                                                                                  Copper
Disclaimer: Information and recommendations herein are the opinions of the Oreninc Analyst only. Data
utilized is believed to be accurate and reliable as of the date of this report. You should independently verify
all data herein. Data was not reviewed, supplied or amended by any bank or third party prior to production
of this report.
Broker Fee Charts
                                                                                                        Broker Fees by Market Cap: All Sectors
                                                                                                                Average Cash Fee      Average Total Fee

                                                                                       14%
     When looking at a financing, it is important
                                                                                       12%
     to remember: the smaller the market cap,
                                                                                       10%
     the higher the fees.
                                                                                        8%
                                                                                        6%
                                                                                        4%
                                                                                        2%
                                                                                        0%
                                                                                         $0-$10             $10-$25           $25-$50           $50-$100          $100-$500

                                                                                                                     Broker Fees: Copper
                                                                                                              Average Cash Fee         Average Total Fee
     This chart represents the fees charged by                                            16%
                                                                                          14%
     each broker in the copper sector. The                                                12%
                                                                                          10%
     numerical values listed on page 5 can be                                              8%
     used for negotiating purposes.                                                        6%
                                                                                           4%
                                                                                           2%
                                                                                           0%


  Note: The charts represent all brokered deals in the respective sector(s) opened on or after 1/5/2011 and closed by 30/4/2012. Market cap listed in million-dollar units.


2 April 2012 Pulse Report: Copper
Broker Efficiency
                                                                                                         Average Deal Size: Copper

     Choose a broker who has completed                                                       80
                                                                                             70
     offerings of similar size to your deal, but                                             60


                                                                                  Millions
     keep in mind that these are averages.                                                   50
                                                                                             40
     Sometimes a broker completes one large                                                  30
                                                                                             20
     offering and several small ones, which                                                  10
     skews the average deal size. Therefore, it                                               0

     is important to review the table in the back.


                                                                                                     Average Time to Close: Copper
     We care about broker efficiency. The speed                                              80
     at which a broker moves a transaction from                                              70
                                                                                             60
     announcement to completion is a good                                                    50


                                                                                  Days
     indication of their ability to deliver a                                                40
                                                                                             30
     successful raise.                                                                       20
                                                                                             10
                                                                                              0


                Note: The charts represent all brokered deals in the respective sector(s) opened on or after 1/5/2011 and closed by 30/4/2012.


3 April 2012 Pulse Report: Copper
Broker Sector Focus
                                                                                                    % of Brokers Total Book: Copper
                                                                                120%
                                                                                100%
     The percentage of a broker’s total lead in                                   80%
     your sector gives you a sense of how                                         60%
     material your sector is for their business.                                  40%
                                                                                  20%
                                                                                    0%


     Money raised in copper will show which                                                                Money Raised: Copper
     brokers have a track record of raising                                                  $90
                                                                                             $80
     money for your sector.                                                                  $70
                                                                                             $60


                                                                                  Millions
                                                                                             $50
                                                                                             $40
                                                                                             $30
                                                                                             $20
                                                                                             $10
                                                                                              $0


                Note: The charts represent all brokered deals in the respective sector(s) opened on or after 1/5/2011 and closed by 30/4/2012.


4 April 2012 Pulse Report: Copper
Copper Brokers
                                                                                                                                     % of Deals        Average         Average
                    Cash           Warrant            Total           Total           Total       Average Deal       % of Total
   Broker                                                                                                                               with           Days to       Subscription
                    Fee             Fee                Fee           Raised           Deals           Size            Book
                                                                                                                                     Warrants           Close           Rate

  Canaccord          5.8%             3.3%            9.0%             $78.5             2              $39.2           13.0%           50.0%             26.5           100.0%

   Casimir
                     6.0%             6.0%            12.0%            $2.1              1              $2.1            0.7%            100.0%            14.0           101.0%
   Capital

D&D Securities       6.0%             6.8%            12.8%            $0.5              1              $0.5            1.9%            100.0%            69.0           43.8%

   Dundee
                     5.0%             5.0%            10.0%            $26.7             1              $26.7           10.8%           100.0%            27.0           133.4%
  Securities

EMD Financial        2.3%             2.2%            4.5%             $0.6              2              $0.3           100.0%           100.0%            70.0           218.6%


  M Partners         5.2%             2.9%            8.1%             $7.8              1              $7.8            48.7%           100.0%            24.0           96.9%

   Mackie
                     6.0%             6.0%            12.0%            $10.0             2              $5.0            13.7%            0.0%             14.0           125.6%
  Research

  Macquarie          7.0%             7.0%            14.0%            $13.8             1              $13.8           10.6%           100.0%            15.0           138.0%


     NCP             5.2%             5.1%            10.3%            $3.3              2              $1.7            30.1%           100.0%            56.0           47.8%

  Northern
                     10.0%            5.0%            15.0%            $1.0              1              $1.0           100.0%           100.0%            28.0           100.0%
  Securities

Ocean Equities       1.0%             3.8%            4.8%             $12.1             1              $12.1          100.0%            0.0%             25.0           89.9%


 PI Financial        10.0%            0.0%            10.0%            $0.5              1              $0.5            3.9%             0.0%             6.0            100.0%

  Raymond
                     5.0%             0.0%            5.0%             $15.0             1              $15.0           21.7%            0.0%             15.0           100.0%
   James

   Salman
                     6.5%             6.5%            13.0%            $1.5              1              $1.5            5.4%             0.0%             23.0           100.0%
   Partners


Note: The chart represents all brokered deals in the respective sector(s) opened on or after 1/5/2011 and closed by 30/4/2012. Average deal size and total raised listed in million-
dollar units.

 5 April 2012 Pulse Report: Copper
Copper Brokers
                                                                                                                                     % of Deals        Average         Average
                    Cash           Warrant            Total           Total           Total       Average Deal       % of Total
   Broker                                                                                                                               with           Days to       Subscription
                    Fee             Fee                Fee           Raised           Deals           Size            Book
                                                                                                                                     Warrants           Close           Rate

  Scotiabank         5.0%             0.0%            5.0%             $6.0              1              $6.0            6.5%             0.0%             20.0           100.0%


Wellington West      5.0%             0.0%            5.0%             $76.0             1              $76.0          100.0%            0.0%             24.0           122.6%

   Brokered
                     5.2%             2.6%            7.8%            $255.4            20              $12.8           0.0%            52.4%             31.2           110.5%
   Average

 Non-Brokered
                     4.4%             1.1%            5.6%            $212.4            88              $2.4            0.0%            70.5%             40.3           92.5%
   Average


Note: The chart represents all brokered deals in the respective sector(s) opened on or after 1/5/2011 and closed by 30/4/2012. Average deal size and total raised listed in million-
dollar units.

  6 April 2012 Pulse Report: Copper
All Deals: Copper
                                                                                  Dollars   % of                                          Market
   Company             Open                       Cash      Warrant      Total                             Security       Financing                   Lead        Co-
                                     Ticker                                        Raised  Market                                         Cap at
    Name               Date                       Fee        Fee          Fee                               Type            Basis                  Underwriter Underwriter
                                                                                  at Close Cap                                           Deal Open
    Quaterra
                     13/04/2012    TSX-V:QTA        N/A1       N/A1       N/A1       $2.5       3.9%        Common        Best Efforts      $64.0
   Resources

International PBX
                     12/04/2012    TSX-V:PBX        N/A1       N/A1       N/A1       $0.7       4.9%        Common        Best Efforts      $13.7
     Ventures

    Enertopia        09/04/2012    CNSX:TOP        7.0%        7.0%      14.0%       $0.2       13.2%       Common        Best Efforts      $1.6


 Toro Resources      29/03/2012    TSX-V:TRK       8.0%        8.0%      16.0%     Cancelled     N/A        Common        Best Efforts      $5.4


Castle Resources     15/03/2012     TSX-V:CRI      6.0%        6.0%      12.0%       $6.6       12.6%     Flow-Through    Bought Deal       $52.7    Mackie Research    Scotiabank


Castle Resources     15/03/2012     TSX-V:CRI      6.0%        6.0%      12.0%       $3.4       6.4%        Common        Bought Deal       $52.7    Mackie Research    Scotiabank


 WCB Resources       09/03/2012    TSX-V:WCB       6.0%        6.0%      12.0%       $2.1       12.2%       Common        Best Efforts      $17.0     Casimir Capital


   Highbank
                     28/02/2012    TSX-V:HBK       8.0%        8.0%      16.0%       $0.7       9.9%        Common        Best Efforts      $7.0
   Resources

   Cascadero
                     24/02/2012    TSX-V:CCD        N/A1       N/A1       N/A1       $0.1       0.5%        Common        Best Efforts      $19.6
    Copper


    Equinox
                     23/02/2012    TSX-V:EQX       3.8%        3.0%       6.8%       $1.3       25.2%       Common        Best Efforts      $5.3
   Exploration


 Panoro Minerals     22/02/2012    TSX-V:PML       7.0%        7.0%      14.0%       $13.8      15.2%       Common        Bought Deal       $90.9       Macquarie       M Partners


 Andover Mining      16/02/2012    TSX-V:AOX        N/A1       N/A1       N/A1       $1.4       2.9%        Common        Best Efforts      $49.2


Abacus Mining and
                     15/02/2012    TSX-V:AME       6.0%        0.0%       6.0%       $3.2       6.9%        Common        Best Efforts      $46.4
   Exploration


Note: The chart represents all deals in the respective sector(s) opened on or after 1/5/2011 and closed by 30/4/2012. Dollars raised and market cap listed in million-dollar units.
1Fees unavailable at time of publication.


 7 April 2012 Pulse Report: Copper
All Deals: Copper (Cont.)
                                                                                  Dollars   % of                                          Market
   Company             Open                       Cash      Warrant      Total                             Security       Financing                   Lead        Co-
                                     Ticker                                        Raised  Market                                         Cap at
    Name               Date                       Fee        Fee          Fee                               Type            Basis                  Underwriter Underwriter
                                                                                  at Close Cap                                           Deal Open
  Westminster
                     09/02/2012    TSX-V:WMR        N/A1       N/A1       N/A1       $0.9       8.2%        Common        Best Efforts      $10.6
  Resources

   Snowfield
                     09/02/2012    TSX-V:SNO       1.4%        0.0%       1.4%       $0.5       25.2%       Common        Best Efforts      $2.1
  Development
    Regulus                                                                                                Conditional                                   Dundee          Axemen
                     08/02/2012    TSX-V:PMA       5.0%        5.0%      10.0%       $26.7      55.8%                     Bought Deal       $47.8
   Resources                                                                                                Common                                      Securities       Resource

Northisle Copper
                     08/02/2012    TSX-V:NCX       6.5%        6.5%      13.0%       $1.5       9.5%      Flow-Through    Best Efforts      $15.9    Salman Partners
    and Gold

   White Tiger
                     07/02/2012    TSX-V:WTC       1.5%        1.5%       3.0%       $0.6       17.1%       Common        Best Efforts      $3.4
    Mining


  VMS Ventures       01/02/2012    TSX-V:VMS       6.0%        3.0%       9.0%       $2.5       5.0%      Flow-Through    Best Efforts      $48.8


   Lions Gate
                     31/01/2012    TSX-V:LGM       3.3%        0.0%       3.3%       $0.4       4.2%        Common        Best Efforts      $9.4
     Metals

   Lions Gate
                     31/01/2012    TSX-V:LGM       3.3%        0.0%       3.3%       $0.5       4.9%      Flow-Through    Best Efforts      $9.4
     Metals

    Salazar
                     30/01/2012    TSX-V:SRL       2.0%        0.0%       2.0%       $3.0       16.0%       Common        Best Efforts      $18.8
   Resources


  African Metals     27/01/2012    TSX-V:AFR       7.5%        7.5%      15.0%       $1.3       8.9%        Common        Best Efforts      $14.4


  Hana Mining        26/01/2012    TSX-V:HMG       2.9%        0.0%       2.9%       $14.9      11.6%       Common        Best Efforts     $129.1


International PBX
                     24/01/2012    TSX-V:PBX       0.7%        0.0%       0.7%       $0.6       2.6%        Common        Best Efforts      $22.7
     Ventures


 Catalyst Copper     23/01/2012    TSX-V:CCY       3.0%        0.0%       3.0%       $3.5       13.3%       Common        Best Efforts      $26.5


Note: The chart represents all deals in the respective sector(s) opened on or after 1/5/2011 and closed by 30/4/2012. Dollars raised and market cap listed in million-dollar units.
1Fees unavailable at time of publication.


 8 April 2012 Pulse Report: Copper
All Deals: Copper (Cont., 2)
                                                                                  Dollars   % of                                          Market
   Company             Open                       Cash      Warrant      Total                             Security       Financing                   Lead        Co-
                                     Ticker                                        Raised  Market                                         Cap at
    Name               Date                       Fee        Fee          Fee                               Type            Basis                  Underwriter Underwriter
                                                                                  at Close Cap                                           Deal Open
   Terra Firma
                     20/01/2012    TSX-V:TFR       6.7%        0.0%       6.7%       $0.4       32.6%       Common        Best Efforts      $1.1
   Resources

  Oracle Mining      19/01/2012     TSX:OMN        6.0%        0.0%       6.0%       $9.8       24.8%       Common        Best Efforts      $39.3

   Copper Fox
                     18/01/2012    TSX-V:CUU        N/A1       N/A1       N/A1       $2.2       0.5%        Common        Best Efforts     $426.1
     Metals

 Niblack Mineral
                     29/12/2011     TSX-V:NIB      10.0%       0.0%      10.0%       $0.5       7.3%        Common        Best Efforts      $6.5        PI Financial
  Development

   Los Andes
                     23/12/2011     TSX-V:LA        N/A1       N/A1       N/A1       $0.8       1.5%        Common        Best Efforts      $51.0
    Copper

  Caribou King
                     22/12/2011    TSX-V:CKR       10.0%       0.0%      10.0%       $0.2       5.0%      Flow-Through    Best Efforts      $3.9
   Resources

   Doubleview
                     20/12/2011    TSX-V:DBV        N/A1       N/A1       N/A1       $0.1       21.2%     Flow-Through    Best Efforts      $0.5
     Capital

   Snowfield
                     12/12/2011    TSX-V:SNO       3.6%        0.0%       5.1%       $0.3       16.0%       Common        Best Efforts      $1.7
  Development


Millstream Mines     12/12/2011    TSX-V:MLM       10.0%       0.0%      10.0%       $0.1       5.8%        Common        Best Efforts      $1.9


Millstream Mines     12/12/2011    TSX-V:MLM       10.0%       0.0%      10.0%       $0.04      2.1%      Flow-Through    Best Efforts      $1.9


International PBX
                     09/12/2011    TSX-V:PBX        N/A1       N/A1       N/A1     Cancelled     N/A        Common        Best Efforts      $31.6
     Ventures

  Red Crescent
                     01/12/2011     TSX:RCB        0.5%        0.5%       1.0%       $0.3       1.0%        Common        Best Efforts      $28.0
   Resources

    Rockcliff
                     01/12/2011    TSX-V:RCR       8.0%        8.0%      16.0%       $2.2       34.2%     Flow-Through    Best Efforts      $6.5
   Resources


Note: The chart represents all deals in the respective sector(s) opened on or after 1/5/2011 and closed by 30/4/2012. Dollars raised and market cap listed in million-dollar units.
1Fees unavailable at time of publication.


 9 April 2012 Pulse Report: Copper
All Deals: Copper (Cont., 3)
                                                                                  Dollars   % of                                          Market
   Company             Open                       Cash      Warrant      Total                             Security       Financing                   Lead        Co-
                                     Ticker                                        Raised  Market                                         Cap at
    Name               Date                       Fee        Fee          Fee                               Type            Basis                  Underwriter Underwriter
                                                                                  at Close Cap                                           Deal Open
    Rockcliff
                     01/12/2011    TSX-V:RCR       8.0%        8.0%      16.0%       $0.04      0.5%        Common        Best Efforts      $6.5
   Resources

  Redtail Metals     30/11/2011    TSX-V:RTZ       1.2%        0.0%       1.2%       $0.5       15.4%       Common        Best Efforts      $3.2


 PolyMet Mining      30/11/2011     TSX:POM         N/A1       N/A1       N/A1       $20.0      10.3%       Common        Best Efforts     $193.4


 Lumina Copper       23/11/2011    TSX-V:LCC       5.0%        0.0%       5.0%       $15.0      3.8%        Common        Best Efforts     $397.9


 Lumina Copper       23/11/2011    TSX-V:LCC       5.0%        0.0%       5.0%       $15.0      3.8%        Common        Best Efforts     $397.9    Raymond James      Scotiabank


     El Nino
                     21/11/2011    TSX-V:ELN       4.2%        4.0%       8.2%       $0.5       7.8%      Flow-Through    Best Efforts      $6.4
    Ventures

     El Nino
                     21/11/2011    TSX-V:ELN       4.2%        4.0%       8.2%       $1.0       15.7%       Common        Best Efforts      $6.4
    Ventures


  Boxxer Gold        17/11/2011    TSX-V:BXX       9.0%        9.0%      18.0%       $1.2       5.2%      Flow-Through    Best Efforts      $22.3


  Boxxer Gold        17/11/2011    TSX-V:BXX       9.0%        9.0%      18.0%       $1.1       4.9%        Common        Best Efforts      $22.3


   Copper Fox
                     17/11/2011    TSX-V:CUU        N/A1       N/A1       N/A1       $4.0       0.9%        Common        Best Efforts     $468.1
     Metals


    Mercator
                     17/11/2011      TSX:ML        2.7%        0.0%       2.7%       $20.0      4.7%        Common        Best Efforts     $422.3
    Minerals

    Network
                     10/11/2011    TSX-V:NET        N/A1       N/A1       N/A1       $0.9       42.9%       Common        Best Efforts      $2.0
   Exploration

  Westminster
                     04/11/2011    TSX-V:WMR       5.4%        4.0%       9.4%       $1.2       15.7%       Common        Best Efforts      $7.7
  Resources


Note: The chart represents all deals in the respective sector(s) opened on or after 1/5/2011 and closed by 30/4/2012. Dollars raised and market cap listed in million-dollar units.
1Fees unavailable at time of publication.


10 April 2012 Pulse Report: Copper
All Deals: Copper (Cont., 4)
                                                                                  Dollars   % of                                          Market
   Company             Open                       Cash      Warrant      Total                             Security       Financing                   Lead        Co-
                                     Ticker                                        Raised  Market                                         Cap at
    Name               Date                       Fee        Fee          Fee                               Type            Basis                  Underwriter Underwriter
                                                                                  at Close Cap                                           Deal Open
  Copper North
                     03/11/2011    TSX-V:COL        N/A1       N/A1       N/A1       $0.2       1.5%        Common        Best Efforts      $13.0
    Mining

    Guerrero
                     02/11/2011    TSX-V:GEX       7.2%        0.0%      13.2%       $1.0       25.9%       Common        Best Efforts      $3.7
   Exploration

 Cresval Capital     01/11/2011    TSX-V:CRV        N/A1       N/A1       N/A1       $0.1       2.8%      Flow-Through    Best Efforts      $1.8

   Telferscot
                     28/10/2011     CNSX:TFS        N/A1       N/A1       N/A1       $1.0       23.4%       Common        Best Efforts      $4.3
   Resources


Cadillac Ventures    26/10/2011    TSX-V:CDC       5.2%        5.1%      10.3%       $2.5       9.5%      Flow-Through    Best Efforts      $26.8          NCP


Cadillac Ventures    26/10/2011    TSX-V:CDC       5.2%        5.1%      10.3%       $0.8       3.0%        Common        Best Efforts      $26.8          NCP


  Black Smoker
                     26/10/2011    CNSX:BSM        6.0%        6.0%      12.0%       $1.2       45.0%       Common        Best Efforts      $2.8
    Ventures

Bellhaven Copper
                     26/10/2011    TSX-V:BHV        N/A1       N/A1       N/A1       $6.1       15.9%       Common        Bought Deal       $38.0
     & Gold

  Happy Creek
                     25/10/2011    TSX-V:HPY       8.0%       10.0%      18.0%       $0.7       5.9%        Common        Best Efforts      $11.3
    Minerals


  Happy Creek
                     25/10/2011    TSX-V:HPY       7.0%        8.0%      15.0%       $2.2       19.8%     Flow-Through    Best Efforts      $11.3
    Minerals


   Greenock
                     20/10/2011    TSX-V:GKR        N/A1       N/A1       N/A1       $0.1       8.0%        Common        Best Efforts      $1.2
   Resources

   Copper Fox
                     18/10/2011    TSX-V:CUU        N/A1       N/A1       N/A1       $2.0       0.4%        Common        Best Efforts     $545.9
     Metals

  International
                     11/10/2011     TSX-V:IEC      4.1%        0.0%       4.1%       $2.5       25.4%       Common        Best Efforts      $9.8
     Enexco


Note: The chart represents all deals in the respective sector(s) opened on or after 1/5/2011 and closed by 30/4/2012. Dollars raised and market cap listed in million-dollar units.
1Fees unavailable at time of publication.


11 April 2012 Pulse Report: Copper
All Deals: Copper (Cont., 5)
                                                                                  Dollars   % of                                          Market
   Company             Open                       Cash      Warrant      Total                             Security       Financing                   Lead        Co-
                                     Ticker                                        Raised  Market                                         Cap at
    Name               Date                       Fee        Fee          Fee                               Type            Basis                  Underwriter Underwriter
                                                                                  at Close Cap                                           Deal Open
NGEx Resources       11/10/2011     TSX:NGQ        4.0%        0.0%       4.0%       $27.0      6.4%        Common        Best Efforts     $424.5

International PBX
                     11/10/2011    TSX-V:PBX       3.0%        0.0%       3.0%       $1.0       3.8%        Common        Best Efforts      $26.3
     Ventures
   Highbank
                     05/10/2011    TSX-V:HBK       8.0%        0.0%       8.0%       $0.2       5.4%        Common        Best Efforts      $4.1
   Resources

                                                                                                                                                                         Cormark
Castle Resources     29/09/2011     TSX-V:CRI      5.0%        0.0%       5.0%       $6.0       9.9%      Flow-Through    Best Efforts      $60.5       Scotiabank
                                                                                                                                                                         Securities

  Metropolitan
                     23/09/2011    TSX-V:MNZ       8.5%        0.0%       8.5%       $0.4       48.7%       Common        Best Efforts      $0.7
    Mining


  Virgin Metals      23/09/2011    TSX-V:VGM       10.0%      10.0%      20.0%       $1.5       20.5%       Common        Best Efforts      $7.3


 Nitinat Minerals    21/09/2011    TSX-V:NZZ        N/A1       N/A1       N/A1     Cancelled     N/A        Common        Best Efforts      $3.9


   Westridge
                     20/09/2011    TSX-V:WST       8.0%        4.0%      12.0%       $1.2       11.8%       Common        Best Efforts      $9.9
   Resources

   Cascadero
                     13/09/2011    TSX-V:CCD        N/A1       N/A1       N/A1       $1.5       8.5%        Common        Best Efforts      $18.0
    Copper


  Logan Copper       09/09/2011     TSX-V:LC       2.3%        2.2%       4.5%       $0.5       21.4%       Common        Best Efforts      $2.3      EMD Financial


  Logan Copper       09/09/2011     TSX-V:LC       2.3%        2.2%       4.5%       $0.2       6.5%      Flow-Through    Best Efforts      $2.3      EMD Financial


Tigray Resources     08/09/2011     TSX-V:TIG       N/A1       N/A1       N/A1       $5.3       10.1%       Common        Best Efforts      $52.2


    Mukuba
                     07/09/2011    TSX-V:MKU        N/A1       N/A1       N/A1       $2.0       21.6%       Common        Best Efforts      $9.2
   Resources


Note: The chart represents all deals in the respective sector(s) opened on or after 1/5/2011 and closed by 30/4/2012. Dollars raised and market cap listed in million-dollar units.
1Fees unavailable at time of publication.


12 April 2012 Pulse Report: Copper
All Deals: Copper (Cont., 6)
                                                                                  Dollars   % of                                          Market
   Company             Open                       Cash      Warrant      Total                             Security       Financing                   Lead        Co-
                                     Ticker                                        Raised  Market                                         Cap at
    Name               Date                       Fee        Fee          Fee                               Type            Basis                  Underwriter Underwriter
                                                                                  at Close Cap                                           Deal Open
   Copper Fox
                     07/09/2011    TSX-V:CUU        N/A1       N/A1       N/A1       $2.5       0.4%        Common        Best Efforts     $619.3
     Metals

 Miocene Metals      31/08/2011     TSX-V:MII       N/A1       N/A1       N/A1       $0.1       0.7%        Common        Best Efforts      $13.3

   Cascadero
                     15/08/2011    TSX-V:CCD        N/A1       N/A1       N/A1       $0.5       2.9%      Flow-Through    Best Efforts      $16.4
    Copper

    Regulus
                     08/08/2011    TSX-V:REG        N/A1       N/A1       N/A1       $0.7       1.6%        Common        Bought Deal       $44.5
   Resources


 Catalyst Copper     29/07/2011    TSX-V:CCY       2.8%        0.0%       2.8%       $2.1       8.4%        Common        Best Efforts      $25.4


  Pebble Creek
                     28/07/2011    TSX-V:PEB       8.0%        0.0%       8.0%       $0.1       2.7%        Common        Best Efforts      $5.5
     Mining

   Crazy Horse
                     13/07/2011    TSX-V:CZH        N/A1       N/A1       N/A1       $5.2       12.2%       Common        Best Efforts      $42.9
   Resources


 Nevada Copper       07/07/2011     TSX:NCU        5.5%        2.5%       8.0%       $65.1      18.9%       Common        Bought Deal      $345.1       Canaccord       Scotiabank


 WCB Resources       06/07/2011    TSX-V:WCB        N/A1       N/A1       N/A1       $1.0       31.8%       Common        Best Efforts      $3.1


   Crazy Horse
                     04/07/2011    TSX-V:CZH        N/A1       N/A1       N/A1       $5.0       12.7%       Common        Bought Deal       $39.3
   Resources


                                                                                                                                                        Northern
Sego Resources       29/06/2011    TSX-V:SGZ       10.0%       5.0%      15.0%       $1.0       9.8%        Common        Best Efforts      $10.2
                                                                                                                                                        Securities


  Boxxer Gold        23/06/2011    TSX-V:BXX       6.0%        6.8%      12.8%       $0.5       1.5%      Flow-Through    Best Efforts      $34.0     D&D Securities


     Drexel
                     23/06/2011     TSX-V:DX       0.0%        0.0%       6.0%       $2.4      340.0%       Common        Best Efforts      $0.7
   Resources


Note: The chart represents all deals in the respective sector(s) opened on or after 1/5/2011 and closed by 30/4/2012. Dollars raised and market cap listed in million-dollar units.
1Fees unavailable at time of publication.


13 April 2012 Pulse Report: Copper
All Deals: Copper (Cont., 7)
                                                                                  Dollars   % of                                          Market
   Company             Open                       Cash      Warrant      Total                             Security       Financing                   Lead        Co-
                                     Ticker                                        Raised  Market                                         Cap at
    Name               Date                       Fee        Fee          Fee                               Type            Basis                  Underwriter Underwriter
                                                                                  at Close Cap                                           Deal Open
  Slater Mining      21/06/2011    TSX-V:SLM       0.0%        0.0%       0.8%       $0.8       8.0%        Common        Best Efforts      $9.4


  Slater Mining      21/06/2011    TSX-V:SLM       0.0%        0.0%       0.8%       $0.3       2.7%      Flow-Through    Best Efforts      $9.4

                                                                                                                                                                        RK Equity Capital
 Kincora Copper      20/06/2011    TSX-V:KCC       1.0%        3.8%       4.8%       $12.1     522.1%       Common        Best Efforts      $2.3      Ocean Equities
                                                                                                                                                                            Markets

  Virgin Metals      17/06/2011    TSX-V:VGM       8.0%        7.0%      15.0%       $0.3       4.4%        Common        Best Efforts      $7.9


   Serengeti
                     16/06/2011     TSX-V:SIR      6.0%        0.0%       6.0%       $1.3       11.6%     Flow-Through    Best Efforts      $11.3
   Resources


 Panoro Minerals     13/06/2011    TSX-V:PML       5.2%        2.9%       8.1%       $7.8       14.3%       Common        Best Efforts      $54.3       M Partners         Canaccord


  Metropolitan
                     01/06/2011    TSX-V:MNZ        N/A1       N/A1       N/A1     Cancelled     N/A        Common        Best Efforts      $1.0
    Mining

                                                                                                                                                                           Cormark
 Iberian Minerals    31/05/2011     TSX-V:IZN      5.0%        0.0%       5.0%       $76.0      21.1%       Common        Bought Deal      $359.5     Wellington West
                                                                                                                                                                           Securities

 Caribou Copper
                     26/05/2011    TSX-V:CKR       7.4%        7.4%      14.8%       $0.4       10.0%     Flow-Through    Best Efforts      $4.1
   Resources


 Caribou Copper
                     26/05/2011    TSX-V:CKR       6.8%        9.6%      16.4%       $0.8       20.3%       Common        Best Efforts      $4.1
   Resources


Tribune Minerals     19/05/2011    TSX-V:TCB        N/A1       N/A1       N/A1       $4.6       85.0%       Common        Best Efforts      $5.4


Tribune Minerals     19/05/2011    TSX-V:TCB        N/A1       N/A1       N/A1       $3.9       72.1%     Flow-Through    Best Efforts      $5.4


  AKA Ventures       17/05/2011    TSX-V:AKA       5.5%        0.0%       5.5%       $0.6       4.5%        Common        Best Efforts      $14.0


Note: The chart represents all deals in the respective sector(s) opened on or after 1/5/2011 and closed by 30/4/2012. Dollars raised and market cap listed in million-dollar units.
1Fees unavailable at time of publication.


14 April 2012 Pulse Report: Copper
All Deals: Copper (Cont., 8)
                                                                                 Dollars   % of                                          Market
  Company             Open                       Cash      Warrant      Total                             Security       Financing                   Lead        Co-
                                    Ticker                                        Raised  Market                                         Cap at
   Name               Date                       Fee        Fee          Fee                               Type            Basis                  Underwriter Underwriter
                                                                                 at Close Cap                                           Deal Open
  White Tiger
                    06/05/2011    TSX-V:WTC       4.4%       0.0%        4.4%       $0.3       11.2%       Common        Best Efforts      $2.7
   Mining

   Guerrero
                    04/05/2011    TSX-V:GEX       8.0%       8.0%       16.0%       $0.3       5.9%        Common        Best Efforts      $5.2
  Exploration
    CuOro
                    04/05/2011    TSX-V:CUA       7.0%       0.0%        7.0%       $1.6       6.0%        Common        Bought Deal       $26.9
  Resources

    CuOro                                                                                                 Conditional
                    04/05/2011    TSX-V:CUA       7.0%       7.0%       14.0%       $13.4      49.7%                     Bought Deal       $26.9       Canaccord       Scotiabank
  Resources                                                                                                Common


Note: The chart represents all deals in the respective sector(s) opened on or after 1/5/2011 and closed by 30/4/2012. Dollars raised and market cap listed in million-dollar units.


15 April 2012 Pulse Report: Copper
About Us

        Oreninc is a research firm in the junior commodities space. We work to create
        greater transparency and information flow between companies, institutions, and
        investors.

              Research:
                  Sector and region-specific quarterly reports
                  Financing targets based on commodity or area of operation
                  Customized updates on Canadian commodity financings
                  Bespoke research


              Strategic Work:
                  Assess company and project valuations
                  Advise companies on capital structures
                  Target companies with stranded assets
                  Acquire and restructure projects


        The Oreninc team holds your needs above all else and works as an independent
        third party consultant on the terms you want.

16 April 2012 Pulse Report: Copper
2012 Rates
                     Product                               Company & Investor Relations                                         Brokerage & Institutional


            Broker Fee Report                                  Single                       Quarterly                          Single                        Quarterly

                Primary Sector                                $2,500                          $5,000                          $3,500                          $8,000

              Secondary Sector                                $2,000                          $2,500                          $2,500                          $3,500

                                                               Single                             --                           Single                             --
           Sector Pulse Report
                                                               $495                               --                          $1,895                              --

                                                             Monthly                           Yearly                         Monthly                          Yearly
                 Custom ODL
                                                                $50                             $500                              --*                             --*

     Note: Oreninc charges a $1,000 one-week rush fee for a Broker Fee Report requested out of cycle. Visit oreninc.com for a current list of sectors ready for download. Price is
     negotiable on bundled purchases of Sector Pulse Reports. *Brokerage and institutional rates for Custom ODL calculated on a bid by bid basis.


     Strategic Work:
     Oreninc also provides strategic advisement to junior mining companies, acting as a third party consultant on a variety
     of issues including project structuring, raising capital, strategic partnerships, due diligence, and marketing. Oreninc
     does not provide banking, brokering or other financial services.

     Delivery Timeline:
     Broker Fee Reports are updated quarterly and will be delivered by January 16, April 16, July 16, and October 15.
     Sector Pulse Reports are updated six times a year, and the most popular sectors are available for download
     immediately. All other sectors are produced upon request and delivered within three to five business days.


17 April 2012 Pulse Report: Copper
Contact Us


               If you are interested in receiving more information, please contact us.	


                       Benjamin Cox                                     Megan Sweeney
                      Managing Director                                Director of Marketing
                  benjamin.cox@oreninc.com                         megan.sweeney@oreninc.com


                                                400 E Evergreen Blvd.
                                                Vancouver, WA 98660
                                                   (360) 262-6969


                                                      oreninc.com


18 Tear SheetPulse Report:the Institutional Investor: Wellington West
   April 2012 prepared for Copper
Disclaimer
  General Disclaimer
  This report is based on all representative data from 1/1/2011 through 31/12/2011.
  This report is Copyright 2012 Oren Inc., which reserves all rights in and to this report. This report MAY NOT BE REPRODUCED IN ANY FORM, AND IS FOR THE USE OF THE INTENDED RECIPIENT
  ONLY.

  Oren Inc. (“Oreninc”) is a research service providing customized reports for client companies and brokers in the mining and commodities sectors, as well as producing the ODL, a digest, updated daily, of financings in
  the mining and commodities space. This disclaimer statement is an integral part of our service. We believe it is imperative that you read this disclaimer before making any decision related to a financing,
  including the selection of a broker. Oreninc is not an investment bank and does not currently have any investment banking relationships with any of the subject companies or brokers of its reports, nor does Oreninc
  make a market, or act as principal in any securities. Oreninc is not an investment broker-dealer, does not offer securities for purchase or sale, and is not licensed or qualified to provide investment advice. Oreninc
  reports do not constitute a solicitation or recommendation to buy or sell any securities whatsoever.

  All research reports issued by Oreninc are based on public information derived solely from publicly available sources such as, but not limited to, public company filings, company news releases, and financial data. We
  have not verified the accuracy of such public information, nor do we have any obligation or duty to update or correct any public information for any errors, misstatements, or material changes to such public information.
  You, the client, are strongly encouraged to verify all claims through your own thorough and independent research or due diligence. Oreninc research reports containing any valuations or fee targets and/or
  recommendations are believed but not guaranteed to have bases which may be substantiated as reasonable and adequate.

  Oreninc research reports are intended for informational purposes only, and are intended to inform the reader only. Oreninc research reports represent solely the Oreninc Analyst's opinions regarding subject
  companies and brokers at the time of production of the report. The Oreninc Analyst bases his or her opinions exclusively on public information available at the time of production of the report. The Oreninc Analyst
  has not received any material non-public information regarding the subject companies or brokers. All estimates, opinions, and/or recommendations expressed in this report are subject to change without notice, and
  Oreninc is under no requirement to, and shall not, update the opinions and recommendations expressed herein in light of any subsequent events. The price targets presented in Oreninc reports are based explicitly on
  a significant number of our own estimates and assumptions, based solely on previously disclosed public information, and there can be no assurance that our price targets will be met, or whether the assumptions/
  estimates regarding the client company's actual financing outcomes will materialize. We may not publish any of our bases for such estimates and assumptions.

  You should understand that there is no guarantee that past performance by any companies or brokers will be indicative of future results by the same or different companies or brokers. Neither Oreninc
  nor any of its analysts, directors, or employees shall be liable to you, or anyone else, for any loss or damages resulting from the use of its research reports, opinions, and/or recommendations caused in whole or in
  part by negligence or contingencies beyond its control in procuring, compiling, interpreting, or reporting its research contents. Oreninc disclaims any and all liability as to the completeness or accuracy of the
  information contained in, and any omissions of material facts in, its reports.

  Client companies should consider Oreninc reports as only a single factor in making a financing decision, and should not rely solely on the recommendations and opinions contained therein. Any recommendation
  should not be taken as a substitute for the exercise of independent judgment and due diligence of the merits and risks of financings.
  Oreninc was not compensated by any bank, investment bank, broker, or other third party individual or entity for the production of this report. This research report is paid for on a fixed fee basis by the client
  company. Oreninc has in place several business practices to ensure complete and objective editorial control over its research, including, but not limited to, the following: 1) No part of Oreninc research analysts'
  compensation is related to the level of investment banking fees, stock price, or trading commission revenue generated by any of Oreninc's clients; 2) Fees for research services are due and payable regardless of the
  opinion of the research; 3) Oreninc research analysts are not permitted to directly or indirectly promise any client company that they will generate a favorable research report or any specific price target; 4) Oreninc
  research analysts pledge that their reports accurately reflect their personal views about the subject securities and that none of their compensation was, is, or will be directly or indirectly related to the specific
  recommendations contained in their research reports; 5) Oreninc research analysts are not permitted to accept any additional compensation or fees from client companies beyond what has already been paid to
  Oreninc for research services.
  Oreninc and its directors, employees, and analysts may from time to time purchase or sell securities in the open markets. However, once a research relationship has been initiated between Oreninc and the client, and
  unless a position in the client’s securities was established by the Analyst or any member of his household prior to the initiation of the research relationship, Oreninc research analysts and their households are
  prohibited from executing trades in the securities of such client companies. Analysts personally holding a position in the client’s securities, or whose family members hold such a position, are prohibited from
  contributing to any research report developed for the client.

  FORWARD-LOOKING STATEMENTS (SAFE HARBOR STATEMENT): The information set forth in Oreninc Research reports may contain "forward-looking statements" subject to certain risks and uncertainties that
  could cause actual future results, performance or achievements to differ materially from any historical results. Statements in reports which are not purely historical in nature, including statements regarding beliefs,
  plans, expectations or intentions regarding the future, are forward-looking. Statements that are not historical facts, including statements that are preceded by, followed by, or that include such words as "estimate,"
  "anticipate," "believe," "plan", "intend", "expect", "may" or "should" or similar statements, are forward-looking statements. Risks and uncertainties include, but are not limited to, the risks associated with the impact of
  general economic conditions, competitive companies, market acceptance, and the availability of high quality, qualified personnel and management. Other risks include but are not limited to factors affecting access to
  capital to meet all of the client company’s financial requirements, and the company’s ability to control costs. There can be no assurance that client company’s efforts will succeed and ultimately achieve sustained
  commercial success. These forward-looking statements are made as of the date of the report, and Oreninc does not assume any obligation to update the forward-looking statements, or to update the reasons why
  actual results could differ from those projected in the forward-looking statements. There can be no assurance that beliefs, plans, expectations or intentions of persons producing data upon which Oreninc analysts rely
  in this report will prove to be accurate.


19 April 2012 Pulse Report: Copper

Copper Pulse 4 30 2012

  • 1.
    Sector   30 April   Pulse Report 2012 Copper Disclaimer: Information and recommendations herein are the opinions of the Oreninc Analyst only. Data utilized is believed to be accurate and reliable as of the date of this report. You should independently verify all data herein. Data was not reviewed, supplied or amended by any bank or third party prior to production of this report.
  • 2.
    Broker Fee Charts Broker Fees by Market Cap: All Sectors Average Cash Fee Average Total Fee 14% When looking at a financing, it is important 12% to remember: the smaller the market cap, 10% the higher the fees. 8% 6% 4% 2% 0% $0-$10 $10-$25 $25-$50 $50-$100 $100-$500 Broker Fees: Copper Average Cash Fee Average Total Fee This chart represents the fees charged by 16% 14% each broker in the copper sector. The 12% 10% numerical values listed on page 5 can be 8% used for negotiating purposes. 6% 4% 2% 0% Note: The charts represent all brokered deals in the respective sector(s) opened on or after 1/5/2011 and closed by 30/4/2012. Market cap listed in million-dollar units. 2 April 2012 Pulse Report: Copper
  • 3.
    Broker Efficiency Average Deal Size: Copper Choose a broker who has completed 80 70 offerings of similar size to your deal, but 60 Millions keep in mind that these are averages. 50 40 Sometimes a broker completes one large 30 20 offering and several small ones, which 10 skews the average deal size. Therefore, it 0 is important to review the table in the back. Average Time to Close: Copper We care about broker efficiency. The speed 80 at which a broker moves a transaction from 70 60 announcement to completion is a good 50 Days indication of their ability to deliver a 40 30 successful raise. 20 10 0 Note: The charts represent all brokered deals in the respective sector(s) opened on or after 1/5/2011 and closed by 30/4/2012. 3 April 2012 Pulse Report: Copper
  • 4.
    Broker Sector Focus % of Brokers Total Book: Copper 120% 100% The percentage of a broker’s total lead in 80% your sector gives you a sense of how 60% material your sector is for their business. 40% 20% 0% Money raised in copper will show which Money Raised: Copper brokers have a track record of raising $90 $80 money for your sector. $70 $60 Millions $50 $40 $30 $20 $10 $0 Note: The charts represent all brokered deals in the respective sector(s) opened on or after 1/5/2011 and closed by 30/4/2012. 4 April 2012 Pulse Report: Copper
  • 5.
    Copper Brokers % of Deals Average Average Cash Warrant Total Total Total Average Deal % of Total Broker with Days to Subscription Fee Fee Fee Raised Deals Size Book Warrants Close Rate Canaccord 5.8% 3.3% 9.0% $78.5 2 $39.2 13.0% 50.0% 26.5 100.0% Casimir 6.0% 6.0% 12.0% $2.1 1 $2.1 0.7% 100.0% 14.0 101.0% Capital D&D Securities 6.0% 6.8% 12.8% $0.5 1 $0.5 1.9% 100.0% 69.0 43.8% Dundee 5.0% 5.0% 10.0% $26.7 1 $26.7 10.8% 100.0% 27.0 133.4% Securities EMD Financial 2.3% 2.2% 4.5% $0.6 2 $0.3 100.0% 100.0% 70.0 218.6% M Partners 5.2% 2.9% 8.1% $7.8 1 $7.8 48.7% 100.0% 24.0 96.9% Mackie 6.0% 6.0% 12.0% $10.0 2 $5.0 13.7% 0.0% 14.0 125.6% Research Macquarie 7.0% 7.0% 14.0% $13.8 1 $13.8 10.6% 100.0% 15.0 138.0% NCP 5.2% 5.1% 10.3% $3.3 2 $1.7 30.1% 100.0% 56.0 47.8% Northern 10.0% 5.0% 15.0% $1.0 1 $1.0 100.0% 100.0% 28.0 100.0% Securities Ocean Equities 1.0% 3.8% 4.8% $12.1 1 $12.1 100.0% 0.0% 25.0 89.9% PI Financial 10.0% 0.0% 10.0% $0.5 1 $0.5 3.9% 0.0% 6.0 100.0% Raymond 5.0% 0.0% 5.0% $15.0 1 $15.0 21.7% 0.0% 15.0 100.0% James Salman 6.5% 6.5% 13.0% $1.5 1 $1.5 5.4% 0.0% 23.0 100.0% Partners Note: The chart represents all brokered deals in the respective sector(s) opened on or after 1/5/2011 and closed by 30/4/2012. Average deal size and total raised listed in million- dollar units. 5 April 2012 Pulse Report: Copper
  • 6.
    Copper Brokers % of Deals Average Average Cash Warrant Total Total Total Average Deal % of Total Broker with Days to Subscription Fee Fee Fee Raised Deals Size Book Warrants Close Rate Scotiabank 5.0% 0.0% 5.0% $6.0 1 $6.0 6.5% 0.0% 20.0 100.0% Wellington West 5.0% 0.0% 5.0% $76.0 1 $76.0 100.0% 0.0% 24.0 122.6% Brokered 5.2% 2.6% 7.8% $255.4 20 $12.8 0.0% 52.4% 31.2 110.5% Average Non-Brokered 4.4% 1.1% 5.6% $212.4 88 $2.4 0.0% 70.5% 40.3 92.5% Average Note: The chart represents all brokered deals in the respective sector(s) opened on or after 1/5/2011 and closed by 30/4/2012. Average deal size and total raised listed in million- dollar units. 6 April 2012 Pulse Report: Copper
  • 7.
    All Deals: Copper Dollars % of Market Company Open Cash Warrant Total Security Financing Lead Co- Ticker Raised Market Cap at Name Date Fee Fee Fee Type Basis Underwriter Underwriter at Close Cap Deal Open Quaterra 13/04/2012 TSX-V:QTA N/A1 N/A1 N/A1 $2.5 3.9% Common Best Efforts $64.0 Resources International PBX 12/04/2012 TSX-V:PBX N/A1 N/A1 N/A1 $0.7 4.9% Common Best Efforts $13.7 Ventures Enertopia 09/04/2012 CNSX:TOP 7.0% 7.0% 14.0% $0.2 13.2% Common Best Efforts $1.6 Toro Resources 29/03/2012 TSX-V:TRK 8.0% 8.0% 16.0% Cancelled N/A Common Best Efforts $5.4 Castle Resources 15/03/2012 TSX-V:CRI 6.0% 6.0% 12.0% $6.6 12.6% Flow-Through Bought Deal $52.7 Mackie Research Scotiabank Castle Resources 15/03/2012 TSX-V:CRI 6.0% 6.0% 12.0% $3.4 6.4% Common Bought Deal $52.7 Mackie Research Scotiabank WCB Resources 09/03/2012 TSX-V:WCB 6.0% 6.0% 12.0% $2.1 12.2% Common Best Efforts $17.0 Casimir Capital Highbank 28/02/2012 TSX-V:HBK 8.0% 8.0% 16.0% $0.7 9.9% Common Best Efforts $7.0 Resources Cascadero 24/02/2012 TSX-V:CCD N/A1 N/A1 N/A1 $0.1 0.5% Common Best Efforts $19.6 Copper Equinox 23/02/2012 TSX-V:EQX 3.8% 3.0% 6.8% $1.3 25.2% Common Best Efforts $5.3 Exploration Panoro Minerals 22/02/2012 TSX-V:PML 7.0% 7.0% 14.0% $13.8 15.2% Common Bought Deal $90.9 Macquarie M Partners Andover Mining 16/02/2012 TSX-V:AOX N/A1 N/A1 N/A1 $1.4 2.9% Common Best Efforts $49.2 Abacus Mining and 15/02/2012 TSX-V:AME 6.0% 0.0% 6.0% $3.2 6.9% Common Best Efforts $46.4 Exploration Note: The chart represents all deals in the respective sector(s) opened on or after 1/5/2011 and closed by 30/4/2012. Dollars raised and market cap listed in million-dollar units. 1Fees unavailable at time of publication. 7 April 2012 Pulse Report: Copper
  • 8.
    All Deals: Copper(Cont.) Dollars % of Market Company Open Cash Warrant Total Security Financing Lead Co- Ticker Raised Market Cap at Name Date Fee Fee Fee Type Basis Underwriter Underwriter at Close Cap Deal Open Westminster 09/02/2012 TSX-V:WMR N/A1 N/A1 N/A1 $0.9 8.2% Common Best Efforts $10.6 Resources Snowfield 09/02/2012 TSX-V:SNO 1.4% 0.0% 1.4% $0.5 25.2% Common Best Efforts $2.1 Development Regulus Conditional Dundee Axemen 08/02/2012 TSX-V:PMA 5.0% 5.0% 10.0% $26.7 55.8% Bought Deal $47.8 Resources Common Securities Resource Northisle Copper 08/02/2012 TSX-V:NCX 6.5% 6.5% 13.0% $1.5 9.5% Flow-Through Best Efforts $15.9 Salman Partners and Gold White Tiger 07/02/2012 TSX-V:WTC 1.5% 1.5% 3.0% $0.6 17.1% Common Best Efforts $3.4 Mining VMS Ventures 01/02/2012 TSX-V:VMS 6.0% 3.0% 9.0% $2.5 5.0% Flow-Through Best Efforts $48.8 Lions Gate 31/01/2012 TSX-V:LGM 3.3% 0.0% 3.3% $0.4 4.2% Common Best Efforts $9.4 Metals Lions Gate 31/01/2012 TSX-V:LGM 3.3% 0.0% 3.3% $0.5 4.9% Flow-Through Best Efforts $9.4 Metals Salazar 30/01/2012 TSX-V:SRL 2.0% 0.0% 2.0% $3.0 16.0% Common Best Efforts $18.8 Resources African Metals 27/01/2012 TSX-V:AFR 7.5% 7.5% 15.0% $1.3 8.9% Common Best Efforts $14.4 Hana Mining 26/01/2012 TSX-V:HMG 2.9% 0.0% 2.9% $14.9 11.6% Common Best Efforts $129.1 International PBX 24/01/2012 TSX-V:PBX 0.7% 0.0% 0.7% $0.6 2.6% Common Best Efforts $22.7 Ventures Catalyst Copper 23/01/2012 TSX-V:CCY 3.0% 0.0% 3.0% $3.5 13.3% Common Best Efforts $26.5 Note: The chart represents all deals in the respective sector(s) opened on or after 1/5/2011 and closed by 30/4/2012. Dollars raised and market cap listed in million-dollar units. 1Fees unavailable at time of publication. 8 April 2012 Pulse Report: Copper
  • 9.
    All Deals: Copper(Cont., 2) Dollars % of Market Company Open Cash Warrant Total Security Financing Lead Co- Ticker Raised Market Cap at Name Date Fee Fee Fee Type Basis Underwriter Underwriter at Close Cap Deal Open Terra Firma 20/01/2012 TSX-V:TFR 6.7% 0.0% 6.7% $0.4 32.6% Common Best Efforts $1.1 Resources Oracle Mining 19/01/2012 TSX:OMN 6.0% 0.0% 6.0% $9.8 24.8% Common Best Efforts $39.3 Copper Fox 18/01/2012 TSX-V:CUU N/A1 N/A1 N/A1 $2.2 0.5% Common Best Efforts $426.1 Metals Niblack Mineral 29/12/2011 TSX-V:NIB 10.0% 0.0% 10.0% $0.5 7.3% Common Best Efforts $6.5 PI Financial Development Los Andes 23/12/2011 TSX-V:LA N/A1 N/A1 N/A1 $0.8 1.5% Common Best Efforts $51.0 Copper Caribou King 22/12/2011 TSX-V:CKR 10.0% 0.0% 10.0% $0.2 5.0% Flow-Through Best Efforts $3.9 Resources Doubleview 20/12/2011 TSX-V:DBV N/A1 N/A1 N/A1 $0.1 21.2% Flow-Through Best Efforts $0.5 Capital Snowfield 12/12/2011 TSX-V:SNO 3.6% 0.0% 5.1% $0.3 16.0% Common Best Efforts $1.7 Development Millstream Mines 12/12/2011 TSX-V:MLM 10.0% 0.0% 10.0% $0.1 5.8% Common Best Efforts $1.9 Millstream Mines 12/12/2011 TSX-V:MLM 10.0% 0.0% 10.0% $0.04 2.1% Flow-Through Best Efforts $1.9 International PBX 09/12/2011 TSX-V:PBX N/A1 N/A1 N/A1 Cancelled N/A Common Best Efforts $31.6 Ventures Red Crescent 01/12/2011 TSX:RCB 0.5% 0.5% 1.0% $0.3 1.0% Common Best Efforts $28.0 Resources Rockcliff 01/12/2011 TSX-V:RCR 8.0% 8.0% 16.0% $2.2 34.2% Flow-Through Best Efforts $6.5 Resources Note: The chart represents all deals in the respective sector(s) opened on or after 1/5/2011 and closed by 30/4/2012. Dollars raised and market cap listed in million-dollar units. 1Fees unavailable at time of publication. 9 April 2012 Pulse Report: Copper
  • 10.
    All Deals: Copper(Cont., 3) Dollars % of Market Company Open Cash Warrant Total Security Financing Lead Co- Ticker Raised Market Cap at Name Date Fee Fee Fee Type Basis Underwriter Underwriter at Close Cap Deal Open Rockcliff 01/12/2011 TSX-V:RCR 8.0% 8.0% 16.0% $0.04 0.5% Common Best Efforts $6.5 Resources Redtail Metals 30/11/2011 TSX-V:RTZ 1.2% 0.0% 1.2% $0.5 15.4% Common Best Efforts $3.2 PolyMet Mining 30/11/2011 TSX:POM N/A1 N/A1 N/A1 $20.0 10.3% Common Best Efforts $193.4 Lumina Copper 23/11/2011 TSX-V:LCC 5.0% 0.0% 5.0% $15.0 3.8% Common Best Efforts $397.9 Lumina Copper 23/11/2011 TSX-V:LCC 5.0% 0.0% 5.0% $15.0 3.8% Common Best Efforts $397.9 Raymond James Scotiabank El Nino 21/11/2011 TSX-V:ELN 4.2% 4.0% 8.2% $0.5 7.8% Flow-Through Best Efforts $6.4 Ventures El Nino 21/11/2011 TSX-V:ELN 4.2% 4.0% 8.2% $1.0 15.7% Common Best Efforts $6.4 Ventures Boxxer Gold 17/11/2011 TSX-V:BXX 9.0% 9.0% 18.0% $1.2 5.2% Flow-Through Best Efforts $22.3 Boxxer Gold 17/11/2011 TSX-V:BXX 9.0% 9.0% 18.0% $1.1 4.9% Common Best Efforts $22.3 Copper Fox 17/11/2011 TSX-V:CUU N/A1 N/A1 N/A1 $4.0 0.9% Common Best Efforts $468.1 Metals Mercator 17/11/2011 TSX:ML 2.7% 0.0% 2.7% $20.0 4.7% Common Best Efforts $422.3 Minerals Network 10/11/2011 TSX-V:NET N/A1 N/A1 N/A1 $0.9 42.9% Common Best Efforts $2.0 Exploration Westminster 04/11/2011 TSX-V:WMR 5.4% 4.0% 9.4% $1.2 15.7% Common Best Efforts $7.7 Resources Note: The chart represents all deals in the respective sector(s) opened on or after 1/5/2011 and closed by 30/4/2012. Dollars raised and market cap listed in million-dollar units. 1Fees unavailable at time of publication. 10 April 2012 Pulse Report: Copper
  • 11.
    All Deals: Copper(Cont., 4) Dollars % of Market Company Open Cash Warrant Total Security Financing Lead Co- Ticker Raised Market Cap at Name Date Fee Fee Fee Type Basis Underwriter Underwriter at Close Cap Deal Open Copper North 03/11/2011 TSX-V:COL N/A1 N/A1 N/A1 $0.2 1.5% Common Best Efforts $13.0 Mining Guerrero 02/11/2011 TSX-V:GEX 7.2% 0.0% 13.2% $1.0 25.9% Common Best Efforts $3.7 Exploration Cresval Capital 01/11/2011 TSX-V:CRV N/A1 N/A1 N/A1 $0.1 2.8% Flow-Through Best Efforts $1.8 Telferscot 28/10/2011 CNSX:TFS N/A1 N/A1 N/A1 $1.0 23.4% Common Best Efforts $4.3 Resources Cadillac Ventures 26/10/2011 TSX-V:CDC 5.2% 5.1% 10.3% $2.5 9.5% Flow-Through Best Efforts $26.8 NCP Cadillac Ventures 26/10/2011 TSX-V:CDC 5.2% 5.1% 10.3% $0.8 3.0% Common Best Efforts $26.8 NCP Black Smoker 26/10/2011 CNSX:BSM 6.0% 6.0% 12.0% $1.2 45.0% Common Best Efforts $2.8 Ventures Bellhaven Copper 26/10/2011 TSX-V:BHV N/A1 N/A1 N/A1 $6.1 15.9% Common Bought Deal $38.0 & Gold Happy Creek 25/10/2011 TSX-V:HPY 8.0% 10.0% 18.0% $0.7 5.9% Common Best Efforts $11.3 Minerals Happy Creek 25/10/2011 TSX-V:HPY 7.0% 8.0% 15.0% $2.2 19.8% Flow-Through Best Efforts $11.3 Minerals Greenock 20/10/2011 TSX-V:GKR N/A1 N/A1 N/A1 $0.1 8.0% Common Best Efforts $1.2 Resources Copper Fox 18/10/2011 TSX-V:CUU N/A1 N/A1 N/A1 $2.0 0.4% Common Best Efforts $545.9 Metals International 11/10/2011 TSX-V:IEC 4.1% 0.0% 4.1% $2.5 25.4% Common Best Efforts $9.8 Enexco Note: The chart represents all deals in the respective sector(s) opened on or after 1/5/2011 and closed by 30/4/2012. Dollars raised and market cap listed in million-dollar units. 1Fees unavailable at time of publication. 11 April 2012 Pulse Report: Copper
  • 12.
    All Deals: Copper(Cont., 5) Dollars % of Market Company Open Cash Warrant Total Security Financing Lead Co- Ticker Raised Market Cap at Name Date Fee Fee Fee Type Basis Underwriter Underwriter at Close Cap Deal Open NGEx Resources 11/10/2011 TSX:NGQ 4.0% 0.0% 4.0% $27.0 6.4% Common Best Efforts $424.5 International PBX 11/10/2011 TSX-V:PBX 3.0% 0.0% 3.0% $1.0 3.8% Common Best Efforts $26.3 Ventures Highbank 05/10/2011 TSX-V:HBK 8.0% 0.0% 8.0% $0.2 5.4% Common Best Efforts $4.1 Resources Cormark Castle Resources 29/09/2011 TSX-V:CRI 5.0% 0.0% 5.0% $6.0 9.9% Flow-Through Best Efforts $60.5 Scotiabank Securities Metropolitan 23/09/2011 TSX-V:MNZ 8.5% 0.0% 8.5% $0.4 48.7% Common Best Efforts $0.7 Mining Virgin Metals 23/09/2011 TSX-V:VGM 10.0% 10.0% 20.0% $1.5 20.5% Common Best Efforts $7.3 Nitinat Minerals 21/09/2011 TSX-V:NZZ N/A1 N/A1 N/A1 Cancelled N/A Common Best Efforts $3.9 Westridge 20/09/2011 TSX-V:WST 8.0% 4.0% 12.0% $1.2 11.8% Common Best Efforts $9.9 Resources Cascadero 13/09/2011 TSX-V:CCD N/A1 N/A1 N/A1 $1.5 8.5% Common Best Efforts $18.0 Copper Logan Copper 09/09/2011 TSX-V:LC 2.3% 2.2% 4.5% $0.5 21.4% Common Best Efforts $2.3 EMD Financial Logan Copper 09/09/2011 TSX-V:LC 2.3% 2.2% 4.5% $0.2 6.5% Flow-Through Best Efforts $2.3 EMD Financial Tigray Resources 08/09/2011 TSX-V:TIG N/A1 N/A1 N/A1 $5.3 10.1% Common Best Efforts $52.2 Mukuba 07/09/2011 TSX-V:MKU N/A1 N/A1 N/A1 $2.0 21.6% Common Best Efforts $9.2 Resources Note: The chart represents all deals in the respective sector(s) opened on or after 1/5/2011 and closed by 30/4/2012. Dollars raised and market cap listed in million-dollar units. 1Fees unavailable at time of publication. 12 April 2012 Pulse Report: Copper
  • 13.
    All Deals: Copper(Cont., 6) Dollars % of Market Company Open Cash Warrant Total Security Financing Lead Co- Ticker Raised Market Cap at Name Date Fee Fee Fee Type Basis Underwriter Underwriter at Close Cap Deal Open Copper Fox 07/09/2011 TSX-V:CUU N/A1 N/A1 N/A1 $2.5 0.4% Common Best Efforts $619.3 Metals Miocene Metals 31/08/2011 TSX-V:MII N/A1 N/A1 N/A1 $0.1 0.7% Common Best Efforts $13.3 Cascadero 15/08/2011 TSX-V:CCD N/A1 N/A1 N/A1 $0.5 2.9% Flow-Through Best Efforts $16.4 Copper Regulus 08/08/2011 TSX-V:REG N/A1 N/A1 N/A1 $0.7 1.6% Common Bought Deal $44.5 Resources Catalyst Copper 29/07/2011 TSX-V:CCY 2.8% 0.0% 2.8% $2.1 8.4% Common Best Efforts $25.4 Pebble Creek 28/07/2011 TSX-V:PEB 8.0% 0.0% 8.0% $0.1 2.7% Common Best Efforts $5.5 Mining Crazy Horse 13/07/2011 TSX-V:CZH N/A1 N/A1 N/A1 $5.2 12.2% Common Best Efforts $42.9 Resources Nevada Copper 07/07/2011 TSX:NCU 5.5% 2.5% 8.0% $65.1 18.9% Common Bought Deal $345.1 Canaccord Scotiabank WCB Resources 06/07/2011 TSX-V:WCB N/A1 N/A1 N/A1 $1.0 31.8% Common Best Efforts $3.1 Crazy Horse 04/07/2011 TSX-V:CZH N/A1 N/A1 N/A1 $5.0 12.7% Common Bought Deal $39.3 Resources Northern Sego Resources 29/06/2011 TSX-V:SGZ 10.0% 5.0% 15.0% $1.0 9.8% Common Best Efforts $10.2 Securities Boxxer Gold 23/06/2011 TSX-V:BXX 6.0% 6.8% 12.8% $0.5 1.5% Flow-Through Best Efforts $34.0 D&D Securities Drexel 23/06/2011 TSX-V:DX 0.0% 0.0% 6.0% $2.4 340.0% Common Best Efforts $0.7 Resources Note: The chart represents all deals in the respective sector(s) opened on or after 1/5/2011 and closed by 30/4/2012. Dollars raised and market cap listed in million-dollar units. 1Fees unavailable at time of publication. 13 April 2012 Pulse Report: Copper
  • 14.
    All Deals: Copper(Cont., 7) Dollars % of Market Company Open Cash Warrant Total Security Financing Lead Co- Ticker Raised Market Cap at Name Date Fee Fee Fee Type Basis Underwriter Underwriter at Close Cap Deal Open Slater Mining 21/06/2011 TSX-V:SLM 0.0% 0.0% 0.8% $0.8 8.0% Common Best Efforts $9.4 Slater Mining 21/06/2011 TSX-V:SLM 0.0% 0.0% 0.8% $0.3 2.7% Flow-Through Best Efforts $9.4 RK Equity Capital Kincora Copper 20/06/2011 TSX-V:KCC 1.0% 3.8% 4.8% $12.1 522.1% Common Best Efforts $2.3 Ocean Equities Markets Virgin Metals 17/06/2011 TSX-V:VGM 8.0% 7.0% 15.0% $0.3 4.4% Common Best Efforts $7.9 Serengeti 16/06/2011 TSX-V:SIR 6.0% 0.0% 6.0% $1.3 11.6% Flow-Through Best Efforts $11.3 Resources Panoro Minerals 13/06/2011 TSX-V:PML 5.2% 2.9% 8.1% $7.8 14.3% Common Best Efforts $54.3 M Partners Canaccord Metropolitan 01/06/2011 TSX-V:MNZ N/A1 N/A1 N/A1 Cancelled N/A Common Best Efforts $1.0 Mining Cormark Iberian Minerals 31/05/2011 TSX-V:IZN 5.0% 0.0% 5.0% $76.0 21.1% Common Bought Deal $359.5 Wellington West Securities Caribou Copper 26/05/2011 TSX-V:CKR 7.4% 7.4% 14.8% $0.4 10.0% Flow-Through Best Efforts $4.1 Resources Caribou Copper 26/05/2011 TSX-V:CKR 6.8% 9.6% 16.4% $0.8 20.3% Common Best Efforts $4.1 Resources Tribune Minerals 19/05/2011 TSX-V:TCB N/A1 N/A1 N/A1 $4.6 85.0% Common Best Efforts $5.4 Tribune Minerals 19/05/2011 TSX-V:TCB N/A1 N/A1 N/A1 $3.9 72.1% Flow-Through Best Efforts $5.4 AKA Ventures 17/05/2011 TSX-V:AKA 5.5% 0.0% 5.5% $0.6 4.5% Common Best Efforts $14.0 Note: The chart represents all deals in the respective sector(s) opened on or after 1/5/2011 and closed by 30/4/2012. Dollars raised and market cap listed in million-dollar units. 1Fees unavailable at time of publication. 14 April 2012 Pulse Report: Copper
  • 15.
    All Deals: Copper(Cont., 8) Dollars % of Market Company Open Cash Warrant Total Security Financing Lead Co- Ticker Raised Market Cap at Name Date Fee Fee Fee Type Basis Underwriter Underwriter at Close Cap Deal Open White Tiger 06/05/2011 TSX-V:WTC 4.4% 0.0% 4.4% $0.3 11.2% Common Best Efforts $2.7 Mining Guerrero 04/05/2011 TSX-V:GEX 8.0% 8.0% 16.0% $0.3 5.9% Common Best Efforts $5.2 Exploration CuOro 04/05/2011 TSX-V:CUA 7.0% 0.0% 7.0% $1.6 6.0% Common Bought Deal $26.9 Resources CuOro Conditional 04/05/2011 TSX-V:CUA 7.0% 7.0% 14.0% $13.4 49.7% Bought Deal $26.9 Canaccord Scotiabank Resources Common Note: The chart represents all deals in the respective sector(s) opened on or after 1/5/2011 and closed by 30/4/2012. Dollars raised and market cap listed in million-dollar units. 15 April 2012 Pulse Report: Copper
  • 16.
    About Us Oreninc is a research firm in the junior commodities space. We work to create greater transparency and information flow between companies, institutions, and investors. Research: Sector and region-specific quarterly reports Financing targets based on commodity or area of operation Customized updates on Canadian commodity financings Bespoke research Strategic Work: Assess company and project valuations Advise companies on capital structures Target companies with stranded assets Acquire and restructure projects The Oreninc team holds your needs above all else and works as an independent third party consultant on the terms you want. 16 April 2012 Pulse Report: Copper
  • 17.
    2012 Rates Product Company & Investor Relations Brokerage & Institutional Broker Fee Report Single Quarterly Single Quarterly Primary Sector $2,500 $5,000 $3,500 $8,000 Secondary Sector $2,000 $2,500 $2,500 $3,500 Single -- Single -- Sector Pulse Report $495 -- $1,895 -- Monthly Yearly Monthly Yearly Custom ODL $50 $500 --* --* Note: Oreninc charges a $1,000 one-week rush fee for a Broker Fee Report requested out of cycle. Visit oreninc.com for a current list of sectors ready for download. Price is negotiable on bundled purchases of Sector Pulse Reports. *Brokerage and institutional rates for Custom ODL calculated on a bid by bid basis. Strategic Work: Oreninc also provides strategic advisement to junior mining companies, acting as a third party consultant on a variety of issues including project structuring, raising capital, strategic partnerships, due diligence, and marketing. Oreninc does not provide banking, brokering or other financial services. Delivery Timeline: Broker Fee Reports are updated quarterly and will be delivered by January 16, April 16, July 16, and October 15. Sector Pulse Reports are updated six times a year, and the most popular sectors are available for download immediately. All other sectors are produced upon request and delivered within three to five business days. 17 April 2012 Pulse Report: Copper
  • 18.
    Contact Us If you are interested in receiving more information, please contact us.   Benjamin Cox Megan Sweeney Managing Director Director of Marketing benjamin.cox@oreninc.com megan.sweeney@oreninc.com 400 E Evergreen Blvd. Vancouver, WA 98660 (360) 262-6969 oreninc.com 18 Tear SheetPulse Report:the Institutional Investor: Wellington West April 2012 prepared for Copper
  • 19.
    Disclaimer GeneralDisclaimer This report is based on all representative data from 1/1/2011 through 31/12/2011. This report is Copyright 2012 Oren Inc., which reserves all rights in and to this report. This report MAY NOT BE REPRODUCED IN ANY FORM, AND IS FOR THE USE OF THE INTENDED RECIPIENT ONLY. Oren Inc. (“Oreninc”) is a research service providing customized reports for client companies and brokers in the mining and commodities sectors, as well as producing the ODL, a digest, updated daily, of financings in the mining and commodities space. This disclaimer statement is an integral part of our service. We believe it is imperative that you read this disclaimer before making any decision related to a financing, including the selection of a broker. Oreninc is not an investment bank and does not currently have any investment banking relationships with any of the subject companies or brokers of its reports, nor does Oreninc make a market, or act as principal in any securities. Oreninc is not an investment broker-dealer, does not offer securities for purchase or sale, and is not licensed or qualified to provide investment advice. Oreninc reports do not constitute a solicitation or recommendation to buy or sell any securities whatsoever. All research reports issued by Oreninc are based on public information derived solely from publicly available sources such as, but not limited to, public company filings, company news releases, and financial data. We have not verified the accuracy of such public information, nor do we have any obligation or duty to update or correct any public information for any errors, misstatements, or material changes to such public information. You, the client, are strongly encouraged to verify all claims through your own thorough and independent research or due diligence. Oreninc research reports containing any valuations or fee targets and/or recommendations are believed but not guaranteed to have bases which may be substantiated as reasonable and adequate. Oreninc research reports are intended for informational purposes only, and are intended to inform the reader only. Oreninc research reports represent solely the Oreninc Analyst's opinions regarding subject companies and brokers at the time of production of the report. The Oreninc Analyst bases his or her opinions exclusively on public information available at the time of production of the report. The Oreninc Analyst has not received any material non-public information regarding the subject companies or brokers. All estimates, opinions, and/or recommendations expressed in this report are subject to change without notice, and Oreninc is under no requirement to, and shall not, update the opinions and recommendations expressed herein in light of any subsequent events. The price targets presented in Oreninc reports are based explicitly on a significant number of our own estimates and assumptions, based solely on previously disclosed public information, and there can be no assurance that our price targets will be met, or whether the assumptions/ estimates regarding the client company's actual financing outcomes will materialize. We may not publish any of our bases for such estimates and assumptions. You should understand that there is no guarantee that past performance by any companies or brokers will be indicative of future results by the same or different companies or brokers. Neither Oreninc nor any of its analysts, directors, or employees shall be liable to you, or anyone else, for any loss or damages resulting from the use of its research reports, opinions, and/or recommendations caused in whole or in part by negligence or contingencies beyond its control in procuring, compiling, interpreting, or reporting its research contents. Oreninc disclaims any and all liability as to the completeness or accuracy of the information contained in, and any omissions of material facts in, its reports. Client companies should consider Oreninc reports as only a single factor in making a financing decision, and should not rely solely on the recommendations and opinions contained therein. Any recommendation should not be taken as a substitute for the exercise of independent judgment and due diligence of the merits and risks of financings. Oreninc was not compensated by any bank, investment bank, broker, or other third party individual or entity for the production of this report. This research report is paid for on a fixed fee basis by the client company. Oreninc has in place several business practices to ensure complete and objective editorial control over its research, including, but not limited to, the following: 1) No part of Oreninc research analysts' compensation is related to the level of investment banking fees, stock price, or trading commission revenue generated by any of Oreninc's clients; 2) Fees for research services are due and payable regardless of the opinion of the research; 3) Oreninc research analysts are not permitted to directly or indirectly promise any client company that they will generate a favorable research report or any specific price target; 4) Oreninc research analysts pledge that their reports accurately reflect their personal views about the subject securities and that none of their compensation was, is, or will be directly or indirectly related to the specific recommendations contained in their research reports; 5) Oreninc research analysts are not permitted to accept any additional compensation or fees from client companies beyond what has already been paid to Oreninc for research services. Oreninc and its directors, employees, and analysts may from time to time purchase or sell securities in the open markets. However, once a research relationship has been initiated between Oreninc and the client, and unless a position in the client’s securities was established by the Analyst or any member of his household prior to the initiation of the research relationship, Oreninc research analysts and their households are prohibited from executing trades in the securities of such client companies. Analysts personally holding a position in the client’s securities, or whose family members hold such a position, are prohibited from contributing to any research report developed for the client. FORWARD-LOOKING STATEMENTS (SAFE HARBOR STATEMENT): The information set forth in Oreninc Research reports may contain "forward-looking statements" subject to certain risks and uncertainties that could cause actual future results, performance or achievements to differ materially from any historical results. Statements in reports which are not purely historical in nature, including statements regarding beliefs, plans, expectations or intentions regarding the future, are forward-looking. Statements that are not historical facts, including statements that are preceded by, followed by, or that include such words as "estimate," "anticipate," "believe," "plan", "intend", "expect", "may" or "should" or similar statements, are forward-looking statements. Risks and uncertainties include, but are not limited to, the risks associated with the impact of general economic conditions, competitive companies, market acceptance, and the availability of high quality, qualified personnel and management. Other risks include but are not limited to factors affecting access to capital to meet all of the client company’s financial requirements, and the company’s ability to control costs. There can be no assurance that client company’s efforts will succeed and ultimately achieve sustained commercial success. These forward-looking statements are made as of the date of the report, and Oreninc does not assume any obligation to update the forward-looking statements, or to update the reasons why actual results could differ from those projected in the forward-looking statements. There can be no assurance that beliefs, plans, expectations or intentions of persons producing data upon which Oreninc analysts rely in this report will prove to be accurate. 19 April 2012 Pulse Report: Copper