1. sm/d-analysis1
Data AnalysisData Analysis
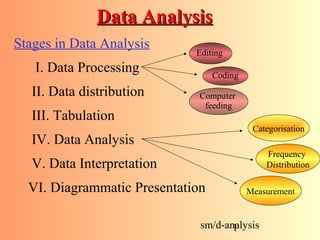
Stages in Data Analysis
I. Data Processing
II. Data distribution
III. Tabulation
IV. Data Analysis
V. Data Interpretation
VI. Diagrammatic Presentation
Coding
Editing
Computer
feeding
Categorisation
Frequency
Distribution
Measurement
2. sm/d-analysis2
Data Processing
• involves various manipulations necessary for
preparing data for analysis
1. Editing- a process of examining the collected raw data to
detect errors and omissions and to correct them when possible.
2. Coding- the process of assigning numbers or other symbols
to answers so that responses can be put into a limited number
of classes or categories.
3. Computer feeding-
3. sm/d-analysis3
Data distributionData distribution
It is a form of classification of scores obtained for the
various categories of a particular variable.
Data analysisData analysis
It is the ordering of data into constituent parts in order
to obtain answers to research questions.
1. Categorisation
2. Frequency distribution
3. Measurement
4. sm/d-analysis4
Interpretation
Done in two ways-
i. The relations within the study and its data are
interpreted.
ii. The results of the study and the inferences drawn
within the data are compared with the theory.
Diagrammatic representation
Numerical data is represented in the form of-
Graphs
Tables
Statement
6. sm/d-analysis6
Types of Statistical Analyses Used in
Marketing Research
Statistical Analysis
• Five types of statistical analysis:
1. Descriptive analysis: used to describe the data set
2. Inferential analysis: used to generate conclusions
about the population’s characteristics based on the
sample data
3. Differences analysis: used to compare the mean of
the responses of one group to that of another group
4. Associative analysis: determines the strength and
direction of relationships between two or more
variables
5. Predictive analysis: allows one to make forecasts
for future events
7. sm/d-analysis7
Understanding Data Via Descriptive Analysis
• Two sets of descriptive measures:
• Measures of central tendency: used to report a
single piece of information that describes the
most typical response to a question
• Measures of variability: used to reveal the
typical difference between the values in a set
of values
8. sm/d-analysis8
Measures of Central Tendency
• Mode: the value in a string of numbers that
occurs most often
• Median: the value whose occurrence lies in the
middle of a set of ordered values
• Mean: sometimes referred to as the “arithmetic
mean”; the average value characterizing a set of
numbers
9. sm/d-analysis9
Measures of Variability
• Frequency distribution: reveals the number
(percent) of occurrences of each number or set of
numbers
• Range: identifies the maximum and minimum
values in a set of numbers
• Standard deviation: indicates the degree of
variation in a way that can be translated into a
bell-shaped curve distribution
10. sm/d-analysis10
Correlation
A statistical technique that is used for
measuring the relationship or
interdependence of two or more variables.
It does not indicate the causal relationship
between two variables.
Usually scatter diagrams are used to
represent the relationship between the two
variables
12. sm/d-analysis12
Regression
• A statistical technique that relates the
dependent variable to one or more
independent variables.
• It is always used to predict the value of
one variable based on the value of
another variable
13. sm/d-analysis13
Hypothesis testing
A hypothesis is an assumption about relations between
variables.
It is a tentative explanation of the research problem or
a guess about the research outcome.
Hypothesis testing: a statistical procedure used to
“accept” or “reject” the hypothesis based on sample
information
14. sm/d-analysis14
Steps involved in hypothesis
testing
1. Formulate a hypothesis
2. Set up a suitable significance level
3. Choose a test criterion
4. Compute
5. Make decisions
15. sm/d-analysis15
Formulate a hypothesis
• Set up two hypothesis- null hypothesis
alternate hypothesis
Set up a significance level
The confidence with which a null hypothesis is
rejected or accepted depends upon the
significance level.
16. sm/d-analysis16
Select test criterion
• Involves selecting an appropriate
statistical technique.
• For a large sample (30 or more)- Z test
• For a small sample( less than 30)- t test
include the testing statistic and also its
standard error
Compute
17. sm/d-analysis17
Make decisions
• to accept or reject the null hypothesis.
• if the computed value falls in the
rejection region – reject the null
hypothesis and vice versa