Climate Change Impacts on Terrestrial and Aquatic Ecosystems.pptx
Bull selection (australia)
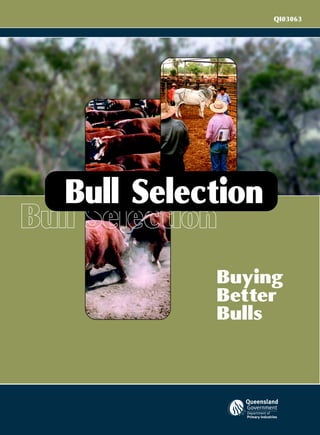
1. Buying
Better
Bulls
QI03063
Bull Selection
Bull Selection
Bull SelectionWill assist you to:
• Use key fertility measures included in a Bull Breeding Soundness Evaluation (BBSE).
• Define and seek the necessary genetic traits when selecting a bull.
• Use sound breeding objectives and
• Select more profitable sires for your herd.
Bull Selection examines the three traits to review when selecting; fertility, growth and carcase.
The relative importance of each of these trait groups will vary according to the performance of the
individual herd, the environment where the animals are managed and the producers target market.
Performance measurement is necessary to maximise genetic gain in the beef industry. Enterprise profitability
is intimately linked to the fertility of the herd and thereby the fertility of the sires as
assessed by the BBSE. This publication gives you an invaluable insight into the use and
implementation of performance measures available to assist you. It will guide you in carrying out
visual, subjective assessment for traits that currently do not have easily defined standards set by
cattle breeders. Selection decisions should be based on traits that are economically important,
heritable, measurable and characterised by variation.
When selection decisions are based on values that reflect the true genetic potential of animals, the progress
achieved will be permanent and cumulative. Programs such a BREEDPLAN assist with this.
A fundamental part of BREEDPLAN is the pedigree system operated by breed societies in association
with the individual animal records submitted by breeders. Bull selection and other titles in this set
will assist you to understand and make the best possible use of this available information.
Information contained in this publication is the result of many decades of research and development
by the Department of Primary Industries and organisations such as the Cooperative Research Centre
for Cattle and Meat Quality. The latest outcomes of some of this work, such as DNA fingerprinting,
gene marker technologies and net feed efficiencies, have been incorporated into this publication.
Along with Bull Selection there are three other companion publications produced by the
Department of Primary Industries. These are:
• Breeding for Profit
• Female Selection in Beef Cattle
• Beef Cattle Recording and Selection.
2.
3. A product of DPI’s
“Commercial Application of Beef Genetic Technologies” project.
Department of Primary Industries
Queensland
QI03063
An aid for beef
producers on
Buying
Better
Bulls
Bull Selection
Compiled by John Bertram
and colleagues
5. Contents
Foreword iv
A bull’s worth - cost per calf 1
The basis of genetic selection 3
Beef genetic improvement 7
Selecting for fertility 11
Selecting for structural soundness 22
Selection using a Bull Breeding Soundness
Examination certificate 26
Selecting for growth 28
Selecting for carcase attributes 32
Selecting for temperament 35
Selection using DNA fingerprinting and gene markers 37
Putting the selection decisions into a package
- Breeding Objectives 39
Bull management 41
iii
6. Foreword
The annual purchase of replacement sires in a progressive beef breeding enterprise is a
major investment. The real cost of bulls is not always fully appreciated and the subject has
received little attention in the past. It is very important that the purchaser gets value for
money when buying bulls and can be confident in paying more when there is reliable and
useful information about a bull’s performance available.
Producers in the past have made their selection of bulls using the best available information
at the time. There is now more information available to the breeder which can estimate the
true genetic worth of a bull and which has the potential to dramatically change the market
acceptance of the bull’s progeny.
Selection of bulls should be based on their being:
• reproductively sound so that they can produce an adequate quantity of good quality
semen and also have the capacity and desire to serve females
• structually sound with a good temperament
• of superior genetic quality so that their progeny can reflect the desirable features that the
cattle breeder requires for a particular market.
Relative emphasis placed on each of these aspects will vary according to the environment
and district in which the bulls will be used.
Finally, it is important that producers define clearly what market they are breeding
for and determine the breeding objectives, or aims, which best satisfy that market.
Any individual trait or criterion that a producer uses in selecting a bull for the
market must:
• be of economic importance (worth $ to the breeding program)
• be of reasonable heritability (passed from the sire to the progeny)
• be able to be measured (progress from what to what!)
• have variation in the trait to enable selection of superior animals.
Bull Selection is a companion publication to Breeding for Profit,
Beef cattle recording and selection, Female Selection
and the Australian Association of Cattle Veterinarian’s publication,
Evaluating and Reporting Bull Fertility.
iv
7. A bull’s worth - cost per calf
Bull selection
Herd bull selection is a major cost for cattle breeders. Costs per calf are increased by lowered
bull fertility, reduced cow fertility and by bull deaths. In pastoral areas which are extensive or
which have numerous watering places, bull selection costs are exacerbated by the need for
higher bull percentages. Bulls have a major influence on the future performance of the herd.
A superior bull can increase performance and decrease risk; while a poor performance bull
can adversely affect future production and increase your risk as a manager.
In an exhaustive study of bulls in extensive herds across northern Australia, the BullPower
Project examined about 1000 bulls, mainly 2 to 4 year old, of Santa Gertrudis, 5/8 Brahman,
Brahman, Belmont Red and Belmont Red cross. In addition, 212 bulls were mated in several
multiple-sire mating groups (varying from 2 to 12 bulls) from intensive to extensive
conditions. As a result of these matings, using bulls that were deemed to be satisfactory sires
by experienced beef producers, 7% of bulls did not sire any calves, 58% of bulls sired 10%
or less of the calves and 13% sired over 30% of the calves. The use of reproductively sound
bulls at the rate of 2.5% bulls: cycling females will not jeopardise herd fertility under most
conditions in extensive parts of northern Australia. These results indicate that the process of
bull selection requires much thought and consideration of relevant objective information.
Issues of concern when deciding what and how to buy are:
• What numbers to use? This may vary according to average bull age, the fertility of
bulls as well as the number and diversity of watering points, etc. Lower percentages may
be acceptable if subfertile or infertile bulls are not present in the herd. Traditionally, bull
percentages of between 3 and 5% have been used in Queensland.
• How much to pay for replacement bulls? Is the extra cost recovered from the extra
value of subsequent sales? Does paying more get you a better bull anyway? How much
emphasis should be placed on objective information?
• How long to keep them, or how many to replace each year?
• Whether to breed some, most or all of your own bulls?
Let us look at what it costs to provide the bullpower to put a calf on the ground, then for it
to grow and match the market requirements of age (dentition), weight, fat and other carcase
traits.
Bull costs per calf branded
Bull cost per calf is easily calculated. Bull cost per calf depends on:
• bull purchase price or cost of breeding your own bulls
• bull salvage value at the end of its working life
• how many years he stays in the herd
• bull losses from deaths, strayings and continual mustering failures (This can be similar to
insurance costs)
• the number of cows per bull
• branding percentage achieved.
By looking to improve structural soundness and reproductive performance of bulls, it is
possible to make significant changes in some of these areas and so change the bull cost per
calf.
Table 1 considers three situations which have a direct impact on bull cost per calf.
1
8. By using vaccinations and better bull management, improving structural soundness so that
bulls last in the herd for 5 years rather than 3 years, improving bull reproductive performance
so that bulls can be mated at 3% rather than 4% and with a branding rate of 85% rather
than 75%, it is possible to reduce bull costs per calf from $24.29 to $9.71
Alternatively with these same management improvements, the price paid for a bull could be
increased from $2000 to $3980 (almost double) with virtually no change in bull costs per calf.
Producers can use the above example to substitute their own figures to
determine their own bull costs per calf and how these can be changed through
improved structural soundness, improved reproductive performance in their bulls
and better bull management.
What are the benefits from buying better bulls?
By purchasing better bulls we hope to achieve these things:
• produce more calves per bull
• produce progeny that grow faster
• produce progeny that have desirable carcase traits
• produce future breeders which will produce more valuable offspring
• produce animals that repeatedly meet market specifications.
Better bulls have a number of impacts on a herd:
• for the years that they are in the herd, these bulls will sire superior male and female
progeny
• improvements using genetics are permanent and will continue to accumulate as high
performing sires are selected.
All these advantages auger well to minimise beef producers’ risk and increase the enterprise
profitability.
Table 1. Bull costs per calf as related to initial cost, management and performance.
Situation 1 Situation 2 Situation 3
Purchase price of bull $2000 $2000 $3980
Bull incurance cost 3% (60) 3% (60) 3% (120)
Transport cost $ 100 $ 100 $ 100
Cost of bull landed on property $2100 $2100 $4080
Effective cost of bull $2160 $2160 $4200
No. of years bull is used 3 5 5
No. of cows mated to bull per year 25 (4%) 33 (3%) 33 (3%)
Branding % 75 85 85
No. of calves produced by bull during its lifetime 56 140 140
Salvage value of bull $ 800 $ 800 $ 800
Effective cost of bull less salvage value $2160-800 $2160-800 $4200-800
Net cost of bull $1360 $1360 $3400
Number of calves in lifetime 56 140 140
Bull cost per calf $24.29 $9.71 $24.29
2
9. The basis of genetic selection
Genetic selection is an old tool which is gaining increasing importance. Beef producers can
influence two areas which have major long term impacts on profits and sustainability –
genetics and management. Development of new plant varieties and the manipulation of plant
characteristics will influence production but will take place mostly off-farm. Animal genetic
improvement however will mostly take place on-farm. It will be managed by the producer
and will be long term in its effects.
How are traits transferred?
Beef cattle, like all other animals, have many characteristics that make up the whole animal.
Each individual characteristic is controlled by a string of protein molecules joined together in
a distinctive pattern referred to as a gene. Many genes are linked together to form a
chromosome. In the animal’s body cells, the chromosomes are found in pairs within the
nucleus of each cell as shown in figure 1.
Figure 1. A representative of protein molecules forming genes within a cell in all body tissue.
The appearance and performance of an animal e.g. how fast it grows or what is looks like, is
determined by the pattern of proteins (genes). It’s all in the genes – referred to as the
animal’s genetic make-up or genotype.
Each species has a different number of chromosomes. Cattle have 30 pairs of chromosomes
while humans have only 23 pairs.
Formation of the ova and sperm cells
When the sperm cells are being produced in the testes and the ova cells in the ovaries, they
contain only half of each pair of chromosomes. To accomplish this the chromosome pairs split
down the middle and only half the genetic complement is placed in the new cells. The sperm
or ova therefore have only one half the chromosome makeup normally found in the body
cells. This division is called Meiosis.
Depending of which chromosome each cell receives, there will be differences in the genetic
potential of the cell. For example, in the case of the sperm, this gives rise to the 50:50
male:female sex ratio in the offspring – half the sperm cells carry the male chromosome and
half the female.
Since the only direct connections between the parents and the next generation are the
chromosomes which are contributed from the sperm and the ova during fertilisation, all the
characteristics which an animal inherits are therefore represented in the sperm and ova. At
the moment of fertilization when the sperm and ovum unite, they form a complete cell
containing 30 pairs of chromosomes. This cell then commences to divide normally, (2, 4, 8,
16, 32, 64 cells, etc.) producing the full complement of chromosome pairs in each cell of the
new individual. This division process is called Mitosis. By this method each new generation
receives exactly half its chromosomes from the sire and half from the dam.
Nucleus of the cell
Protein molecules
joined together to form
genes on the
chromosomes
30 pairs of chromosomes
in cattle
Cell wall
3
10. How do genes determine the animal’s characteristics?
Some characteristics are controlled by single pairs of genes whilst others are controlled by
many pairs of genes.
Single gene action
Characteristics controlled by a single pair of genes include coat colour in Shorthorn cattle,
and polledness. With single gene characteristics; animals can be divided into discrete classes
and are easy to identify and quantify, as can be seen in figure 2, where we have represented
the gene types for coat colour as either big R for red or little r which represents white.
From this single pair of genes we have the possibility of three colours. Red, which is
represented by two RR genes; white, which is represented by rr genes; and roan, which is a
mixture of Rr. If one gene is dominant, then the characteristic will always be expressed when
the dominant gene is present, irrespective of the other gene. If red were dominant, then
there would not be a roan colour – there would only be two colour types from the single pair
of genes – not three. An example of dominance is in polledness, where PP and Pp are polled
and pp (the recessive gene) is horned. Horned cattle therefore breed true to type, whereas
polled cattle can breed the occasional horned offspring if each parent is carrying one
recessive horn gene.
Numberofanimals
2
1
red roan white
Coat colour
Numberofanimals
4
3
2
1
red roan white
Coat colour
red-roan roan-white
Figure 4. Population distribution for a two pair
gene interaction.
Figure 3. Population distribution from the
second generation (F2) of a single pair of genes.
Population distribution
Various characteristics of a group of animals
can be represented in a population
distribution graph. The population distribution
from a single gene pair (without either gene
being dominant) can be seen in figure 3.
The animal types red, roan or white represent
all the possible gene combinations and
therefore the types.
Multiple gene pair interactions
As the number of gene pairs in the interaction
increases, so the number of types, e.g. with
two pairs of genes there would be five coat
colours. The population distribution for a
characteristic which is controlled by two gene
pairs can be seen in figure 4.
With five coat colour types, the colours red
and white are still the minority of the group
with true roans the largest of the population
groups. There are now two more groups of
intermediate numbers on each side of the
roan colours and of intermediate population
number.
Figure 2. Single gene action
Roan bull Roan cow
Rr x Rr
Red Roan Roan White
F2 RR Rr rR rr
Progeny coat colour
25% red : 50% roan : 25% white
4
White cowRed bull
Gene pair RR x rr
Rr
All progeny are roan
F1
11. As the number of gene pairs increases then the
number of types increases by a factor of twice the
number of gene pairs plus one (i.e. 2n+1). It
becomes increasingly difficult to classify animals into
discrete types. With 12 gene pair interactions for coat
colour for example, there would be 25 coat colour types.
Environmental effect
In the case of production characteristics, the
environment (as experienced by individual animals)
will interact with the character differences and cause
overlapping of adjacent genetic classes. The
combination of a large number of gene pairs and the
effect of the environment will cause a merging of
genetic types and the population begins to be
represented as a ‘continuous’ distribution rather than
a series of identifiable types. It becomes necessary to
find some criterion in order to measure the
characteristic. A continuous distribution of a
characteristic can be seen in figure 5.
This normal distribution pattern is very well
established where characteristics are controlled by
many pairs of genes. It is referred to as the ‘normal
distribution curve’ or ‘bell curve’. Virtually all the
economically important characteristics for beef
production are controlled by large numbers of gene
pairs and are therefore expressed as normally
distributed curves. The normal distribution curve is
defined in figure 6.
Numberofanimals
Level of performance
Figure 5. Production distribution from a
large number of gene pairs.
Features of the distribution curve
• the mean or average production of the population.
The average growth rate for a group of cattle on reasonable pasture, for example, may be 0.5 kg
liveweight gain/day. The mean or average production will occur at the peak of the population
distribution curve. A large portion of the cattle will produce between 0.45 and 0.55 kg/day.
• the variation within the population or the total spread of the production.
Considering this same group of cattle, the most productive animal may have a growth rate of
0.9 kg liveweight gain/day and the worst may have a growth rate of 0.1 kg/day. The animals
that produce at these extremes will be very small in number.
• the standard deviation or distribution of cattle in the group, herd or breed.
The distribution of individuals within a population is so reliable that it can be statistically
defined. Statistics defines that 66% of animals in a group selected for any multi-gene
controlled characteristic will produce within one standard deviation of the average.
The population distribution of animals within a group or within a breed, will follow the
distribution curve similar to the one shown above.
Numberofanimals
Level of performance
More
Less
Average production
in the herd
Inferior
production,
few
animals
HighLow
Superior
production,
few animals
Figure 6. Normal distribution curve for
multiple gene interactions.
5
12. The greater the selection intensity (right hand end of the curve), the fewer the number of
animals selected and the better their performance. When mating these superior sires, the
mean performance of the progeny will be greater than that of the present mean but probably
not greater than that of the sires.
The consequences of this are that:
• all bulls from top sires will not carry genes for higher than average production – even if
they are out of top females.
• only slightly more than half of the bulls and females in the next generation will inherit
production genes better than the average of their parents.
• using top sires over high performance females, only a very small proportion of the
progeny (bull and females) will be better than their parents.
• if the bulls are good, the average production of the progeny will be higher than the
original herd, but about 45% will be lower than average.
Principles for genetic improvement
In order to increase production in successive generations, you must take advantage of the
normal biological function of variability and use the following steps:
• measure as accurately as possible the production characteristics (traits) you want to
improve in the parent herd
• select the best animals with the traits of highest economic importance and use them to
breed the next generation
• select for traits of reasonable heritability
• cull the poorest performers
• select animals using the fewest number of ‘selection criteria’ as possible for the most
rapid gains.
These steps must be carried out with each successive generation in order to obtain continual
production and profit improvement from genetic means.
6
Figure 7. The production distribution curves for
parents and progeny.
What happens in the next generation?
When faster growing sires and dams are mated, the
progeny will, on average, produce better than the
original population. The production distribution will
be similar to the original population, but the
distribution curve will be based around a higher
mean or average. A comparison of the two
generations can be seen in figure 7.
Production increase from one generation to the
next will be determined by the extent of selection
or ‘selection intensity’ PLUS the rearing and
management/environmental differences. If there is
no accurate and effective selection in the cows and
bulls, then it is unlikely that the average production
of the next generation will be superior to that of
their parents.
Numberofanimals
Level of performance
More
Less
Average production for parents
HighLow
Average
production
for progeny
13. Beef genetic improvement
Genetic improvement in beef cattle is the improvement in productivity of a herd through the
selection of superior parents for mating to produce replacements.
Genetic improvement is only one aspect of total herd improvement, but it is a very important
component, because genetic improvement is both PERMANENT and CUMULATIVE.
The gains that are made in a herd through genetics remain in the herd from year to year and
each year’s improvement builds on improvements already achieved in previous years. More
rapid progress is made in genetic selection when fewer traits are used for selection. If we
select for many desirable traits in each animal, the number of animals available for selection
in each trait decreases and more of these animals will be closer to the average performance
of the population. Make use of traits that are positively related to another trait – in this way,
as we select to improve performance in one, we will automatically improve performance in
the other, without diminishing response.
Performance measurement is necessary to maximise genetic gain in the beef industry. It will
not replace visual assessment for traits such as structural soundness, but is an important
adjunct to those assessments.
What traits should be included?
There are four criteria that should be applied to traits being considered for inclusion in any
genetic improvement program.
To be successfully included in a program, a trait should:
• be of economic importance
• be of reasonable heritability
• be able to be measured and
• have variation in performance within the trait.
Economic importance
Even though the measurement procedures that are now available for genetic improvement in
beef cattle are relatively simple and can be put into practice at a fairly low cost, it is still
essential that traits being selected for are of economic importance.
There is no point in putting effort into improving a trait if the improvement will not result in
increased economic returns for the producer.
In addition, in most instances, breeders will be attempting to achieve improvement in more
than one trait at a time. Each additional trait included in a program means less improvement
in each individual trait.
Economic importance can mean different things to different producers. For the commercial
beef producer, probably the most important traits from an economic viewpoint will be fertility,
growth rate and carcase quality. For the producer of breeding stock for sale, there may be
other traits which will improve the returns to be made from the sale of breeding animals.
Heritability
Heritability can be defined as the degree to which an animal will transmit to its offspring the
performance it displays in any trait. Hence, how much of the measured variation between
animals is due to genetic differences between the animals and how much is due to non-
genetic factors such as nutrition, management, disease control measures and all the other
environmental factors which affect how the animal performs?
The proportion of the total variation between animals that can be attributed to genetics is
what we term heritability. The higher the percentage, the greater the chance that traits will
be passed on to the progeny.
7
14. Most of the growth traits in beef cattle have heritabilities of between 30 and 50 percent. This
means that of the measured differences in growth rate between animals in a group, between
30 and 50 percent are due to genetic factors and 50 to 70 percent are due to non-genetic or
environment factors.
Carcase traits generally have heritabilities of between 10 and 50 percent. The heritability of
scrotal circumference/size is of the order of 40 percent, while for serving capacity it appears
to be between 15 to 60 percent. Female fertility traits tend to have slightly lower heritabilities
of the order of 10 to 20 percent. This means that less of the measured differences between
animals in fertility traits are due to genetic differences between the animals and so the rate
of improvement in a genetic improvement program will be slower for these traits than for the
growth and carcase traits.
Heritability estimates for some of the important traits of beef cattle are shown in table 2.
Measurable
Even if a trait is of economic importance and of reasonable heritability, it is of little use in a
genetic improvement program if it cannot be measured. Actual objective measurement of
beef cattle performance traits enables the producer to compare the traits and further allows
the calculation of estimates of genetic worth irrespective of season, bias, year or
environmental effects. For this reason, most of the early work to do with genetic
improvement programs was with growth rate.
Growth rate is fairly highly heritable and is very easily measured. In the early days of the
National Beef Recording Scheme, evaluation was based on weight ratios which compared
individual animals on their growth rates or weights at particular ages. When BREEDPLAN was
established, the first Estimated Breeding Values (EBVs) were for growth traits.
The next trait to be included in BREEDPLAN was fertility. Emphasis initially was on the two
relatively easily measured fertility traits; scrotal circumference/size in bulls (which is related
to female fertility) and days to calving in cows. Serving capacity in bulls is gaining attention
as a measurable trait and part of fertility traits. In addition, EBVs are now available for
calving ease, gestation length and mature cow weight.
Carcase traits are now measurable and therefore are included in the BREEDPLAN analysis.
The traits evaluated are 400-day Eye Muscle Area (EMA) and fat (P8 rump and 12/13th ribs)
and Intra-muscular Fat % (IMF %).
Variation within the trait
As discussed in the previous chapter, genetic improvement is dependent upon genetic
variation within a trait. This variation allows selection of superior animals both as sires and
again in the selection of replacement females.
What are the advantages of BREEDPLAN?
There would probably be little argument that objective (measured) evaluations of traits such
as fertility, growth rate and carcase quality are more accurate than visual assessment. Whilst
progress in genetic improvement has been slow, this is not to say that visual assessment has
not served the industry well in the past. It is simply that as more accurate methods of
evaluation become available, they should be used to assist in more accurate selection of
genetically superior animals. Further, as market demands become more exact, both on the
domestic and export scenes, it is essential that breeding animals be selected that can
meet the market specifications.
The first ’objective’ selection methods involved weighing a group of cattle and comparing
growth rates of the animals which were all born around the same time and that had been
managed as one group. This uniformity of age and management within a group of animals
removed many of the management and environmental differences, so that most of the
measured differences could then be attributed to genetic differences.
8
15. Table 2. Heritability estimates for some traits in beef cattle (bulls)
Reproduction
Conception low 0 - 5 5 - 20
Days-to-calving low 0 - 10 (7) 0 - 10 (9)
Calving ease (heifers) low - medium 15 - 50 na
Semen quality low - medium 25 - 40 6 - 44
Scrotal size (18 months) medium - high 20 - 50 (39) 28 - 36 (39)
Serving capacity (18 months) low - high 15 - 60 na
Mounts and serves low - medium na 3 - 62
Maternal ability medium 20 - 40 na
Gestation length medium 15 - 25 (20) (20)
Growth and conformation
Birth weight medium 35 - 45 (38) 35 - 45 (45)
200-day weight medium 20 - 30 (18) 16 - 40 (28)
400-day weight medium (25) (37)
600-day weight medium (31) (42)
Mature cow weight high 50 - 70 (40) 25 - 40 (39)
Milk yield medium 20 - 25 (9) (3)
Hip height (400 days) medium - high 59 - 66 na
Front feet claw set low - medium 29 na
Rear legs - side view low - medium 18 na
Rear feet angle low - medium 32 na
Dry season gain medium na 17 - 30
Wet season gain low na 18
Weight gain - birth to weaning medium 25 - 30 30 - 40
Condition score medium 44 na
Carcase
Rib fat (12/13th rib) medium (22) (22)
P8 rump fat medium-high 29 (27) 18 (27)
Intramuscular fat (IMF%) medium-high 15 (12) 30 (12)
Eye muscle area (EMA) medium 20 - 25 (26) (26)
Dressing percent medium - high 15 37
Tenderness high 4-25 16-30
Retail beef yield (RBY%) high 29 (36) 36 (36)
Carcase weight/day of age medium 25 - 45 (41) (29)
Muscle score (400 days) medium - high 38 - 47 47
Other traits
Cancer eye susceptibility medium 20 - 40 na
Eye pigmentation high 45 - 60 (45) na
Temperament score medium - high 25 - 50 (27) 25 - 50
Tick resistance medium na 20 - 42
Worm resistance medium na 25 - 36
Buffalo fly resistance medium na 20 - 30
Pelvic - height (400 days) medium - high 34 na
Pelvic - width (400 days) medium - high 41 na
Pelvic - area (400 days) medium - high 42 na
Trait Heritability
description
Heritability % (BREEDPLAN)*
Temperate (AA) Tropical (BB)
* - BREEDPLAN heritability values for AA (Angus) and BB (Brahman). na - not available
Sources: Hammond, K. et. al. (1981) ‘Selecting Beef Cattle for Maximum Production in the 80s, AGBU, UNE.
Davis, GP. (1993) ‘Genetic Parameters for Tropical Beef Cattle for Northern Australia’, Aust. J. Agric. Res.,44, pp. 170-198.
Robinson, DL., Ferguson, DM. & Skerritt, JW. (1988) Genetic Parameters for Beef Tenderness, Marbling and Yield.
Proc.6th World Congress Genet. App. Livestock Prod.
PIRD-96 (1998) Development of a scoring system to assess the structural soundness of beef cattle. Final report. MRC
PIRD project 96/V2. 1998
Industry validation of current and new traits for BREEDPLAN, MLA project UNE.030, AGBU 1996. (Southern cattle
results only)
9
16. BREEDPLAN opens new opportunities - it uses information from relatives
compares across groups and years, locations and management treatments.
By having the progeny of the same animals compared in different years, herds or
management groups, comparisons can be made of their relative genetic potential in those
different years, herds or management groups. This widens the group of animals that can be
compared for genetic potential and so allows more ‘intense’ selection i.e. a better chance of
picking out the highest performing animals.
By analysing the performance information of relatives, more accurate assessments of true
genetic potential can be made. For example, an assessment of an animal that is based on
the performance of 10 of its progeny for growth rate, is 50 percent more accurate than an
assessment based on the animal alone. This increases the ability to pick out high
performance animals based on this more accurate assessment rather than just on the
individuals’ performance alone.
Similarly, an assessment based on the individual’s performance, plus that of 10 paternal half-
sibs and 10 progeny, is twice as accurate as that based on the individual’s own performance,
with a corresponding increase in the ability to select out high performers. BREEDPLAN, then,
offers a method of achieving considerably more accurate selection and greater increase in
performance.
The commercial producer stands to gain much from BREEDPLAN. It will enable the bull buyer
to have confidence about the price paid for a bull as a reflection of the genetic worth of the
bull. Beef producers can now take home a draft of bulls with some assurance that they have
had the opportunity to select and purchase the best bulls from those available, according to
their genetic potential.
BREEDPLAN is based on an integrated pedigree system within breeds that
compares all animals with pedigree linkages.
The EBVs of bulls from different herds cannot be compared unless the herds are in GROUP
BREEDPLAN. Many breed societies are now producing GROUP BREEDPLAN reports. The first
for a tropical (Brahman) breed was published in 1991.
There are now six tropical breeds with GROUP BREEDPLAN analysis. They are the Brahman,
Belmont Red, Santa Gertrudis, Droughtmaster, Brangus and Braford breeds. The British
breeds with GROUP BREEDPLAN are the Poll Hereford/Hereford, Angus, Murray Grey,
Shorthorn, Devon, Red Angus and South Devon, while the European breeds are the
Simmental, Charolais, Gelbvieh, Salers, Blond D’Aquitaine and Limousin.
GROUP BREEDPLAN adds significantly to the ability to identify genetically superior animals
provided by BREEDPLAN. Again the real winners are the bull buyers who will have the
opportunity to select from the best a breed has to offer.
A concern raised by a number of breeders is that, using GROUP BREEDPLAN to choose bulls
from within the whole breed could lead to the selection of bulls from one environment that
will not perform in a different environment. For example, it is felt that bulls selected in
southern Australia may not produce progeny that will perform well in Queensland, or that
progeny of bulls selected in central Queensland may not perform will in northern
Queensland.
The CRC (Cattle and Beef Quality) results have clearly demonstrated that the performance
ranking of bulls’ progeny produced on pastures in the tropics remain the same as for those
grazed on pastures in the south, in feedlots in the north and in feedlots in the south. We
know that bulls imported into Australia from overseas, either directly or as semen, perform in
virtually the same ranking order that they did in their country of origin.
There is mounting evidence of the beneficial impact BREEDPLAN is having on the production
traits. The power of this selection aid will continue to increase as more data on the national
herd are analysed and more breeds adopt this integrated pedigree genetic analysis.
10
17. Selecting for fertility
There is no single measurement that can give a guaranteed and reliable measure of the
fertility of a bull. Similar to the measure of female fertility, the reproductive ability of a bull
can only be measured after sexual maturity has been reached and involves multiple
assessment through examination. A complete reproductive examination of the bull is best
done by an experienced veterinarian. However, property managers should be able to
recognise many of the traits that are normal, those that are abnormal and subfertile.
There are a number of traits that are used to assess bull fertility. These include:
• examination of the testicles (palpation of scrotal contents and measurement of scrotal
circumference/size)
• examination of the penis, prepuce and sheath
• collection and evaluation of semen
• palpation of internal sex organs
• assessing the bull’s desire (libido) and ability to serve females (serving ability)
• structural soundness of the bull’s legs, feet, eyes and general structure.
We would encourage all producers to request a Bull Breeding Soundness Evaluation prior to
purchase of every bull. This will include palpation of testicles, penis and prepuce, semen
examination and preferably a serving capacity assessment performed, prior to the bulls
inclusion in a mating team.
There are minor differences between Bos taurus i.e. British and European breeds and Bos
indicus breeds i.e. Brahman and Sahiwal and the Bos taurus crossed with Bos indicus i.e.
Droughtmaster and Santa Gertrudis type breeds.
Scrotal conformation
Anatomical appearance of the scrotum and its contents can vary widely (figs. 8 and 9). In
general, the scrotum and its contents in Bos indicus bulls is longer and narrower (fig. 8a)
than in Bos taurus bull (fig. 8b). Lateral rotation of the testicular axis occurs in some Bos
indicus bulls (fig. 8c, rotated testes) which, whilst probably not functionally important,
usually causes unfavourable comment from bull buyers. To date there is no evidence relating
testicular shape with udder conformation in the female progeny. Incomplete separation of the
scrotal septum (fig. 8d) is also occasionally seen and is a blemish of little consequence rather
than of functional importance.
(a) (b) (c) (d)
Figure 8. Scrotal conformation: (a) normal (elongated), (b) normal (round), (c) rotated, and
(d) Y-balls/cleavage.
11
18. Several other common scrotal abnormalities are shown in figure 9. Bulls with testes held
close to the body (fig. 9a) should receive further checks on fertility. Smaller testes are
frequently associated with poor quality semen and lowered fertility, which probably reflects
an impaired testicular temperature regulating capacity. However there is a need to recognise
that a short scrotum is common on cold days and that some nervous bulls pull up the
scrotum as a protective mechanism.
Another scrotal abnormality is ‘tied scrotum’ where the testes are held more horizontally to
the body. These bulls are usually functionally sound but should be checked by a veterinarian.
Figure 10. Cross section of the
testicles and accessory sex glands.
The scrotum should not only be
observed but also palpated by
standing behind the restrained bull
with some form of safety gate. If
bulls are caught but not squeezed
hard by a head bail, most will
stand and will not object to their
scrotum being palpated. Figure 10
shows the relative position of the
testicles; head, body and tail of the
epididymis; penis and the skin of
the scrotum.
The procedure is:
1. Palpate the neck of the
scrotum. It should be much
narrower than the testicles. Fat
deposits in the neck of the
Scrotal Fascia
Tunica Dartos
Skin
Mediastinum
Testis
Parenchyma
Urethra
Penis
Tunica Vaginalis
Median
Septum
Pampiniform
Plexus
Inguinal Canal
External
Cremaster Muscle
Spermatic Chord
Vas Deferens
Head of the Epididymis
Testicle (outer
covering of Tunica)
Albuginea or White
Layer)
Body of the Epididymis
Tail of the Epididymis
Figure 9. Scrotal conformation: (a) cold bath scrotum, (b) long scrotal neck, (c) unilateral
hypoplasia, (d) scrotal hernia.
12
Bulls with an extremely long scrotal neck, where the testicles are down at about hock level
(fig. 9b), tend to have more problems with injuries to the testicles and should be avoided.
Short, tied and excessively long scrotums are probably heritable defects.
One small testicle (unilateral hypoplasia, fig. 9c) and two small testicles (bilateral hypoplasia)
are the two common abnormalities found in young Bos indicus bulls. The syndrome is
heritable and associated with reduced sperm production capacity and hence reduced fertility.
Scrotal hernias (fig. 9d) are not common but relatively easily diagnosed. Partial or complete
cryptorchids (rigs) are occasionally found on examination. The latter conditions are heritable
and such bulls should not be mated.
Palpation of the scrotum and contents
(a) (b) (c) (d)
19. scrotum indicate over fat bulls. Be aware of an
inguinal hernia in the neck of the scrotum and
enlargement of the mass of veins
(Pampiniform plexus) also in the neck of the
scrotum.
2. The testicles should move freely within the
scrotum. Using thumb and forefinger of both
hands, palpate each testicle for tone and
consistency (fig. 11). Testicular tone indicates
degree of filling of the seminiferous tubes.
Good tone is one where there is firm resistance
to pressure and each testicle should spring
back to its original shape. The contrast is flabby
or rock hard testicles. Bulls with abnormally soft
or hard tone should be examined further for
semen quality, either by manual palpation or by
electroejaculation. (Soft portions often produce
abnormal sperm cells, firm portions may
indicate blockages). Normal tone in testicles is
similar to the thick muscle at the base of our
Figure 11. Palpation of body of testicles.
Correct method for measurement of scrotal size
The testes are pulled firmly into the lower part of the scrotum by encircling its base with
the hand and pulling down on the testes (A). The scrotal tape is formed into a loop and
slipped over the scrotum and pulled up snugly around the greatest diameter of the scrotal
contents. The thumbs and fingers should be located on the side of the scrotum rather than
between the testes (B) to prevent separation of the testes and inaccurate measurement.
The scrotal tape should make a slight indent in the skin of the scrotum to ensure a
consistent firm pressure by the tape.
(From Ott, RS: Breeding soundness examination of bulls. In Morrow, DA ed: Current Therapy in
Theriogenotogy 2. Philadelphia. WB Sanders, 1986. p 131.)
Figure 12. Correct technique for firmly holding neck of scrotum to measure scrotal size.
A B
13
thumb when the hand is closed. Soft testicles or part thereof are similar to that muscle
when our hand is open and relaxed.
Some conditions such as ephemeral fever and lantana poisoning can temporarily cause
abnormal testicular tone and genetically valuable bulls should not be culled if this occurs.
Healthy bulls with good testicular tone generally have good quality semen.
3. Palpate the head, body and tail of the epididymis.
4. Skin lesions may indicate trauma or inflammation.
Measuring scrotal size
Scrotal circumference/size is measured using a tape at the site of the widest part while
holding the testicles in the hand. Avoid pulling the scrotum down and distorting the shape
(fig. 12).
20. There are a number of vital points to remember when considering scrotal measurements:
• Scrotal size is one of the important traits related to calf-output of the bull.
• Scrotal size is closely related to daily sperm production. Small scrotal size
indicates less sperm production.
• It is best to define minimum acceptable standards for scrotal size in different
ages of bulls. For example, 32 cm is the minimum in 2 year old British breed bulls; 30
cm is the minimum in 2 year old Brahman type bull in paddock condition. There appear
to be genetic correlations between the bull’s scrotal size and the age of puberty in their
female progeny. One caution is that scrotal size has been reported to vary up to 4 cm
depending on body condition. Young bulls go through a testicular growth spurt from
about 8-10 months of age up to 18-24 month of age during which they should be on a
rising plane of nutrition.
• To make faster progress in scrotal size and subsequently age of puberty in
female progeny, a bull must be selected using scrotal size EBVs which take into
account relatives and environment influences. The greater the EBV for scrotal size in the
sire, the earlier the female progeny will reach puberty. The actual scrotal measurement is
influenced by a host of variables which can alter scrotal size and are not a true reflection
of the genetic potential of the bull.
• Scrotal size is moderately heritable. It is correlated with liveweight, i.e. at the same
age, heavier bulls tend to have larger scrotal size.
• Young Bos indicus bulls have smaller scrotal size than Bos taurus bulls at 2
years of age because of their later age at maturity.
• As a general rule when palpating the scrotum, the left testicle should equal the
right in size, shape and tone.
As a guide to changes in scrotal size relative to age, the following tables (3 and 4) show
scrotal size for bulls moderately to well fed which often equates to bulls being presented for
sale in Queensland. These are meant purely as potential indicators of what has been reported.
Age (months) Minimal scrotal size (cm)
12 - 14 28
14 - 16 30
16 - 18 31
18 - 20 32
20 - 24 33
24 + 34
The average scrotal size for mature Bos taurus bull is 35 to 37 cm.
Table 4. Minimal scrotal size for Bos indicus (Brahman) bulls in Texas USA and north Queensland
Age (months) Minimal scrotal size (cm)
12 18
14 22 20
14 - 17 27 23
17 - 20 29 24
20 - 23 31 25
23 - 26 32 28
26 - 30 34 30
30 - 36 35 32
36+ 37 34
Source: Dr D Morris, Texas A & M and S Wildens et.al., Swan’s Lagoon, Queensland.
feedlot conditions
Texas
grazing spear grass
Queensland
14
Table 3. Minimal scrotal size for moderate to well fed Bos taurus bulls.
21. Navel
Umbilicus
Rosette
Sheath
depth
The BullPower study found that scrotal size in 2-yr-old Brahman, Santa Gertrudis and
Belmont Red bulls averaged 33.7, 36.4 and 34.5 cm respectively when all bulls were in paddock
grazing conditions.
Examination of the sheath, penis, prepuce and navel
The sheath (fig. 13) is made up of the navel area to the front, the residue of the umbilical
cord lying vertically in the middle and the penis with the pink mucous membrane and
associated muscles to the rear. The place where the umbilical chord entered the skin is the
‘rosette’ which in some animals in Bos indicus breeds can be an inverted fold of skin. The
prepuce surrounds the penis and attaches to the shaft of the penis internally and externally
at the lower hair-line of the sheath. The penis is retained within the sheath by the retractor
muscles located above the neck of the scrotum and in association with the sigmoid flexure to
the rear of the pelvis. The overall shape of the sheath and navel has been described with
‘sheath scores’ that range from 2 = very pendulous sheath, 6 = acceptable sheath hanging
at a 45 degree angle and 9 = very tightly attached sheath to the abdominal wall.
The sheath and its components are an essential part of the delivery of the bull’s genetics to
the point of fertilisation in the female. Abnormality and malfunction of any of these can result
Figure 13. Relative sheath measures used in
the bull.
Navel
Umbilicus
Rosette
Sheath
depth
15
in the bull being either subfertile or even
infertile. The average sheath depth of 2-yr-old
bulls is about 200mm (table 5) with the
residue of the umbilicus in most Bos indicus
derived bulls being between 1 to 1.5cm
diameter. 2-yr-old Belmont Red bulls have a
much thinner residue of the umbilical cord -
0.5 to 1.0cm diameter. A thicker residue of the
umbilicus tends to be associated with a larger
inverted fold of skin in the rosette. An
acceptable sheath is shown in figure 14a.
Table 5. Liveweight, sheath depth and sheath scores for four tropically adapted genotypes by age.
Liveweight (kg) Sheath depth (mm) Sheath score
Brahman 2-yr-old 441 200 4.7
3-yr-old 480 172 5.1
Santa Gertrudis 2-yr-old 586 206 4.6
3-yr-old 788 217 4.6
5/8 Brahman 4-yr-old 580 142 6.5
Belmont Red 1-yr-old 265 75 7.9
2-yr-old 565 102 7.9
Figure 14. (a) Acceptable and (b) unacceptable sheath conformation in a bull.
Prolapse of the prepuce is a problem in some Bos indicus bulls (figs. 15a and b). Pendulous
sheaths are often associated with injury to the prepuce and can result in the bull being less
functional in mating dexterity. Selection against poor sheath structure (fig. 14b) will result in
both immediate and long term benefits by reducing the incidence of injury and providing a
more functional sheath at mating. Despite our practical knowledge over the last 20 years of
(a) (b)
22. relationships between sheath structure and physical injury, a disappointingly large number of
bulls are still presented for sale with poor sheath structure.
A number of penile abnormalities (figs. 16a, b, c) are occasionally encountered including
persistent frenulum, stenosis of the penis, lateral or ventral deviation, warts on the glans
penis, penile haematoma, ‘broken’ penis and premature spiral deviation of the penis (fig. 20).
The prepuce and penis can be palpated whilst the bull is in the crush. The penis may
protrude during a rectal examination and during electroejaculation. The presence or absence
of premature spiral deviation is not necessarily defined by crush side examination.
16
Figure 15(a) and 15(b). An early and severe prolapse prepuse in Bos indicus bulls.
(b)(a)
Figure 16 (a) Stenosis of the penis (b) warts on the glans penis and (c) penile haematoma
adjacent to the neck of the scrotum.
Collection and evaluation of semen
Before considering semen collection and evaluation, the testicles should be palpated because
healthy bulls with good testicular tone invariably have good quality semen.
Figure 17. Semen collection of a bull using
electroejaculation.
Semen can be collected by rectal massage,
electroejaculation (fig. 17) or serving into an
artificial vagina.
Rectal massage will often allow a collection
of a sufficient quantity of semen for
assessment, but electroejaculation may
enable protrusion of the penis and larger
volumes of semen. This method is
sometimes used for collection, preceeding
processing into straws for artificial
insemination.
Collection of semen by artificial vagina is
probably the best way to obtain a sample
representative of the bull’s capability under
(b)(a) (c)
23. natural service. The bull needs training to
use an artificial vagina. This method is used
in AI centres. Semen from beef bulls is in
many cases collected by electroejaculation,
since these bulls have not been trained to use
an artificial vagina.
Semen should be examined initially at crush-
side and then subsequently examined in the
laboratory.
Examination of semen is a specialist task.
Factors such as volume, colour, density,
motility and percent normal spermatozoa
can be assessed. Staining and counting
methods are used to determine the
percentage of normal sperm and
percentage of live normal sperm in an
17
ejaculation. Good semen should preferably have greater than 70% normal sperm. It must be
remembered that a semen test reflects fertility at the time of testing only and is not a
guarantee for some point of time in the future.
An examination of individual sperm and their structure gives an indication of whether faults
lie in the actual sperm producing cells of the testes or is a fault in the collection procedure or
that the bull has not ejaculated in the short time prior to collecting the sample.
Studies from the USA with large numbers of bulls suggests the British breed bulls with high
quality semen have better fertility. In the past decade, studies in the USA have focused on
the need for high heparin binding proteins in semen and seminal fluid to effect a possible
15% increase in the female conception rates. Results of trials in beef bulls in northern
Australia have not been able to support this finding. Of the 73 bulls examined in the
BullPower project, 93% had the recommended heparin-binding profiles of A or B. However,
in the majority of the mating groups, % normal spermatozoa was related to calf-output of
the bull.
Palpation of the internal sex organs
This is done by rectal examination and can be used to detect a number of abnormalities, such as:
• inflammation of the seminal vesicles
• presence of tumours
• abnormally small or missing portions of the reproductive tract.
Pain on palpation is abnormal and is most frequently an indication of inflammation.
Libido and serving capacity
Libido is the sexual desire of a male to serve a receptive female.
At Swan’s Lagoon Research Station in north Queensland, some 11% of 2 year old Brahman
cross bulls which passed a reproductive examination of palpation and semen examination
were subsequently found to sire very few offspring. It was considered that these bulls
probably had poor libido or an inability to mount and serve. In other trials with a Bos indicus
derived breed, where bulls have been mated in multiple sire groups, individual bulls have
sired from 3% to 60% of the progeny. This large variation may in part be explained by
differences in the bull libido. In the northern BullPower project, serving capacity was only
one of many traits that influenced calf-output. In particular, the measures of number of
mounts and number of mounts plus serves influenced the bull’s fertility in between 40 and 50%
of the reported mating groups. These conditions may be detected by a serving capacity test.
Figure 18. Crush-side examination of semen for
motility and % progressively motile.
24. The serving capacity test
The serving capacity test provides:
• an indication of a bull’s ability to mount and serve a cow/heifer and includes both
reproductive and structural soundness (legs, feet, sheath, penis and overall anatomy)
• a measure of the sex drive (libido) or eagerness of a male to seek out a female on heat
• an indication of the subsequent pregnancy rates achieved following a restricted mating period
(more particularly in Bos taurus breeds).
The test has proved very effective with Bos taurus breeds and has enabled many unsound
sires to be identified and culled before the producer suffers a serious financial loss.
The test is repeatable for bulls and is of medium heritability. That is, a bull with a high
serving capacity is likely to produce sons who also have a high serving capacity. As more
producers are using short term mating periods and single sire mating, there is an increasing
importance placed on a bull’s ability and desire to serve.
The serving capacity test in the past has proven less useful with Bos indicus type bulls. The
test has been found to be more repeatable when conducted at shorter intervals e.g. 1-month
apart rather than at annual intervals. Serving capacity as a trait is independent of other fertility
traits e.g. scrotal size. Larger scrotal size does not equate with increased libido of the bull.
Work with Bos indicus cattle indicates that a short period of sexual experience of 24-72 hours,
provided for immature bulls pre-test, is effective in identifying serving capacity in these animals.
Serving capacity ideally is used to match bull power (in Bos taurus bulls) with the number of
females to be served. When combined with scrotal size and % normal spermatozoa, the aim
for the cattle manager is to develop a Mating Potential (MP) for each individual bull. Currently
in Queensland however, the test is used mostly as a ‘capacity to serve’ test and the emphasis
is placed on detecting abnormalities which prevent the bull from completing a successful
service.
Assessment of libido
The desire by the male to serve oestrus females in the paddock can now be assessed using a
simple test in the cattle yard. The test provides a serving capacity score incorporating the
bull’s libido. This serving capacity test (fig. 19) was developed by Dr Mike Blockey in Victoria
to relate a controlled and managed yard test (table 6) to the performance of the bull in a
paddock mating situation over a 6 week period. The yard test is based on the number of
times a bull will mount and serve in a set period - usually 20 minutes for Bos indicus bulls
and 10 minutes for Bos taurus bulls.
With more producers using improved management practices such as a shorter mating period,
tighter calving spread, more uniform turn-off of animals and identification of females of
superior fertility, there is a greater need to select bulls with high fertility in terms of both
scrotal size and libido. The variation that has been demonstrated between individual bull
Figure 19. A serving capacity test (a) Bos taurus bull and (b) tropically adapted yearling bull.
18
(b)(a)
25. Serving Capacity
(Numbers of services
in 20 min yard test)
First oestrus
% conception rate
Pregnancy rate % in
10 weeks mating
average range average range
Low 0 - 1 25 18 - 40 40 27 - 66
Medium 2 - 3 61 55 - 68 91 89 - 93
High 4 - 6 72 70 - 78 95 90 - 100
Source: Dr M.A.Blockley, 1989.
Table 6. Relationship between serving capacity results and conception rate at mating in
Bos taurus breeds.
performances in the paddock, would suggest that some bulls are capable of up to 200 serves
in the first 3 weeks of mating, whilst others do not serve at all. Libido appears to be
independent of scrotal size. As mentioned earlier, libido has medium heritability but its
demonstration in the test can be modified by structural soundness and nutritional levels of
the bull at the time of testing.
Results in Table 6 give an indication of the potential changes in conception rates relative to
serving capacity that can be achieved in Bos taurus breeds.
Studies conducted in Queensland beef herds indicate that the average number of services
per 20 minute yard test for Bos taurus breeds is between 3.0 and 4.0 services. This is in
contrast to the averages for Bos indicus derived breeds that are between 0.4 and 1.6
services. To assist in a decision regarding the relative mating behaviours for bulls of various
breed groups, the data in table 7 represents the average number of mounts and serves by
genotype and age in a 20 minute assessment. Bos indicus bulls can perform well in the yard
test with restrained females. Young virgin Bos indicus bulls do need a degree of sexual
experience, particularly when they have been kept separate from the females from weaning
to 2-3 years of age.
Table 7. The average number of mounts and serves by genotype and age in a 20 minute
assessment (BullPower studies).
Genotype Age (years) Mounts Serves
British 2+ - 3.0
Brahman 2 2.3 0.4
4+ 3.3 0.7
5/8 Brahman 4+ 2.2 1.0
Santa Gertrudis 2 5.5 0.9
3 5.8 1.6
4+ 4.4 1.2
Belmont Red 2 6.9 2.5
3 6.2 2.9
In several trials using multiple sire matings, one trial found that where bulls of similar age
were mated to 150 heifers, the bulls varied greatly in performance. The number of calves
produced by each bull ranged from 2% of progeny to 34%. Another trial using 3 bulls in
multiple sire matings revealed that one sire produced 60% of the calves, another 30%, and
another 3% of the calves. In Bos indicus bulls, the number of mounts plus effective serves
are a more useful indication of the bull’s ability to sire progeny.
Abnormalities detected during testing
• Premature spiral deviation of penis
Spiral deviation of the penis is a genetic problem in a percentage of bulls (fig. 20). It varies
in incidence between horned and polled bulls and between herds and breeds. One survey
reported an incidence of up to 25% in an individual herd. It frequently occurs in about 2-5%
19
26. Figure 20. Spiral deviation of the penis
viewed from the side of the bull.
of bulls over 4 years old in northern
Australia.
Spiral deviation is a condition where the
erect, free end of the penis of an affected
bull prematurely spirals to the right hand
side in an anticlockwise direction. The
effective width of the penis doubles, thus
preventing service. A characteristic of the
early stages of spiral deviation is that it
occurs intermittently. It appears to be more
common in beef than in dairy bulls and in
polled rather than horned bulls and gets
progressively worse as the bull reaches 5 to
6 years of age. Young bulls (12 to 24
month old) with the early stages of the
condition will achieve conception rates of
60-65% in 2 months of mating. This will
drop to 20-30% conception rates as the bull reaches 4 to 5 years of age.
Results showed that four bulls with moderate to severe spiral deviation of the penis attained
pregnancy rates of only 43%, 33%, 3% and 3% respectively. Corkscrew or premature spiral
deviation of the penis (fig. 20) has been reported in a range of breeds in Australia. Other
abnormalities identified during the serving ability test include:
• Other deviations
In some bulls the penis, upon erection, may deviate down or to one side as a result of a
previous physical injury. Following injury, an adhesion may develop between the penis,
prepuce and sheath. As the penis becomes erect, the adhesion restricts the free extension
and causes the penis to bend to one side or down (‘broken’ penis).
• Penile haematoma
Injury to the penis can cause the blood vessels to rupture causing blood to permeate
surrounding tissues causing a massive ‘blood blister’ or haematoma (fig. 16c). This inhibits
effective erection, causing pain to the bull and lowered fertility.
• Retained frenulum
This is a ‘tag’ of tissue on the free end of the penis that normally releases during maturity.
The end of the glans penis may be deviated back, reducing effective mating if the tissue is not
severed. This is apparently a heritable condition as it is seen more frequently in some herds.
• Pampilioma
Warts on the penis are reasonably common, but unless excessively large, will not affect the
bull’s sensitivity and ability to effectively serve cows (fig. 16b). These may disappear with
time.
• Granular posthitis
Granular infection of the prepuce is a common venereal disease, particularly in young bulls in
southern Australia which reduces the bull’s desire to serve because of the pain. It can be
treated with antibiotics and older animals may develop immunity.
Does serving capacity have a role in extensive northern Australia?
The serving capacity test as an assessment of mating potential has polarised producers in
their attitudes due to:
• the extensive nature of the pastoral industry with a range of management problems
• the predominance of Bos indicus cattle
• the ability to produce a tightly controlled mating season in Queensland is masked by wide
seasonal variation
20
27. • the lack of demand by producers for the test to be performed on bulls - What you ask for
is what you get!
• the conservative nature of the beef industry.
The BullPower project has demonstrated the positive benefits of serving ability testing and
the relationships between various measures of serving capacity and calf output of bulls.
Summary
There is no one complete bull evaluation test which will predict accurately that a given bull
will produce a certain number of calves per year.
The physical examination, together with the scrotal size, semen morphology and sheath
structure have proven to provide a practical test in the field. However, a pass in this test does
not automatically mean a given number of calves on the ground.
A bull’s capacity to serve is now being recognised as an additional necessary test prior to
mating to identify a bull’s mating potential and to detect any problems or abnormalities.
Producers are recognising that to operate a profitable beef enterprise, all cows must conceive
within about 84 days of calving i.e. six weeks calving to first oestrus and six weeks to go into
calf. Cows conceiving outside this time frame are not within the same constraints as the
TAXATION system or INTEREST RATES. We can no longer afford to buy a bull and forfeit a
drop of calves before we know that he is not functioning. A refund or repayment for a bull is
not an alternative since it is profits that suffer and long term viability undermined. Serving
capacity testing is part of the information on the label we must expect!
The Australian Association of Cattle Veterinarians (AACV) provide the above details on a Bull
Breeding Soundness certificate. Bull buyers should ask to cite a copy of this certificate
BEFORE purchasing any bull. Failure to seek out this necessary fertility information may lead
to the purchase of one of the 7% of bulls that do not sire any calves or the 58% that
produce less than 10% of calves.
21
28. 22
Selecting for structural soundness
Bulls represent half the genetics of the breeding unit, but in many herds, much less time is
spent on the detail involved in bull selection and bull management. Eyeball selection of bulls,
without any clear regard to functionally important reproductive traits, is still the most
common procedure for many bull buyers. As a consequence, all bull sales have some bulls
with reproductive, structural and walking abnormalities which are presented for sale and
purchased for use in breeder herds. Such bulls contribute to sub-optimal herd fertility levels
and break down at a younger age. The use of several bull soundness evaluation methods
assists in the identification of problems. The physical examination is quick and easy to carry
out and should be a routine procedure any time bulls are being inspected, for example, pre-
sale, pre-joining and at on-property culling. It has been suggested that 35 to 40 percent of
all unsound and sub-fertile bulls can be identified just by a thorough physical examination.
Any abnormalities that depress the bull’s fertility during mating should be identified. All bull
buyers should ask for an AACV Bull Breeding Soundness certificate prior to purchase of a
bull.
We need to continually remember that the bull should be regarded as a ‘sexual athlete’, i.e.
an animal completely sound and with the necessary ability and desire to perform the task he
has been purchased for - the production of plenty of calves of sound genetic merit.
Structural soundness
A breeding bull should be a worker who is never ‘off duty’. He should be able to walk (trot)
long distances, see, smell and have the urge and ability to detect females on heat. He should
be able to maintain his body condition.
Under extensive conditions of north Australia, bulls have to be capable of walking
long distances and of serving large numbers of females in a short period of time
when females ‘cycle’ following a ‘break’ in the season. Hence, limb and body
conformation is important not only for these reasons, but because these also
contribute to the bull’s longevity and usefulness as well as being transferred to
the progeny.
Important points of functional anatomy include:
• limb conformation, particularly hind limb
• hoof structure
• scrotal conformation and size
• sheath size, shape and contents
• shoulder and forelimb conformation
• body condition/weight
• pelvic size/opening
• eyes.
Conformation of the legs, feet and joints
Examination of hind leg conformation is an essential phase in evaluating bulls. Some limb
conformation defects are often regarded only as minor defects. However for some bulls,
minor defects often lead to functional problems as they age e.g. interdigital fibroma between
the claws.
Sound hind legs are vital to the breeding capacity of bulls, since during mating, most of the
bull’s weight is supported by the hind legs. A bull with hind leg defects may suffer pain on
moving or mounting and this may interfere with his desire to mate. As bulls with faulty
29. 23
conformation grow older, defects become more apparent and tend to interfere to a greater
extent with serving ability.
Frequently, young bulls are observed in which conformation of the legs and feet is poor. Look
at these carefully before making a decision to buy. Common problems in the legs include:
• sickle hocks and post legs (figs. 21b and c)
• bow legged (fig. 22b)
• cow hocked (fig. 22c)
Post legs or straight hind legs predisposes the bull to swollen hocks and to arthritis in the hip
and stifle joints. Swollen hocks can also result from grain feeding and physical injury from
fighting. In each case the swelling may be associated with pain and reduced mating
performance. Sickle hock bulls tend to be clumsy, particularly at service and when
dismounting. Each condition can adversely affect the bull’s serving capacity in the longer
term. Conversely, the bull will ‘break down’ earlier in life if it has straight legs or sickle hocks
as shown in figure 21d.
Figure 21. Hind limb conformation (a) normal (b) sickle hocked (c) post leg (d) swollen hocks.
Figure 22. Hind limb conformation (a) normal (b) bow legged (c) cow hocked.
(a) (b) (c) (d)
(a) (b) (c)
Many of these conditions are heritable and given the enormous stresses placed on the hind
limbs during serving, it is little wonder that bulls with these physical defects frequently break
down in the joints, leading to arthritic conditions, particularly in older bulls.
30. 24
Figure 23. Pastern angle of front and hind legs and associated claws; (a) correct structure
(b) weak in the pastern/long toes (c) too straight and worn toes.
Avoid overgrown scissor or curved claws. Curved claws (fig.
24) can also be the result of soft soils, e.g. black soil country
or over feeding. However, overgrown claws are usually
indications of poor limb structure or early signs of hip arthritis;
particularly in the hind limbs.
In addition to the shape of the hoof, buyers should beware of
growths between the claws. These growths start as horn like
lesions near the hairline of the hoof and can result in a
proliferative lesion. This lesion can cause the claws to part
and result in damage to the soft tissue of the hoof by sticks
and stones (fig. 25). Cracks in the hoof particularly vertical
cracks should be avoided by bull buyers.
Finally, the gait needs to be that of a well-coordinated animal.
Particular care needs to be taken in evaluating older animals
to ensure that arthritic problems in the rear limbs, joints and
back, as well as congenital (probably heritable) defects, such
as stringhalt are not present.
The walk
Bulls should normally place their hind feet in the prints of the
front feet and carry straight through as they walk out freely.
When looking at a bull from behind, the legs should be
straight - up and down - and not too bow legged (fig. 22b).
Overstepping or understepping may be linked to serving
inability of the bulls. Bulls that understep often have straight
hind legs and have increased problems in seeking the vulva
and in the final thrust for ejaculation. Continued problems
result in arthritis and serving incompetence. Worn toes, an
(a) (b) (c)
Correct
Too much
angle Too straightNormal Worn claw
Scissor
claw
Large outside
claw & long
curled toe
Common problems in the hooves relative to normal size and shape (fig. 23a) include:
• long, narrow hooves with shallow heels, often associated with weak hocks and pasterns
(figs. 21b and 23b) and sometimes form scissor hooves.
• short hooves, worn at the toe, often associated with straight hind legs (figs. 21c and 23c)
Figure 24. Uneven toe
length and scissor claw
Figure 25. Interdigital
fibroma
31. 25
indicator of dragging the hoof, would suggest straight hind legs (figs. 21c and 23c). Uneven
toes can be the result of an arthritic condition in the hip or stifle joint as well as abnormal leg
movement.
Structural soundness of limbs is not only important for bulls but also for heavy weight steers.
In the past there have been reports of up to 30 percent of steers fed over 150 days in
feedlots for the heavily marbled Japanese market which have not been able to be finished
appropriately and have had to be marketed elsewhere. Ensuring steers are structurally sound
before entering the feedlot can help overcome some of these problems.
Eyes
Viruses, animal age, genetic background, UV light and solar activity have been implicated in
the development of eye lesions. Bos taurus type cattle have a higher proportion of squamous
cell tumours in unpigmented or partially pigmented regions around the eyes.
Pop eyes protrude from the profile of the head, predisposing the bull to cancer eye or injury
to the eye.
Eye cover has had little attention from some breeders whilst pigmentation has received a lot
of attention from Poll Hereford and Hereford breeders alike. From practical observations, eye
cover or hooding with well set eyes
(fig. 26) would appear to not only provide
greater physical protection, but also ensure
decreased glare, ultra violet light and
reduced fly related problems. In general,
eye diseases are more prevalent in white-
faced breeds rather than Bos indicus
breeds. The disease most frequently
encountered is Infectious Bovine
Keratoconjunctivitis (IBK) which commonly
results in ulceration of the central corneal
area. This may eventuate in scarring of
whole or part of the cornea-pink eye or
‘blue-eye’ as it should be called. Entropion,
a condition where the eyelashes contact
the cornea of the eyes, can cause irritation
and weeping of the eye. It is likely a
heritable condition and is found in several
breeds.
Figure 26. Well hooded eye on a Droughtmaster
bull showing eye lashes extended free of the
eye ball.
While eyes gain considerable attention, the severe economic impact from other less obvious
traits may indicate the need for a more balanced selection procedure.
32. 26
Selection using a Bull Breeding
Soundness Evaluation certificate
Selection of bulls that meet minimum fertility standards has been a difficulty to many beef
producers for a long time. For some time, limited reproductive information has been included
in sale catalogues. Limited, because many seedstock producers only supply the information
that buyers either ask for or are prepared to pay for. The BullPower project focused on
northern Australian conditions and particularly tropically adapted breeds and has identified
many important reproductive traits critical for the bull to transfer his genetics to the breeder
herd.
Subsequent to this study, the Australian Association of Cattle Veterinarians has incorporated
these findings into a Bull Breeding Soundness Evaluation (BBSE) certificate. This certificate
provides a standard of assessment for veterinary evaluation of the various reproductive traits
important to beef producers. This evaluation should be conducted prior to sale and details
the identification of the sire, date and location where the evaluation was conducted, the
assessments made and relevant disease information (as shown in the example in fig. 27). It
is purely an evaluation of a range of measures on that date on which it was done and does
not provide any guarantee or imply the number of calves that the bull will sire in either single
or multiple sire matings. It is not a genetic evaluation of reproductive traits, but an indication
of the animal’s present reproductive function. However, this certificate is far superior to ‘the
lack of’ or ‘distorted information’ that is frequently available to many bull buyers at present.
This evaluation can also be conducted on property as an annual bull test prior to mating to
identify any bull that is declining in fertility.
These certificates should be sought out by bull buyers when choosing between bulls as they
also provide details of aspects of the evaluation that cannot be seen in the live animal e.g.
percent normal spermatozoa and serving capacity details. In the sale catalogues, bull sellers
are able to provide in association with each bull in the catalogue / or list, a summary of the
tests conducted by the examining veterinarian. An example of this summary will be in the
form of:
Scrotum
35.5
Physical Semen Morphology
P
Serving
nt
35.5 = Scrotal size in cm, = Pass, P = OK under natural mating, = Fail,
na = Not applicable and nt = Not tested.
33. 27
Bullville Veterinary Clinic
Address
Station Road,
PO Box 30, Indooroopilly, Qld 4068
Phone 07 3378 7944
Fax 07 3878 3559
Mobile04 2747 8239 Email: bullivets@email.com.au
Veterinarians
Dr Maree Jones
Dr Tom Smith
Dr John Citizen
Report: Bull Breeding Soundness Evaluation
This report was compiled exclusively for the use of the person to whom it is addressed.
No other person or corporation has any authority to make use of any or all of this
report.
This report is valid only when signed by the evaluation veterinarian and the bull’s
owner or agent.
Summary
To: Mr Jack Sheperd Handsome Station, Julia Creek, Qld 4000
Place of examination: Handsome Station Date: 03 March 2003
Brand: GB on offside Breed: Brahman
Bull: Age
Number/name: Yr:Mn
Charter Stowers 1965 2:02
Scrotum
35.5
Physical Semen Morphology Serving
I hereby certify that information included in this report is in full
accordance with the standards for evaluation and reporting bull
breeding soundness as published by the Australian Association
of Cattle Veterinarians.
I hereby certify that there has been no medical or surgical
intervention of congenital abnormalities of the listed bull(s),
whether genetic or not, to enable the above-mentioned
standards to be met.
Data Recorded:
Veterinarian:
Signature:
-----------------------
Owner/Agent:
Signature:
-----------------------
Physical Serving
Condition Score 4 Serves 5
Testes Tone 3 Penis Normal
Penis Slightly deviated MS function MMMSMSMSSS
Feet Normal
Legs 2
Leg joints Normal
Gait Acceptable
Head Normal
Semen
Density 4
Mass Activity 3
Motility 80%
Morphology
Normal Sperm 76%
General comment: This bull will function well in multiple sire matings but has not been vaccinated
for the venereal diseases.
Figure 27. A Bull Breeding Soundness Evaluation (BBSE) certificate.
34. Selecting for growth
Objective selection for growth can be based on weight, average daily gain and weight ratios
as well as BREEDPLAN estimates of genetic merit. Selection of animals using an animal’s
actual measure of weight and daily gain do not allow for differences in management, age,
etc, between animals. Weight ratios only allow accurate ranking of animals within a group
where all animals are treated the same and are similar in age. The best method of selecting
is that based on an EBV which is calculated in BREEDPLAN.
For growth related traits, BREEDPLAN provides information about:
• 200 day growth, recorded between 81-300 days of age
• 200 day milk, recorded between 81-300 days of age
• 400 day yearling weight, recorded between 301-500 days of age
• 600 day final weight, recorded between 501-700 days of age.
Each of these ranges are recorded by the breeder during the periods shown above and
adjusted to the 200, 400 and 600 days.
The 200 day Milk EBV is the kilograms of growth due solely to milk, compared to the 200 day
growth that is kilograms of actual growth from the growth genes. Birthweight EBVs may also
be available but are optional for the breeder to record. They are useful to bull buyers where
dystocia or calving difficulty is a problem in the herd. Selecting a bull for higher 200 day milk
EBVs may increase the female progeny’s milk production but decrease their subsequent
fertility as nutritional levels become limiting in times of reduced pasture availability.
How can the producer use the 600 day EBV figure
and what does it mean?
Buying a bull with the aid of EBVs can be likened to picking a bull after having checked out
all the relatives. The EBV for each trait is a measure of the animal’s own performance as well
as the performance of as many of the animal’s relatives as possible.
Comparing EBVs for 600 day weight in kg
Comparing Bull A (EBV = +40kg) with Bull B (EBV = +20kg)
The progeny get half their genes from each parent.
therefore: [Bull A +40 x ½ = +20kg] – [Bull B +20 x ½ = +10kg]
Progeny from Bull A should weigh 10 kg more on average at 600 days
than those from Bull B.
Currently BREEDPLAN provides EBVs for six growth traits, five fertility traits and six carcase
traits (table 8). The growth traits of most interest to northern cattle producers will vary
depending on the genotype of their herd and the market they are producing for. For example,
birth weight EBVs at present are of less interest to Brahman breeders than to those using
Bos taurus genotypes.
28
Table 8. BREEDPLAN EBVs presently available
Growth Fertility Carcase
Birth weight (kg) Scrotal size (cm) Carcase weight (kg)
200 day milk (kg) Days to calving (days) Eye Muscle Area (EMA) (cm2
)
200 day weight (kg) Gestation length (days) Rib fat - 12/13 th
rib (mm)
400 day weight (kg) Calving ease (direct) Rump fat - P8 (mm)
600 day weight (kg) Calving ease (daughters) Retail Beef Yield % (RBY %)
Mature cow weight (kg) Intra-muscular Fat% (IMF %)
For example:
35. How can the producer compare and recognise
the benefits of EBVs on two bulls?
Remembering that the bull only passes half his genetics on to the progeny - half this EBV is
used to make the comparison.
For example: A comparison of 2 bulls
EBVs (kg)
200 Day 200 Day 400 Day 600 Day
Milk Growth Growth Growth
Bull A +2 +10 +20 +40
Bull B +6 +4 +10 +20
Conclusion: Bull A’s progeny will be on average:
• lower milk producers
• 3 kg heavier at weaning (due to own growth genes)
• 5 kg heavier at 400 days
• 10 kg heavier at 600 days.
Bull A would be more suited to the northern environment, assuming the bull buyer was
looking for bulls to breed heavy steers. On the other hand, Bull B would be suitable where
the bull buyer wishes to increase the milk production of his females and still increase the
potential for improved growth. These decisions would then be influenced by the productivity
of the existing herd for the respective traits. Hence the producer defines the required
breeding objectives.
In addition, when selecting a bull on EBVs, consideration should be made of the breed
average EBV for that trait in order to identify the relative merit of that bull. “Percentile bands”
are also published by each breed society to identify the relativity of EBVs in 10% increments.
Accuracy information
Whilst EBVs are calculated with the best possible information to give a measure of the
animals genetic merit, ‘accuracy information’ is a measure of risk and is quoted as a percentage.
For example:
The higher the accuracy %, the more confident the producer can be that the bull will
perform according to the EBV. The more records available on any animal and the more
records on known relatives, then the greater the accuracy on that individual. The accuracy
figure of 63% means that the 600 day EBV could be between 35 and 45 kg, compared to a
95% result which confirms that the EBV is +40 kg. For example, older sires and sires used
for artificial insemination (AI) tend to have higher accuracy figures, because there is more
information available. Sires appearing in the GROUP BREEDPLAN summaries have accuracies
of 75% or better for at least one trait.
The potential longer term gains through the selection of sires with the aid of BREEDPLAN has
been identified by Heather Burrow and Tom Rudder. They used a herd model for a
commercial herd of 1000 adult equivalents in central Queensland to estimate the effect of
using bulls with high EBVs for 600 day weight on the profitability of the herd.
Table 9 shows that in their calculations, the use of bulls with high EBVs for 600 day weight
increase annual gross margins by 6.4, 7.6 and 8.3% after 5, 10 and 15 years respectively.
This increase in gross margin could be achieved while running fewer cattle, leading to
greater sustainability of the enterprise.
29
EBV (600 day weight) Accuracy %
Bull A +40 kg 95%
Bull C +40 kg 63%
36. Table 9. Profitability of using bulls with high EBVs for 600 day weight.
Annual income Years after start of selection
and costs
0 5 10 15
Gross income ($) 192 600 205 200 207 700 209 100
Less direct costs ($) 11 100 12 200 12 300 12 500
Gross margin ($) 181 500 193 000 195 400 196 600
No. head 1361 1332 1295 1271
Gross margin/head 133 145 151 155
Gross income includes bull purchasing and direct costs.
Direct costs include animal health, supplementation and transport costs.
The gross margins referred to here are based on the assumption that there has been no
change in feed efficiency associated with the improvement in growth rate. Results are now
coming in from feedlots which indicate that improved EBVs for growth rate will often be
associated with improvements in feed conversion efficiency. This could lead to even greater
improvement in gross margin in the above situation and has also led to the feedlot industry
seeking steers with higher EBVs for growth rate. These growth rates can then be expected to
give improved feedlot performance.
Put simply, if the producer is faced with the choice between two bulls; one a +20 (600 day
weight) EBV bull and the other a +4 (600 day weight) EBV bull (the time that we sell our
steers), the initial bull is more profitable. When placed over some 33 cows with 85%
branding rates and kept for 5 years, then the higher EBV bull will produce 1120 kg of extra
beef. At $1.10 net/kg, the bull can be expected to produce progeny that are heavier and
return an additional $1232.00 in the progeny over the life of the bull. In addition, the +20
bull will leave genetically superior females in the herd.
Producer demonstration sites across Queensland using Brahman, Belmont Red and Santa
Gertrudis genotypes have clearly demonstrated that gains of $47.00 per head or a premium
of 10% was achieved as a result of using higher EBV sires in one calf drop. The combination
of selection for greater growth plus increased reproductive performance resulted in greater
than a 400% increase in weight of calves weaned per sire (see Beef Cattle Recording and
Selection, pages 39-42).
Cumulative profit
Using BREEDPLAN, any genetic gain in one generation is passed onto the next generation so
that this genetic gain and the associated profits are cumulative. If, for example, you feed a
supplement or use a hormonal growth promotant in order to increase growth rate, you only
get the improved results in the animals that you treat. In the next generation you have to
repeat the treatment and the cost in order to get the same improvement. With genetic
improvement, each successive generation receives the gains from the previous generation
absolutely free because selection has fingerprinted the improved production into the animal’s
genetic bank.
Through the continued use if BREEDPLAN, each successive generation has its additional gain
tacked on to the previous gains. Furthermore, the bull with extra genes for growth (higher
EBVs for the particular market characteristic) will pass these genes onto all progeny each
year while the bull is in the herd, not just the immediate year of use as is the case with
supplementary feeding and hormonal growth promotants. A gain of $1232 per bull in the first
selection round which has been demonstrated above, becomes $2464 in the second and
$3696 in the third, provided that the selection is based on similar EBVs. This doesn’t happen
with many other forms of on farm improvement.
30
37. Feed efficiency
In addition to growth, the Net Feed Intake (NFI) of an animal describes the ability of an
animal to convert kilograms of feed consumed to kilograms of beef. More efficient animals
eat less for each kilogram of carcase gain. NFI has been measured using feeding trials
conducted over a 30-day feeding period. More recently, the CRC (Cattle and Beef Quality)
research has identified an Insulin like Growth Factor (IGF-1), a hormone, in the blood to be
positively correlated with the animals’ net feed intake. Therefore, a more negative NFI is
more efficient.
Ultimately, an EBV for net feed intake will be appropriate for selection in the beef industry.
More efficient animals tend to have more muscle and less fat, which could have some
undesirable side effects in the more harsh environments relative to the fertility of the
subsequent breeder herd.
31
38. Selecting for carcase attributes
Stud breeders regularly say ... ‘We supply what the commercial breeder pays most for’.
The sad fact of life is that many commercial producers complain that the studs
over-feed their bulls and that they have to be ‘let down’ before they will work.
Yet they still pay high prices for the fat bull.
Most beef producers want ‘feedback’ but fail to see that they are sending the wrong feed-
back to studs themselves. Unfortunately there are still some cattle buyers who have difficulty
in visualising ‘what is fat’ and ‘what is muscle’ in the live animal.
Over-fat bulls do not work as well as bulls in forward store or working order. Obese bulls
tend to have lower libido or desire to serve cows, arthritic conditions and deteriorating
semen quality. This is no surprise since people find work more difficult the more obese they
become! On the other hand, the feeding of bulls in preparation for sale is a major
unnecessary cost borne by the industry.
The Australian beef industry is fast adopting value based trading. More animals are being
objectively measured in the meatworks and the buyer is purchasing according to measured
specifications. Measurements recorded focus on: fat, in relation to depth, colour and
distribution; muscle, in relation to, colour, texture, pH and eye muscle area; and carcase
weight. As a result, there are an increasing number of carcases which are traded with
records of Retail Beef Yield % (RBY%).
In order to make positive gains using the genetic differences between animals, producers
must be aware of how to make use of EBVs for fat depth at the 12/13th
rib and P8 site, EBVs
for retail beef yield %, intra-muscular fat % and the other indicators based on genetic
differences in the herd.
There will still be many occasions when producers will have to buy or select bulls without this
information and they must then rely on an alternative method of selection.
Cattle producers need to have a mental picture of the skeleton of the bovine in order to
visualise just what is muscle and what is fat. Information in figure 28 illustrates the bone
structures and placements which are common to cattle and in fact are very similar for most
large farm animals.
From the skeleton and our knowledge of cattle, there are several parts of the animal where
the bones have only a covering of skin, cartilage and connective tissue. From the front to the
rear, these are the head and tail. As the animal increases in weight, the ribs and loin are
covered with increasing amounts of fat. Animals under a fattening phase form a layer of fat
between the connective tissues covering the bones and the skin layer. When an animal is
handled in these areas the majority of tissue felt under the hide is fat.
Where is fat deposited in large amounts?
32
Figure 28. Relationship between the sternum, the elbow and P8
site.
Point of the
elbow
Sternum
12/13th
rib site
P8 site
From figure 28, the relative
placement of the brisket to the
point of the elbow can be
seen. The sternum (brisket
bone) is approximately 5-9 cm
below the point of the elbow.
The sternum is covered
predominantly with fat and to a
lesser extent with about 2-3
cm of muscle at the navel end.
A low hanging, full brisket
contains large amounts of fat.
Looking at the animal from the
39. Figure 29. Front view of two animal types:
(a) lean, with good indication of muscle,
(b) fat, with poor indication of muscle.
(a) lean (b) fat
Figure 30. Side view of two animals: (a) lean animal (b) a fat bull showing a deep brisket and a
full flank.
Figure 31. Rear view of two animals of
different conditions showing: (a) lean,
with a good indication of muscle (b) fat,
with a poor indication of muscle.
(b) fat(a) lean
x x
x x
(a) lean (b) fat
Figure 32 (a) Well muscled bull - muscle
score B (b) less muscled bull - muscle
score C+. Note the width of the placement of the
back feet at the hocks and on the ground.
(a) (b)
33
front, a fat animal has a rounded, full, deep brisket
(fig. 29b).
What do we see in the flank of a
fat animal?
The flank contains very little muscle, possibly 1.5 cm.
The flank also tapers upward toward the stifle joint
(knuckle) of the animal. As an animal gets fatter, the
flank region thickens, filling with fat deposits and
causing the animal to have a straight underline as shown
in figure 30b.
The rear view of a fat animal reveals a ‘full cod’ and with
the space between the ‘topside’ between the legs filling
with fat as shown in figure 31b.
What parts of the animal are mostly all muscle?
From figure 29, site X illustrates the forearm and indicates the area on all animals that
contain minimal amounts of fat with mostly muscle covering the bone in the centre.
Similarly the site indicated by X in figure 31 from one side of the animal to the other is only
muscle with a very small layer of fat just under the skin. This is a line from just behind the
stifle passing through the silverside and topside - topside and silverside, which are the major
cuts of meat we are familiar with.
x x x x
40. A convex or bulging muscle down either side when looking from behind would suggest a well
muscled animal which stands with his feet well apart. Figure 32 shows two bulls – one well
muscled bull (muscle score B) and one with less muscle (muscle score C).
What about eye muscle area?
The eye muscle lies neatly above the ribs and beside the vertical spinal processes on either
side of the back bone. As an animal fattens, fat deposits are laid down around this muscle
which can often give a false impression of the musculature or muscling of that animal.
Evaluation of a bull is therefore best done from the ground up. Look at his feet, his underline
fat deposits and then upwards. Do not be misled by the nice round back, the square tail
head with no muscle seams. These all indicate the bull may be carrying high levels of fat, be
over fed and potentially have poor fertility.
The actual eye muscle area can be measured by scanning in the live animal using ultra sound
equipment. The size will be reported as an EBV for eye muscle area in cm2
. This provides an
additional indication of the degree of muscling in the animal. At the same time, the fat depth
can be measured at both the 12/13th
rib and P8 site. These measurements are used in the
calculation of retail beef yield and ultimately the EBV for RBY%.
What is the ‘retail beef yield’ in an animal?
The aim of all beef producers is to increase the amount (kg) and quality of beef sold off the
limited area and pasture resources of the property.
Retail beef yield is the percentage of saleable beef measured for a 300 kg carcase, with 2-3
mm fat trim and 85% chemical lean.
Retail beef yield is primarily determined by the weight of the animal, the degree of fatness
and to a lesser extent by eye muscle area. Eye muscle area influences the retail beef yield by
about 9% and has therefore only minimal impact relative to the weight and fatness of the
animal. For a constant retail beef yield %, the liveweight and therefore EBV for turnoff
weight has significant influence on the retail beef yield %.
To modify fat in progeny, bull selection can be based on EBVs for fat at both the 12/13th rib
and P8 site. In addition, this will be reflected in the distribution of fat.
Selecting for tenderness
Tenderness of beef is one of the traits frequently identified by consumers as a desirable trait
for eating quality. The CRC (Cattle and Beef Quality) has clearly identified that beef
tenderness can be modified genetically. Tenderness can be improved by selecting bulls that
have a longer ‘flight time’ or are more docile. Like marbling, producers may also note the
DNA test results for tenderness. This test focuses on the Bovine Calpastatin gene where the
results will be reported as 0-star (2 tough alleles), 1-star (1 tender, 1 tough) and 2-star (2
tender alleles). The use of sires carrying 2-star results will reduce the number of progeny
with tough beef. However, producers are reminded that this selection decision should be
relative to the market requirements for their beef. An EBV for tenderness will ultimately be of
greater value in bull selection.
Selecting for marbling
The amount of intra-muscular fat is scored in carcases as a Marble Score (MS). In the live
animal the ultrasound measurement at the 12/13th
rib provides a percentage of intra-
muscular fat in the eye muscle. This measurement is then converted to a genetic difference
of an EBV for IMF%. In addition, beef producers can note the DNA marker results that will
provide 0-star, 1-star or 2-star results to increase the marbling potential in their herds.
34