1. Update - Global & Indian Markets. We are launching a fully Contact Details:
dedicated website by
Market & Macro View. 7 th-Nov’11 CogentConsultingGroup
For week ending21-Oct’11 www.finexpertise.blogspot.com
Research Analyst: Rajat Dhar rajat.dhar1@yahoo.com
Market Commentary - Global + (91) – 9999.760.359
Commodities*
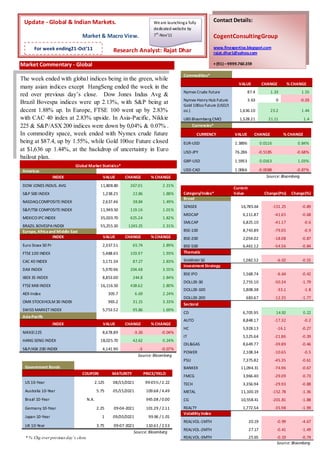
The week ended with global indices being in the green, while
Q VALUE CHANGE % CHANGE
many asian indices except HangSeng ended the week in the
Nymex Crude Future 87.4 1.33 1.55
red over previous day’s close. Dow Jones Indus Avg &
Nymex Henry Hub Future 3.63 0 -0.03
Brazil Bovespa indices were up 2.13%, with S&P being at Gold 100oz Future (USD/t
decent 1.88% up. In Europe, FTSE 100 went up by 2.83% oz.) 1,636.10 23.2 1.44
with CAC 40 index at 2.83% upside. In Asia-Pacific, Nikkie UBS Bloomberg CMCI 1,528.21 21.11 1.4
225 & S&P/ASX 200 indices were down by 0,04% & 0.07% . Currencies*
In commodity space, week ended with Nymex crude future CURRENCY VALUE CHANGE % CHANGE
being at $87.4, up by 1.55%, while Gold 100oz Future closed EUR-USD 1.3896 0.0116 0.84%
at $1,636 up 1.44%, at the backdrop of uncertainty in Euro USD-JPY 76.286 -0.5185 -0.68%
bailout plan.
GBP-USD 1.5953 0.0163 1.03%
Global Market Statistics*
Americas USD-CAD 1.0066 -0.0088 -0.87%
INDEX VALUE CHANGE % CHANGE Source: Bloomberg
DOW JONES INDUS. AVG 11,808.80 267.01 2.31%
Current
S&P 500 INDEX 1,238.25 22.86 1.88% Category/Index* Value Change(Pts) Change(%)
Broad
NASDAQ COMPOSITE INDEX 2,637.46 38.84 1.49%
SENSEX 16,785.64 -151.25 -0.89
S&P/TSX COMPOSITE INDEX 11,949.50 119.16 1.01%
MIDCAP 6,111.87 -41.65 -0.68
MEXICO IPC INDEX 35,020.70 625.24 1.82%
SMLCAP 6,825.10 -41.17 -0.6
BRAZIL BOVESPA INDEX 55,255.20 1245.25 2.31%
Europe, Africa and Middle East BSE-100 8,743.89 -79.05 -0.9
INDEX VALUE CHANGE % CHANGE BSE-200 2,054.02 -18.08 -0.87
Euro Stoxx 50 Pr 2,337.51 65.74 2.89% BSE-500 6,461.12 -54.56 -0.84
FTSE 100 INDEX 5,488.65 103.97 1.93% Thematic
CAC 40 INDEX 3,171.34 87.27 2.83% SHARIAH 50 1,082.52 -6.02 -0.55
Investment Strategy
DAX INDEX 5,970.96 204.48 3.55%
BSE IPO 1,568.74 -6.64 -0.42
IBEX 35 INDEX 8,853.00 244.8 2.84%
DOLLEX-30 2,755.10 -50.34 -1.79
FTSE MIB INDEX 16,116.50 438.62 2.80%
DOLLEX-100 1,808.38 -33.1 -1.8
AEX-Index 305.7 6.69 2.24%
DOLLEX-200 683.67 -12.35 -1.77
OMX STOCKHOLM 30 INDEX 965.2 31.15 3.33%
Sectoral
SWISS MARKET INDEX 5,753.52 95.86 1.69%
CD 6,705.95 14.92 0.22
Asia-Pacific
AUTO 8,848.17 -17.32 -0.2
INDEX VALUE CHANGE % CHANGE
HC 5,928.13 -16.1 -0.27
NIKKEI 225 8,678.89 -3.26 -0.04%
IT 5,525.64 -21.86 -0.39
HANG SENG INDEX 18,025.70 42.62 0.24%
OIL&GAS 8,649.77 -39.89 -0.46
S&P/ASX 200 INDEX 4,141.90 -3 -0.07%
POWER 2,108.34 -10.65 -0.5
Source: Bloomberg
PSU 7,375.82 -45.35 -0.61
Government Bonds BANKEX 11,094.31 -74.96 -0.67
COUPON MATURITY PRICE/YIELD
FMCG 3,966.40 -29.09 -0.73
US 10-Year 2.125 08/15/2021 99-05½ / 2.22 TECH 3,356.94 -29.93 -0.88
Australia 10-Year 5.75 05/15/2021 109.68 / 4.49 METAL 11,100.19 -152.78 -1.36
Brazil 10-Year N.A. 945.08 / 0.00 CG 10,558.41 -201.81 -1.88
Germany 10-Year 2.25 09-04-2021 101.29 / 2.11 REALTY 1,772.54 -35.98 -1.99
Volatility Index
Japan 10-Year 1 09/20/2021 99.96 / 1.01
REALVOL-1MTH 20.19 -0.99 -4.67
UK 10-Year 3.75 09-07-2021 110.61 / 2.53
REALVOL-2MTH 27.17 -0.41 -1.49
Source: Bloomberg
* % Chg over previous day’s close. REALVOL-3MTH 25.65 -0.19 -0.74
Source: Bloomberg
2. Key U.S. Rates US 10-Yr government bond yields were at
CURREN T 1 MO PRIOR 3 MO PRIOR 2.22% on 2.125% bonds. It was 1.01% on 1%
Fed Funds Rate 0.08 0.1 0.02 Japan 10-Yr bond. US current unemployment
Fed Reserve Target Rate 0.25 0.25 0.25 rate was 9.1% , which was same as that of
Prime Rate 3.25 3.25 3.25 last month. 1-Month LIBOR increased to
US Unemployment Rate 9.1 9.1 9.2 0.24% up, from 0.23% last month. 3-Month
1-Month Libor 0.24 0.23 0.19
LIBOR was at 0.42%, up from 0.36% for last
3-Month Libor 0.42 0.36 0.25
month. LIBOR 1 & 3 Months rates have been
Source: Bloo mberg
increasing for the past 3 months now.
Prior period cross comparison of Indices
Wk (%) Monthly(%) Yearly(%)
3.8 1.6 3.7 0.9 3.6 0.5 5.0
2.6 0.2 2.3 2.8
-1.7 -0.1
SENSEX MIDCAP SMALL CAP BSE 100 BSE 200 BSE 500 SHARIAH 50
-5.3-5.3 -0.8
-1.1 -1.0 -0.8
-16.8 -11.4
*% change over previous days close Source: www.bseindia.com
BSE Sectoral Performance
-9.0
PSU
-17.7
-13.3 In broad based sectors, only midcap stood to
OIL & GAS
-2.0 gain by 0.2% over past one week, while sensex
7.3
IT
13.8
saw a steep fall of 1.7% followed by 0.1% fall in
25.3 Small Cap. Industry indices saw mixed response
FMCG
-8.5 with Consumer Durables, Healthcare & Oil &
32.9
CONSUMER DURABLES Gas seeing 0.2%, 1.3% & 1.1% weekly upside.
12.7
7.9 BSE-It was the worst performer with a fall of
AUTO
0.0 5.5% followed by metals ending with 2.4% in
5.0
SHARIAH 50 the red. Except Midcap stocks which are still
0.5 Yearly(%)
0.9 5.3% down as compared to its previous month’s
BSE 200
1.6 close, est broad based indices & sect oral
Monthly(%)
-11.4
SMALL CAP indices were still in green w.r.t their previous
-5.3
-16.8 Wk (%) month’s figures.
SENSEX
Top Sectoral Gainers Wk (%) Top Sectoral Losers Wk (%)
CONSUMER DURABLES 0.2 IT -5.5
HEALTHCARE 1.3 METALS -2.4
OIL & GAS 1.1 CAPITAL GOODS -1.4
Source: www.bseindia.com Source: www.bseindia.com
3. Sensex – Top Gainers & Losers
Source: BSE india
-2.81 Tata Motors
The week ended with L&T, Bharti Airtel & -3.08 Bharti Airtel
Tata Motors dragging the Sensex down, -3.54 L&T
with 3.54%, 3.08% & 2.81% fall over their
Hero MotoCorp 1.15
previous day’s close. However, the gainers
Bajaj Auto 1.52
were led by Hero Motocorp Bajaj Auto &
Maruti Suzuki 1.53
Maruti Suzuki with 1.15%,1.52% & 1.53%
gain respectively. -4 -3 -2 -1 0 1 2
%age Change over previous day’s close
ICDM – Indian Corporate Debt Market
ICDM saw the trade of INR 30,640.00 lacs as per the last data available. Largest turnover of INR 7500 lacs was
seen in Kotak Mahindra Prime Ltd, which currently has a yield of 10.48% with 10.15% coupon rate maturing on
07 July’13. Among the top 3 most traded, the other two are Tata Motors Ltd & SBI.
21 Oct 11 | 17:51
Maturity Weighted
Issuer Name Coupon (%) Yield Turnover
Date Average Price
KOTAK MAHINDRA PRIME LTD 10.15 26-04-2013 99.43 10.48 7500
NABARD 9.65 18-10-2014 100 9.65 5700
KOTAK MAHINDRA PRIME LTD 10.15 27-09-2013 99.36 10.51 5000
RURAL ELECTRIFICATION CORPORATION LTD 9.48 10-08-2021 98.45 9.72 2700
RURAL ELECTRIFICATION CORPORATION LTD 9.38 06-09-2016 98.71 9.71 2590
POWER FINANCE CORPORATION 9.46 01-08-2026 97.8 9.74 2500
POWER FINANCE CORPORATION 9.45 01-09-2026 97.66 9.75 1100
KOTAK MAHINDRA PRIME LIMITED 10.35 08-08-2014 99.66 10.46 1000
RURAL ELCTRIFICATION CORPORATION LTD 9.35 19-10-2016 100.02 9.34 1000
POWER FINANCE CORPORATION LIMITED 9.61 29-06-2021 99.44 9.69 600
POWER FINANCE CORPORATION 9.36 01-08-2021 97.61 9.74 500
RURAL ELECTRIFICATION CORPORATION LIMITED 0 15-12-2020 45.75 8.93 213
POWER FINANCE CORPORATION LTD 9.44 23-09-2021 98.18 9.73 100
TATA STEEL LIMITED 11.8 18-03-2099 107 0 30
MUTHOOT FINANCE LTD 12.25 14-09-2016 100.43 12.11 30
POWER GRID 7.51 15-10-2021 100 7.51 27
PNB HOUSING FINANCE LTD 9.55 12-09-2021 100.3 9.5 20
POWER FINANCE CORPORATION 9.7 09-06-2021 100 9.68 20
TATA POWER LIMITED 11.4 02-06-2099 103.9 0 10
Total 30640
Mutual Fund Inter-Scheme Transfer^
21 Oct 11 | 17:51
Coupon
Security Issuer Name (%) Maturity Date LTP Weighted Average Turnover
Code Price Yield (Rs. lakh)
965NAB2014 NABARD 9.65 18-10-2014 100 100 9.65 5,700.00
Source: www.nse-india.com * Rate is per Rs. 100/- of face value.
^MF Inter-scheme Transfer Turnover is part of Total ICDM Turnover.
4. Derivatives Market Watch
Underlying Expiry of Strike Traded LTP/Close Net Change Turnover Spot Price
Asset contract price (Rs.) Quantity (Rs.) (Rs.) (Rs.Lakh.) (Rs.)
SENSEX 09-Nov-11 - 176805 16860 -132 30012 16785.64
BAJT 09-Nov-11 - 124000 1638 34 2031 1640.55
SENSEX 09-Nov-11 17600 8520 92 -16.5 1509 16785.64
SBIL 09-Nov-11 - 55875 1950 12 1093 1948.6
SENSEX 09-Nov-11 17800 5400 116 6 967 16785.64
*Top 5 selected based on turnover value
Source: www.nse-india.com
Macro-Economic Updates - India
REAL SECTOR GDP*
20 18.8 Gross Domestic Product at current
18 prices
16.7 16.7
Agriculture
16
14 12.6 Industries
12
10 Services
10
7.7
8 Gross Domestic Product at
6 5.1 constant 2004-05 prices
3.9 Agriculture
4
* % Change figures in GDP is for the duration
2 Jan/11-Mar/11, over the previous
Industries
corresponding period.
0
Source: Ministry of Finance. Department of Economic Affairs
IIP*
12 4.5
General Mining 9.5 3.9
10 4 Capital Goods 3.7
8 3.5
Manufacturing Electricity Intermediate
6 4.5 3 Goods
4.1
4 2.5
Consumer
2 2 Goods
0 1.5 1.3
* % Change figures in IIP is for the Use Base
-2 1
duration May-11, over the previous classification
-4 corresponding period. 0.5
-3.4
-6 0
Source: Ministry of Finance. Department of Economic Affairs
5. CPI*
9.8 9.72
CPI -Industrial
9.6 Workers (CPI [IW])
9.44
9.4 9.25 CPI-Rural Labourers
9.2 (CPI [RL])
8.99
9 * % Change figures in CPI is for the duration
CPI-Urban Non- May-11, over the previous corresponding
8.8 Manual Employees period; except for CPI(UNMEI) for which it is
(CPI [UNME]) Dec-10.
8.6
Market last week - INDIAN MARKETS
Govt diapproves SBI rights issue In FY12, other means eyed
A much awaited rights equity issue by State Bank of India will not happen in the current fiscal year, but the government
will pump in cash to shore up the state-run bank's capital, Secretary, financial services D. K. Mittal said on Wednesday.
sought as much as 200 billion rupees ($4.1 billion)from the government t hrough a rights issue since last year to boost its
Tier-I capital. The lender reported Tier I capital ratio of 7.6 percent at the end of June, below the 8 percent level the
government has pledged to maintain in state banks.
Telenor's Indian unit to launch Rs 82 bn rights issue in 2012
Norway's Telenor said on Tuesday the planned rights issue by its Indian unit, Unitech Wireless, to raise 82 billion rupees
($1.68 billion) will take place next year. Telenor owns 67.25 per cent of the joint venture while Indian real estate firm
Unitech owns the remainder. The rights issue has been delayed after Unitech obtained Department of"stay order", which
Source: Ministry of Finance. a court's Economic Affairs
Telenor said has been cleared by another Indian court, allowing the to proceed with the planned issue.
Axis Bank Q2 net up 25 pct
It was led by loan growth & higher fee income. The bank however, expects its net interest margins (NIM) to moderate
from current levels as cost of funds rise due to successive rate hikes by India's central bank. Axis Bank said its net profit
in the September quarter rose to 9.2 billion rupees ($184.6 million) from 7.35 billion rupees a year ago. Its net interest
income grew 24.2 percent to 20.07 billion rupees, higher than street estimates. The lender's net interest margin, a key
gauge of profitability, rose to 3.78 percent compared with 3.68 percent a year ago. it expects to complete the transfer of
brokerage Enam Securities' investment banking and equities businesses into itself by the last quarter of the current
financial year ending March, after obtaining the necessary approvals.
GLOBAL MARKETS
EU hearing on D.Boerse, NYSE Euronext deal likely October 27
EU regulators are expected to hold an oral hearing on October 27 on Deutsche Boerse's plan to acquire NYSE Euronext, a
person with direct knowledge of the matter said on Wednesday.
The European Commission is now assessing the $9 billion deal and is scheduled to decide by December 13 whether to
clear the takeover. Securing EU approval is considered to be the biggest hurdle for the operators, bigger even than U.S.
watchdogs.
Investors retreat from gold; opt for equities
Gold slid on Wednesday as higher hopes of a resolution to the euro zone debt crisis persuaded investors to shrug off a
downgrade to Spain's credit rating and opt for equities, but a softer dollar helped provide some support. Spot gold was bid
at $1,653.30 a troy ounce at 0945 GMT from $1,658.64 an ounce late in New York on Tuesday. European stocks and the
euro rose on optimism policymakers will take major steps at a summit this weekend to solve the festering debt crisis and
offset the impact from a cut to Spain's sovereign credit rating. That was denied by senior European Union officials, but
not before the tone for the day was set.
China, ASEAN move closer on Yuan
China is working on an agreement with the Association of Southeast Asian Nations to settle trade in yuan, the official
Xinhua News Agency reported Saturday, citing a Chinese central bank official.
6. About The Analyst:
Profile:
Rajat Dhar is an Investment Banking Analyst who holds a Bachelor of Engineering Degree from University
of Pune, and has done PGDM in Marketing. He started his career as a banker in HDFC Bank Ltd and
subsequently moved into Wealth Management space in HSBC. He has approximately 3.5 Years of Banking
& Wealth Management expertise. He is IRDA & AMFI-Dealer’s Module certified. He has undertaken
rigorous training in Financial Modelling and Investment Banking at ARC Academia, India Office of Wall St.
Training Institute – New York.
Key Expertise:
He is an independent Investment Banking Analyst with expertise in Oil & Gas segment.
His core specialities include Financial Modelling / Equity Reports / Company Reports / Sector Reports /
Transaction Advisory / Trading Comparables / DCF Valuation / Pitch Books / Equity Portfolio Management /
Financial Planning & Advisory.
He is a visiting faculty at Amity University, and has co-chaired many panel discussions with latest being “The
paradigm shift in Financial Markets post liberalisation of 1990s, and its impact on Global Markets”. His
research reports are also published at Thomson Reuters.
His works are publically available at: http://www.fixexpertise.blogspot.com
Contact Details
Analyst: Rajat Dhar Blog: www.finexpertise.blogspot.com
Cogent Consulting Group – Research Advisory & Consulting
For more copies or other information, contact
Institutional/Retail: Rajat Dhar
Phone: + (91) 9999.760.359 E-mail: rajat.dhar1@yahoo.com
Blog: www.finexpertise.blogspot.com
Cogent Cons ulting Group, 3rd Floor, Malviya Nagar, New Delhi 110 017.
Disclaimer
This document does not constitute an offer or solicitation for the purchase or sale of any financial instrument or as an offi cial confirmation of any transaction. The
information contained herein is from publicly available data or other sources believed to be reliable, but we do not represent that it is accurate or complete and it should
not be relied on as such. Research Analyst shall not be in any way responsible for any loss or damage that may arise to any person from any inadvertent error in the
information contained in this report. This document is provided for assistance only and is not intended to
be and must not alone be taken as the basis for an investment decision. The views expressed may not be suitable for all investors.
This information is strictly confidential and is being furnished to you solely for your information. This information should not be reproduced or redistributed or passed on
directly or indirectly in any form to any other person or published, copied, in whole or in part, for any purpose. This report is not directed or intended for distribution to,
or use by, any person or entity who is a citizen or resident of or located in any locality, state, country or other jurisdiction, where such distribution, publication,
availability or use would be contrary to law, regulation or which would subject Research Analyst to any registration or licensing requirements within such jurisdiction.
The distribution of this document in certain jurisdictions may be restricted by law, and persons in whose possession this document comes, should inform themselves
about and observe, any such restrictions.
The information given in this document is as of the date as mentioned in the report and there can be no assurance that future results or events will be consistent with this
information. This information is subject to change without any prior notice. Research Analyst reserves the right to make modifications and alterations to this statement as
may be required from time to time. However, the Research Analyst is under no obligation to update or keep the information current. Nevertheless, the Research Analyst
is committed to providing independent and transparent recommendation to its client and would be happy to provide any information in response to specific client queries.
The Research Analyst shall not be liable for any damages whether direct, indirect, special or consequential including lost revenue or lost profits that may arise from or in
connection with the use of the information. Past performance is not necessarily a guide to future performance. T he analyst for this report certifies that all of the views
expressed in this report accurately reflect his or her personal views about the market, subject company or companies and its or their securities.
Copyright (c) 2011 Rajat Dhar
We are Launching a fully dedicated website for
Research & Valuation in a week’s time by 1st
Nov’11, hosting scores of Research Reports.
Stay in touch.