
Recommended
Recommended
More Related Content
What's hot
What's hot (13)
Viewers also liked
Viewers also liked (15)
Similar to Employment in Small Enterprises
Similar to Employment in Small Enterprises (20)
Recently uploaded
Recently uploaded (20)
Employment in Small Enterprises
- 1. ISSN: 2349-7807 International Journal of Recent Research in Commerce Economics and Management (IJRRCEM) Vol. 1, Issue 2, pp: (5-11), Month: July 2014 - September 2014, Available at: www.paperpublications.org Page | 5 Paper Publications EMPLOYMENT SITUATION OF SMALL ENTERPRISES IN PAPUM PARE DISTRICT OF ARUNACHAL PRADESH Ashok Sharma Ph.D Scholar in Department of Commerce, Rajiv Gandhi University, Rono Hills, Doimukh, Arunachal Pradesh, INDIA Abstract: Small enterprise is considered to play an important and dominating role in the regional-rural development process. It is a well known fact that food, shelter and employment are the most important basic necessities of the people of rural areas. Small enterprises, through providing largest share of employment especially to the poor and rural population, can help solve their basic problems. The purpose of the present study is to bring in light the small enterprises and its employment generating efficiency in Papum Pare district of Arunachal Pradesh. The paper has been designed in such a way that it shows the employment status of small enterprises in Papum Pare district. The size, category, education level, remuneration, etc. of the workers/employees are taken as key elements for the study. The study is based on both primary as well as secondary data, which has been analyzed with statistical tool for better understanding. Keywords: Employment, MSME, Rural Development, Small Enterprises, Wages, Workers. I. INTRODUCTION Micro, Small and medium enterprises are regarded as an engine of growth of Indian economy. Next to Agricultural Sector, MSME sector has been considered as the backbone and bedrock of Indian Economy. “It is recorded that MSME contributes nearly 8 percent of the country‟s GDP, 45 percent of the manufacturing output and 40 percent of the exports. They provide the largest share of employment after agriculture. They are the nurseries for entrepreneurship and innovation”1. MSME with its varied classification of enterprises is helping to bring inclusive industrial growth in the country. On the one hand with its micro enterprises category, a large number of rural poor people got the chance to be self employed. On the other hand, small and medium enterprises are catering both rural and urban population to participate the nation building. The North Eastern States of India are regarded as industrially backward regions. However these states in particular like Arunachal Pradesh has high potentiality for entrepreneurial growth. The state is innate with climatic conditions highly favorable for large scale productions and taking up of different kinds of entrepreneurial activities. The state is abundant with resources favorable for enterprises in areas like Tourism, Hydropower, Biodiversity, etc. However, it is also a fact that most of the resources of the state remain untapped and unutilized. This is a major hindrance face by the people of the state which is causing and creating the problems of unemployment, poverty etc. These hindrances are putting an obstacle in the path of economic development or growth process in the state. As industrialization process started in the state lately; the numbers of modern industries are found to be very less. In addition, the earlier governmental effort was concentrated only on promotion of traditional sectors like handloom, handicraft, weaving and village industries, etc. But after the establishment of District Industries Centre during the fifth five year plan, forest and mineral based industries has been set up. “It was during the period of year 1994 that the state‟s first industrial policy was introduced. With the implementation of the industrial policy 1994, and consequently industrial policy 2001 and 2008, the state had experienced the coming up of more number of micro and small enterprises in the 1 http://msme.gov.in/Web/Portal/New-Default.aspx
- 2. ISSN: 2349-7807 International Journal of Recent Research in Commerce Economics and Management (IJRRCEM) Vol. 1, Issue 2, pp: (5-11), Month: July 2014 - September 2014, Available at: www.paperpublications.org Page | 6 Paper Publications state”2. It is expected that when there is increase in the number of small enterprises there will be more employment, generation of income and improve standard of living of the people. The enactment of the industrial policies in the state of Arunachal Pradesh and along with it the setting up of a number of small enterprises in the state is an indication of more people participation, change in economic condition and social status of the people. It means that small enterprises are an important tool in economic development and upliftment of social status of people. In fact small enterprises is a significant way of bringing change in economic condition of any state or a nation that ultimately will result in the removal of regional disparity within the state and finally throughout the country. The present paper is therefore, a study on the contribution of small enterprises towards the employment generation in Arunachal Pradesh with a case study of Papumpare District. II. REVIEW OF LITERATURE According to Das (2012) in his paper “Entrepreneurship and micro finance: a reflection from north east India” had dealt with entrepreneurship through micro finance particularly by Self Help Groups (SHGs) in respect of women enterprises in India. The study found that promotion of micro, women and rural entrepreneurship in the state can motivate the educated unemployed youth to run their own enterprises. His study also found that the share of female employees in unregistered SSI sector is much higher than registered SSI sector in different states. Similarly, the enterprises managed by women in unregistered SSI sector are higher than registered SSI sector. According to Moyong (2012) in his paper “Employment and prospects of rural entrepreneurship in SSI sectors in Arunachal Pradesh: Evidences from third SSI census report” founds that most of the entrepreneurs are the first generation entrepreneurs in the state. His study also found that there are ample of areas for development of industries in rural Arunachal like tourism, food processing, pickle making, etc. which can provide huge employment opportunities in the state. According to Saikia & Das (2012) in their paper “Entrepreneurship and Micro & Small Enterprises growth in Assam” had examined the growth of Micro and Small Enterprises in Assam with different indicators such as employment, number of units, etc. The study was based on NSSO data on unorganised manufacturing sector of Assam for the period of 1994-95 to 2005-06. It was observed that significant growth took place during 2000-01 to 2005-06 in the Micro & Small Enterprises in Assam. It was also observed that, despite of having huge potentiality for creation of employment, micro and small enterprises in Assam was unable to generate enough employment for the people. III. OBJECTIVES OF THE STUDY The objectives of the present study are: 1. To examine the status of Small Enterprises in the Papum Pare district, 2. To study the contribution of Small Enterprises towards employment in the district. IV. METHODOLOGY The present study is empirical in nature and is based on both primary and secondary data. The primary data are collected through the structured schedule, personal discussion with entrepreneurs and some of the workers of small enterprises located in Papum Pare district. The secondary data are collected from the journals, statistical abstract, website of the MSME, website of Directorate of industries, Itanagar. From the secondary data collected, 154 registered units of Small enterprises were found to be functioning in Arunachal Pradesh up to 31st March 2013. The total number of small enterprises in Papum Pare district is 53 up to 2012-13. Out of total 53 numbers of small enterprises, 30 (56%) numbers of small enterprises are selected by using random sampling method for the present research. The present study is confined to the period 2012-13 only. V. DEFINITION OF SMALL ENTERPRISES 2 Directorate of Industries, Itanagar, Arunachal Pradesh
- 3. ISSN: 2349-7807 International Journal of Recent Research in Commerce Economics and Management (IJRRCEM) Vol. 1, Issue 2, pp: (5-11), Month: July 2014 - September 2014, Available at: www.paperpublications.org Page | 7 Paper Publications Small Enterprises comes under one of the major classifications of MSME as mentioned in the MSMED Act 2006. According to the Act, MSME‟s classification is based on the investment limit in Plant and Machinery in case of manufacturing sector and investment in equipment in case of Service sector. Small Enterprises Manufacturing Sector Investment in Plant and Machinery Above Rs 25 lakhs & upto Rs 5 crore Service Sector Investment in Equipment Above Rs 10 lakhs & upto Rs 2 Crore VI. FINDINGS & ANALYSIS According to district wise number of Entrepreneurs Memorandum (Part‐II) filed by the Micro, Small & Medium Enterprises in respect of Arunachal Pradesh, the state has 370 numbers of permanently registered MSME units up to 2012-13. Further, there are 154 numbers of small enterprises which has been registered in Entrepreneurship Memorandum-II, and accounts for 41.62 percent of the total registered MSME units in the state. Out of the state total number, the total number of small enterprises in Papum Pare district is found to be only 53 as on 31st March 2013. However, for the study questions were distributed to 30 registered small enterprises and the findings of the study are presented in tabular form. Table 1: District wise number of Small Enterprises in Arunachal Pradesh as on 31.03.2013. Sl. No. Name of the Districts Manufacturing Sector Service Sector Total Nos. % Nos. % Nos. % 1 Tawang 1 0.69 0 0.00 1 0.65 2 West Kameng 0 0.00 0 0.00 0 0.00 3 East Kameng 1 0.69 0 0.00 1 0.65 4 Papumpare 52 35.86 1 11.11 53 34.42 5 Lower Subansiri 6 4.14 2 22.22 8 5.19 6 Uppar Subansiri 7 4.83 0 0.00 7 4.55 7 West Siang 20 13.79 5 55.56 25 16.23 8 East Siang 5 3.45 1 11.11 6 3.90 9 Upper Siang 0 0.00 0 0.00 0 0.00 10 Dibang Valley 0 0.00 0 0.00 0 0.00 11 Lohit 28 19.31 0 0.00 28 18.18 12 Changlang 16 11.03 0 0.00 16 10.38 13 Tirap 4 2.76 0 0.00 4 2.60 14 Kurung Kumey 4 2.76 0 0.00 4 2.60 15 Lower Dibang Valley 1 0.69 0 0.00 1 0.65 16 Anjaw 0 0.00 0 0.00 0 0.00 17 Longding 0 0.00 0 0.00 0 0.00 Total 145 9 154 Sources: Directorate of Industries, Itanagar (compiled) Table 1 is a presentation of district wise distribution of small enterprise in Arunachal Pradesh up to year 2012 -13. From the table it can be seen that Papum Pare district is holding majority share i.e., 34.42 percent of small enterprises in the state. However, other districts like Lohit and West Siang is having quit good numbers of small enterprises i.e., 18.18 and 16.23 percent respectively in their credit. It is interesting to see, that there are around five districts which do not have any small enterprises till now. In Papum Pare district, from total 53 registered small enterprises only one unit is from service sector and rest are from manufacturing sector. From among 145 manufacturing units Papum Pare holds 35.86 percent of manufacturing units, but in case of service sector district holds only 11.11 percent of units. Small Enterprises provides immediate large scale employment. It helps to reduce the unemployment problem in the state. The distribution of enterprises and employment in the table 2 indicates that a huge number of employment is provided by
- 4. ISSN: 2349-7807 International Journal of Recent Research in Commerce Economics and Management (IJRRCEM) Vol. 1, Issue 2, pp: (5-11), Month: July 2014 - September 2014, Available at: www.paperpublications.org Page | 8 Paper Publications small industrial units in the Papumpare district. The total number of small enterprises (both manufacturing sector and service sector) for the present study is limited to 30. The total investment amount is Rs 1693.80 lakhs for manufacturing sector and 56.00 lakhs for service sector with 771 numbers of employments in those 30 sample units. Table 2: Total and average employment and investment in 30 sample units of Papum Pare District upto 31.03.13. Sl. No. Sectors No. of Units Employment (In nos.) Investment (Rs in lakhs) Total Average Total Average 1 Manufacturing 29 743 25.62 1693.80 58.41 2 Service 1 28 28.00 56.00 56.00 Total 30 771 25.70 1749.80 58.33 Sources: Field Survey Again, Table 2 also represents the average employment of small enterprises in manufacturing sector which is 25.62 and 28 in case of small enterprises in service sector. However, the present average employment for the total small enterprises is 25.7. The Table also reveals that Rs 58.41 lakhs of average investment is made by the manufacturing units whereas it is Rs 56 lakhs for service sector units of the sample units. However, the average investment of the total sample units is 58.33 in the district. The workers in any enterprises irrespective of male-female ratio play a dominant role in the growth of the business process. It is the employees/workers contribution that can lead towards achievement of certain physical target of the business. The following table 3 is the representation of the number of labours employed on the basis of their gender. Table 3: Classification of employed workers on the basis of gender. Sl. No. Category of Employment Numbers of Workers Percentage (%) 1 Male 690 89.49 2 Female 81 10.51 Total 771 100.00 Source: Field Survey From the total 771 workers, 89.49 percent are male workers and only 10.51 percent are female workers in the sample units of the district. The ratio between male and female workers in small enterprises is around 8.5:1. It is found out that the male workers are dominating in all kinds of enterprises operating in the district except for the weaving and knitting units. It is also found out in the survey that workers are classified under different categories. Further the categorisation is according to the workers efficiency in work, which is reflected elaborately in table 4. Table 4: Size of employment in the sample enterprises. Sl. No. Size of Employment No. of Workers Percentage (%) 1 Skilled 271 35.15 2 Semi Skilled 162 21.01 3 Unskilled 338 43.84 Total 771 100.00 Source: Field Survey From the total 771 workers, 31.15 percent are skilled workers, 21.01 percent are semi-skilled workers and 43.84 percent are unskilled workers in small enterprises of the district. The ratio between skilled, semiskilled and unskilled workers in small enterprises is around 2:1:3. Further it is found that all the workers are from different background and have different age group. So next classification for the workers is on the basis of age, and is presented in table 5and graph 1. Table 5: Age classification of the workers in the sample units. Sl. No. Age Groups (in years) No. of Workers Percentage (%) 1 Below 20 26 3.37
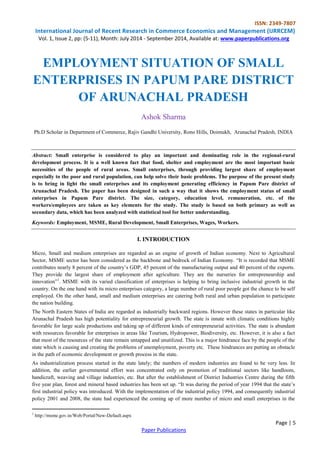
- 5. ISSN: 2349-7807 International Journal of Recent Research in Commerce Economics and Management (IJRRCEM) Vol. 1, Issue 2, pp: (5-11), Month: July 2014 - September 2014, Available at: www.paperpublications.org Page | 9 Paper Publications 2 20 - 30 148 19.20 3 30 - 40 451 58.50 4 40 - 50 109 14.13 5 50 & above 37 4.80 Total 771 100.00 Source: Field Survey Graph 1: Age group of the workers From the above table it can be seen that 58.50 percent of enterprise workers are from 30-40 years of age group and which is the highest among the other age groups of workers in the district. Whereas only 3.37 percent of workers are in the below 20 years of age groups, which shows the percentage of minor workers are less in sample units. Very less number of workers has attended some formal education which is shown in the table 6. Table 6: Educational qualification of the workers in sample units. Sl. No. Education level No. of Workers Percentage (%) 1 Illiterate 243 31.52 2 Upto Primary 419 54.35 3 Upto Secondary 68 8.82 4 Upto Higher Secondary 39 5.06 5 Upto Graduation 2 0.25 Total 771 100.00 Source: Field Survey The above classification shows that 54.35 percent of workers are having primary level of education. The percentage of illiterate workers is 31.52 percent in sample enterprises. It is interesting to see that some of the graduate employees are also found in some of the small enterprises. About 60.05 percent of the total employees belong to the group of employment „over 10-50 persons‟ which is shown in table 7. Out of 30 enterprises 22 units belongs to this group (over 10-50 Persons) and average employment in these units are around 21 persons per small enterprise. Table 7: Classification of enterprises according to size of employment. Sl. No. Size of Employment No. of Enterprises Total Employment Percentage (%) 1 Upto 10 persons 6 47 6.10 2 10-50 persons 22 463 60.05 3 50-100 persons 1 56 7.26 4 Over 100 persons 1 205 26.59 3% 19% 59% 14% 5% No. of Workers Below 20 20 - 30 30 - 40 40 - 50 50 & above
- 6. ISSN: 2349-7807 International Journal of Recent Research in Commerce Economics and Management (IJRRCEM) Vol. 1, Issue 2, pp: (5-11), Month: July 2014 - September 2014, Available at: www.paperpublications.org Page | 10 Paper Publications Total 30 771 100.00 Source: Field Survey On the other hand, there are 6 units having average employment of around 8 persons. Similarly there is only one per unit with employment range of „50-100 persons‟ and „over 100 persons‟ respectively. Lastly, the largest number of small enterprises is having employment in the range of 10-50 persons category. Different enterprises have different rates of payment to the workers. Some pay more for labour intensive work whereas some pay more for technical work. Minimum government standards have been considered by the units while making payment to the workers. The table 8 and graph 2 shows the different rate of payments made to the industrial workers by the employer in the district. Table 8: Payment of wages to different categories of workers. Sl. No. Wage Range (Per Day) No. of Workers Skilled Semi-skilled Unskilled Total 1 Below Rs 100 2 70 89 161(20.88)* 2 Rs 100- Rs 150 41 42 220 303(39.30) 3 Rs 150- Rs 200 82 18 26 126(16.34) 4 Above Rs 200 146 32 3 181(23.48) Total 271 162 338 771(100) Source: Field Survey * Figures in brackets are percentages Graph 2: Wages per day for the industrial workers The 39.30 percent of total workers get wages in between Rs 100 to Rs 150 per day according to the sample units in the district, whereas, 20.88 percent of workers get wages less than Rs 100 per day. The unskilled labours are less paid by the employer in the units studied. 65.09 percent of unskilled workers are getting Rs 100-150 per day, whereas only 0.89 percent of those workers are getting more than Rs 200 per day. Similarly, 53.88 percent of skilled workers are receiving wages more that Rs 200 per day, whereas only 0.74 percent of those workers are getting less than Rs 100 per day in the sample units. 0 50 100 150 200 250 Below Rs 100 Rs 100- Rs 150 Rs 150- Rs 200 Above Rs 200 No. of Workers Wages Per Day Wage Range Skilled Semi-skilled Unskilled
- 7. ISSN: 2349-7807 International Journal of Recent Research in Commerce Economics and Management (IJRRCEM) Vol. 1, Issue 2, pp: (5-11), Month: July 2014 - September 2014, Available at: www.paperpublications.org Page | 11 Paper Publications VII. CONCLUSION The discussion made so far show the contribution of small enterprises in generating employment in the Papum Pare district. The survey data shows that the region accounts for the 34.42 percent of the total number of small enterprises in the state. The number of small enterprises in the district is 53; of which 7.55 % of small enterprises are temporarily not functioning. It is noteworthy that after formation of Ministry of MSME in the state, good number of small enterprises has been established in the district. Most of the sample units are established in the urban or semi-urban areas in the district, but very less number of units is working under the shed of Industrial Estates. Among the sample units, the demand based enterprises are more with almost 64.71 percent in the district which generates large number of employment. The average employment per sample units is around 26 persons. And around 40 percent of industrial workers in the district are getting wages of Rs 100-150 per day. Very few of the small enterprises have the capability of creating vast employment opportunities in the district. However, it can‟t also be denied that a good number of employments are provided by some of the units. If all the resources of the district are utilised properly, then there is enough possibilities for creation of employment through small enterprises in the district. Hence, the study therefore concludes that the use of available natural resources with the help of micro and small enterprises can accelerate the developmental process in the district. REFERENCES [1]. D. Saikia and K.K. Das (2012), “Entrepreneurship and Micro and Small Enterprises Growth in Assam,” Retrieved from http://mpra.ub.uni-muenchen.de/41860/1/MPRA_paper_41860.pdf [2]. Directorate of Industries, Govt. of Arunachal Pradesh, Itanagar, 2012. [3]. http://indarun.gov.in/ [4]. http://msme.gov.in/Web/Portal/New-Default.aspx [5]. S. Deb, “Rural Entrepreneurship, A perspective with special reference to Arunachal Pradesh: An Empirical Study,” Journal of Global Economy, Vol. 8, no. 2, April-June 2012. [6]. S. Hazarika, “A Study on Cottage and Micro Enterprises in Socio-Economic Development of Kaliabor of Nagaon District, Assam,” The International Journal of Business & Management, Vol. 1, no. 4, 2013. [7]. S.K. Das, “Entrepreneurship and Micro Finance: A Reflection from North East India,” Asian Journal of Research in Social Science & Humanities, Vol. 2, no. 5, May 2012. [8]. Statistical Abstract of Arunachal Pradesh-2012, Directorate of Economics & Statistics, Govt. of Arunachal Pradesh. [9]. O. Moyong, “Employment and Prospect of Rural Entrepreneurship in SSI Sector in Arunachal Pradesh: Evidences from Third SSI Census Report,” Asian Journal of Multidimensional Research, Vol. 1, no. 6, Nov. 2012.