Scaling API-first – The story of a global engineering organization
Module 10 Graphs Of Functions
1. PPR Maths nbk
MODUL 10
SKIM TIUSYEN FELDA (STF) MATEMATIK SPM “ENRICHMENT”
TOPIC : GRAPHS OF FUNCTIONS
TIME : 2 HOURS
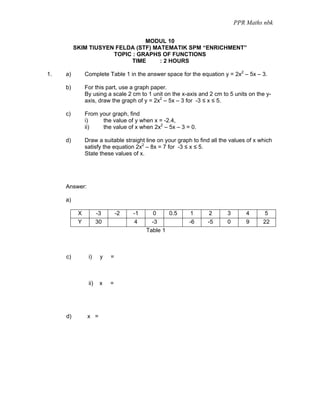
1. a) Complete Table 1 in the answer space for the equation y = 2x2 – 5x – 3.
b) For this part, use a graph paper.
By using a scale 2 cm to 1 unit on the x-axis and 2 cm to 5 units on the y-
axis, draw the graph of y = 2x2 – 5x – 3 for -3 ≤ x ≤ 5.
c) From your graph, find
i) the value of y when x = -2.4,
ii) the value of x when 2x2 – 5x – 3 = 0.
d) Draw a suitable straight line on your graph to find all the values of x which
satisfy the equation 2x2 – 8x = 7 for -3 ≤ x ≤ 5.
State these values of x.
Answer:
a)
X -3 -2 -1 0 0.5 1 2 3 4 5
Y 30 4 -3 -6 -5 0 9 22
Table 1
c) i) y =
ii) x =
d) x =
2. PPR Maths nbk
2. a) Complete Table 2 in the answer space for the equation y = x2 – 5x + 4.
b) For this part, use a graph paper.
By using a scale 2 cm to 1 unit on the x-axis and 2 cm to 5 units on the y-
axis, draw the graph of y = x2 – 5x + 4 for 0 ≤ x ≤ 8.
c) From your graph, find
a. the value of y when x = 4.5,
b. the value of x when y = 21.75
d) Draw a suitable straight line on your graph to find all the values of x which
satisfy the equation x2 – 7x + 3 = 0 for 0 ≤ x ≤ 8.
State these values of x.
Answer:
a)
X 0 1 2 2.5 3 4 5 6 7 8
Y 4 0 -2 -2 4 10 18 28
Table 2
c) i) y =
ii) x =
d) x =
3. PPR Maths nbk
5
3. a) Complete Table 3 in the answer space for the equation y = .
x
b) For this part, use a graph paper.
By using a scale 2 cm to 1 unit on the x-axis and 2 cm to 2 units on the
5
y-axis, draw the graph of y = for -5 ≤ x ≤ 5.
x
c) From your graph, find
a. the value of y when x = 1.8,
b. the value of x when y = -6.
d) From your graph, find all the values of x with the condition that the value
of y is three times the value of x.
Answer:
a)
X -5 -3 -2 -1 -0.5 0.5 0.9 1.5 2.5 5
Y -1 -1.7 -2.5 -10 10 5.6 3.3 1
Table 3
c) i) y =
ii) x =
d) x =
4. PPR Maths nbk
2
4. a) Complete Table 4 in the answer space for the equation y =
x
b) For this part, use a graph paper.
By using a scale 2 cm to 1 unit on the x-axis and 2 cm to 1 units on the y-
2
axis, draw the graph of y = for -4 ≤ x ≤ 4.
x
c) From your graph, find
a. the value of y when x = -1.5,
b. the value of x when y = 1.2.
d) Draw a suitable straight line on your graph to find all the values of x which
2 3
satisfy the equation = x - 2 for -4 ≤ x ≤ 4.
x 4
State these values of x.
Answer:
a)
X -4 -2.5 -2 -1 -0.5 0.5 1 2 2.5 4
Y -0.5 -0.8 -2 -4 4 2 1 0.5
Table 4
c) i) y =
ii) x =
d) x =
5. PPR Maths nbk
5. a) Complete Table 5 in the answer space for the equation
y = x3 – 13x + 18 .
b) For this part, use a graph paper.
By using a scale 2 cm to 1 unit on the x-axis and 2 cm to 5 units on the y-
axis, draw the graph of y = x3 – 13x + 18 for -4 ≤ x ≤ 4.
c) From your graph, find
a. the value of y when x = -1.5,
b. the value of x when y = 25.
d) Draw a suitable straight line on your graph to find all the values of x which
satisfy the equation x3 – 11x – 2 = 0 for -4 ≤ x ≤ 4.
State these values of x.
Answer:
a)
X -4 -3 -2 -1 0 1 2 3 4
Y 6 36 30 18 6 6 30
Table 5
c) i) y =
ii) x =
d) x =
6. PPR Maths nbk
6. a) Complete Table 6 in the answer space for the equation
y = x3 + x2 – 12x – 5.
b) For this part, use a graph paper.
By using a scale 2 cm to 1 unit on the x-axis and 2 cm to 5 units on the y-
axis, draw the graph of y = x3 + x2 – 12x – 5 for -4 ≤ x ≤ 4.
c) From your graph, find
a. the value of y when x = 0.5,
b. the value of x when 11.9.
d) Draw a suitable straight line on your graph to find all the values of x which
satisfy the equation x3 + x2 – 10x = 0 for -4 ≤ x ≤ 4.
State these values of x.
Answer:
a)
X -4 -3 -2 -1 0 1 2 3 4
Y -5 13 7 -5 -15 -17 27
Table 6
c) i) y =
ii) x =
d) x =
7. PPR Maths nbk
MODULE 10 – ANSWERS
TOPIC: GRAPHS OF FUNCTIONS
1. a) x=-2 y=15 x=0.5 y= -5 x=3 y=0
b) graph
40
35
30
25
y(x) = 2⋅x2-5⋅x-3
20.5
20
15
y(x) = 3⋅x+4
10
5
-10 -5 5 10
-2.4 -0.75 4.75
-5
-10
c) i) x=-2.4 y= 20.5
ii) when 2x2 – 5x – 3 = 0
y=0
Then the values of x is -0.5 and 3
e) y=2x2-5x-3
0=2x2-8x-7 (-)
-----------------------
Y= 3x + 4
X 0 3
Y 4 13
From the graph x= -0.75 and 4.75
8. PPR Maths nbk
2. a)x=2.5 y=-2.25 x=4 y=0
b)graph 2
c) i) y=1.75
ii) x=7.4
e) straight line y=2x+1
x=0.45 and 6.55
3. a) x=-1 y=-5 x=2.5 y=2
b)graph
16
C
14
12
10
y(x) = 3⋅x
8
6
4
2
A
-5 -4 -3 -2 -1 1 2 3 4 5
B
-2
5
y(x) =
x -4
-6
-8
-10
-12
-14
c) i) x=1.8 y= 2.8
ii) y=-6 x=-0.8
e) The graph is y=3x
X 0 2
Y 0 6
The values of x= -1.3 and 1.3
9. PPR Maths nbk
4. a) x=-2 y=-1 x=2.5 y=0.8
b) graph
c) i) y=-1.3
ii) x=1.7
3
e) The straight line is y= x–2
4
The values of x = -0.75 and 3.45
5. a) x=-3 y=30 x=2 y=0
b) graph 45
40
35 34
30
y=x^3-1 3x+18
25
20
y=-2x+20
15
10
5
3.85
-3.2
-0.25
-6 -4 -2 2 3.35 4 6
c) i) x=-1.5 y=34 -5
ii) y=25 x=3.85
e) y=x3-13x+18
0=x3-11x-2 (-)
--------------------------
Y= -2x+20
X 0 4
Y 20 12
10. PPR Maths nbk
X= -3.2, -0.25 and 3.35
6. a) x=-2 y=15 x=3 y=-5
b) graph 6
c) i) y=10.75
ii) x=-1.5
e) y=-12x-5
x=-3.6, 0 and 2.75