The study on optimization measures of congestion on main roads in ChongQing

This document discusses measures to optimize traffic congestion on main roads in Chongqing, China that have many two-phase intersections. The researchers built a simulation model based on traffic data from a congested road section. Simulations showed that adding a left-turn lane indirectly led to more congestion when traffic was high. Two solutions were proposed: 1) implementing "closed left turns" at intersections to reduce conflicts, and 2) using "U-turns" to reduce crossing conflicts while coordinating signal timing between intersections. These solutions were evaluated using a DEA/AHP model considering passing rate, average stops, and number of conflicts. The model found that solution 1 was best for optimizing traffic flow while ensuring safety.

Recommended
Recommended
More Related Content
What's hot
What's hot (16)
Viewers also liked
Viewers also liked (20)
Similar to The study on optimization measures of congestion on main roads in ChongQing
Similar to The study on optimization measures of congestion on main roads in ChongQing (20)
Recently uploaded
Recently uploaded (20)
The study on optimization measures of congestion on main roads in ChongQing
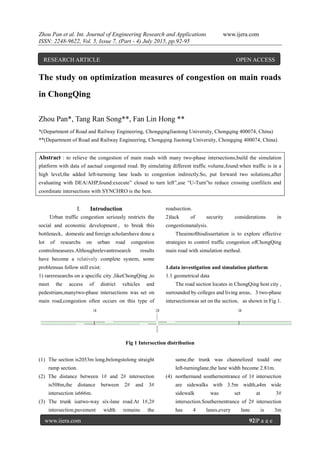
- 1. Zhou Pan et al. Int. Journal of Engineering Research and Applications www.ijera.com ISSN: 2248-9622, Vol. 5, Issue 7, (Part - 4) July 2015, pp.92-95 www.ijera.com 92|P a g e The study on optimization measures of congestion on main roads in ChongQing Zhou Pan*, Tang Ran Song**, Fan Lin Hong ** *(Department of Road and Railway Engineering, ChongqingJiaotong University, Chongqing 400074, China) **(Department of Road and Railway Engineering, Chongqing Jiaotong University, Chongqing 400074, China) Abstract:to relieve the congestion of main roads with many two-phase intersections,build the simulation platform with data of aactual congested road. By simulating different traffic volume,found:when traffic is in a high level,the added left-turnning lane leads to congestion indirectly.So, put forward two solutions,after evaluating with DEA/AHP,found:execute” closed to turn left”,use “U-Turn”to reduce crossing confilicts and coordinate intersections with SYNCHRO is the best. I. Introduction Urban traffic congestion seriously restricts the social and economic development , to break this bottleneck,domestic and foreign scholarshave done a lot of researchs on urban road congestion controlmeasures.Althoughrelevantresearch results have become a relatively complete system, some problemsas follow still exist: 1) rareresearchs on a specific city ,likeChongQing ,to meet the access of district vehicles and pedestrians,manytwo-phase intersections was set on main road,congestion often occurs on this type of roadsection. 2)lack of security considerations in congestionanalysis. Theaimofthisdissertation is to explore effective strategies to control traffic congestion ofChongQing main road with simulation method. 1.data investigation and simulation platform 1.1 geometrical data The road section locates in ChongQing host city , surrounded by colleges and living areas,3 two-phase intersectionwas set on the section,as shown in Fig 1. 3#2#1# Fig 1 Intersection distribution (1) The section is2053m long,belongstolong straight ramp section. (2) The distance between 1# and 2# intersection is508m,the distance between 2# and 3# intersection is666m. (3) The trunk isatwo-way six-lane road.At 1#,2# intersection,pavement width remains the same,the trunk was channelized toadd one left-turninglane,the lane width become 2.81m. (4) northernand southernentrance of 1# intersection are sidewalks with 3.5m width,a4m wide sidewalk was set at 3# intersection.Southernentrance of 2# intersection has 4 lanes,every lane is 3m RESEARCH ARTICLE OPEN ACCESS
- 2. Zhou Pan et al. Int. Journal of Engineering Research and Applications www.ijera.com ISSN: 2248-9622, Vol. 5, Issue 7, (Part - 4) July 2015, pp.92-95 www.ijera.com 93|P a g e wide,thenorthernentrance only has one lane with 4m width. 1.2.Signal Timing ALL intersections on this road use two-phasefixed signal timing,define 1# intersection as the master intersection,the offset of 2# intersection is 51s,the offset of 3# intersection is 28s,more details as shown in Fig 2. N 20692036632076233733256228359 1#intersection 1#intersection 1#intersection green red yellow Fig 2 Signal Timing 1.3 Traffic data Congestion usually appearsat the evening peak,during 17: 30-18: 30.Collect traffic data with video cameras,statistical results are shown in Table 1. Table1 Traffic datapcu/h Intersectio n Directio n Straigh t Lef t Righ t U-tur n 1# East 1909 - - 24 West 1245 - - 156 South 321 - - - North 133 - - - 2# East 1937 - 18 82 West 1042 115 28 82 South 96 130 20 - North - - - - 3# East 2227 - - - West 1101 - - - South 242 - - - North 89 - - - 1.4 Simulation platform Use VISSIM to buidthe platform,input collected data,thenadjust relevant parameters until it is consistent with the reality. II. Congestion Causes The congestionoccurred in eastern main road,analysis showed: 1)queues existed in eastern entrances of 1# ,2# intersection,the increasing traffic volume intensifiesqueues,becausestraight vehicles on the left-turn lane waited for anappropriatetime headway to change lanes and surrounding vehicleshad to stop when they changed lanes.so, congestionappeared. 2)At 2# intersection ,left-turning vehicles of western entrance and southern entrance caused lots of crossing conflicts, aggravated the congestion. 3)Didn’t implement traffic signal coordination, the road capacity was reduced. III. Study onoptimization measures 3.1optimization measures According to congestioncauses,at the evening peak,the added left-turnning lane led to congestion indirectly ,there are 2 ways to improve the situation,①execute” closed to turn left” at 1#,2#intersection in the eastern mainroad.②chang the left-turn lane into a left-turn,straightlane,butthe original 2 phases need to be adjusted and pedestrainsare forbidden,as shown in Fig 3. 3.
- 3. Zhou Pan et al. Int. Journal of Engineering Research and Applications www.ijera.com ISSN: 2248-9622, Vol. 5, Issue 7, (Part - 4) July 2015, pp.92-95 www.ijera.com 94|P a g e intersectionintersectionintersection N Fig 3 Phases of intersections Then use “U-Turn”to clear the vehicles at southern entrance of 2# intersection,so as to reduce the number of crossing confilicts.Finally, coordinate the signal timing of all intersections with SYNCHRO. Choose the passing rate , average stops and the number of confilicts as indexs, the number of confilicts can be got with SSAM(Surrogate safety analysis model)[1] ,simulation data as shown in Table 2. Table2 project data pl an Passin g rate average stops confilcts cross ing re ar Lane changge tot al ① 0.95 1.11 38 6 6 7 159 86 4 ② 0.93 1.56 22 6 8 9 135 84 6 3.2 Evaluation Method From Table 2 ,can see plane ①doesn’thave the absolute advantages over plan ②,here use DEA/AHP model to compare plans.First ,use DEA to build the Judgment matrix,determine relative effectiveness of every index,then order the plans with AHP[2]. Steps as follows: 1)build the Judgment matrix If there are ndecision making units,everyunit has a input-indexsand b output-indexs,assumeXij is the ithinput-index(negative Index) and Ykj is the ith output-index(positive index)of the jthunit,j=1,2…n ,i=1,2…a,,k=1,2…b.Choose two different units randomly: L and M,determinerelative effectiveness with DEA.: ELL = Max ukYkL b k=1 = hL St. viXiL = 1 a i=1 ukYkL ≤ 1 b i=1 ukYkL b i=1 − viXiL a i=1 ≤ 0 uk ≥ 0,vi ≥ 0 EML = Max ukYkM b k=1 St. viXiM = 1 a i=1 uiYkM ≤ 1 b i=1 ukYkL b i=1 − ELL viXiL a i=1 ≤ 0 uk ≥ ε, vi ≥ ε Apparently ,in the two units DEA
- 4. Zhou Pan et al. Int. Journal of Engineering Research and Applications www.ijera.com ISSN: 2248-9622, Vol. 5, Issue 7, (Part - 4) July 2015, pp.92-95 www.ijera.com 95|P a g e model ,ELL=ELM,EMM=EML. Build the Judgment matrix ,according to calculation results.Forany pair of decision making units,L and M: aLM = ELL + ELM EMM + EML 2)orderthe plans with AHPSolvethe maximal eigenvalueλmax and its Feature vectorω ω= ω1, ω2, ω3, … , ωn T ωj represents the relative impotance of the jthdecision making unit.So,the order is determined. 3.2project evaluation Use passing rate as the positive index ,average stops and the number of conflits as negative indexs, the Judgment matrix as shown in Table 3. Table 3 Judgmentmatrix ① ② ① 1 1.00030009 ② 0.99970009 1 λmax =2 ω= 0.7072,0.7070 T consistency test: CI=CR=0<0.1 According to the feature vector, plan①is better than plan② IV. Conclusions 1)In ChongQing ,on the section with many two-phase intersections ,when traffic is in a high level,the added left-turnning lane ,local conflicts and unreasonable signal timing lead to the congestion together. 2)The number of conflicts was first used in DEA/AHP model ,so that the model can guarantee safety and capacity at the same time. With the model ,found the best optimization measure:execute” closed to turn left”,use “U-Turn”to reduce crossing confilicts and coordinate intersections with SYNCHRO. References [1] Douglass Gettman, Lili Pu, Tarek Sayed, etc. Surrogate Safety Assessment Models and Validation [M]. Siemens Energy & Automation, Inc. Business unit Intelligent Transportation Systems,2008.1: 14-21 [2] Zhan Lin Xia. The Study on Factors of Establishment at the Exit and Entrance of Urban Ex Pressway [D]. Beijing Jiaotong University, 2008.