SlideShare a Scribd company logo
1 of 7
Download to read offline
Dr. Fareed M.A.Karim Int. Journal of Engineering Research and Applications www.ijera.com
ISSN : 2248-9622, Vol. 4, Issue 3( Version 3), March 2014, pp.35-41
www.ijera.com 35 | P a g e
Improving the Performance of Urban Road Intersection.
Dr. Fareed M.A.Karim
Faculty of Engineering, University of Aden, Yemen.
Abstract
Road intersection is responsible for an important proportion of air pollution especially in urban areas, due to
long queues of vehicles waiting for discharge. Therefore, it is necessary to quantify their emissions as accurately
as possible.
In this study an attempt was made to research on reducing the traffic air pollution such as CO, CO2, HC and
NOx, fuel consumption and vehicle operating cost along with improving the traffic flow and delay at a road
intersection.
One major uncontrolled (un signalized) intersection in capital city Sana'a (Yemen) was chosen for the study.
The traffic air pollution, fuel consumption and vehicle operating cost as well as vehicle delay was calculated for
the base year 2012 using aaSIDRA 2.0 software developed in Australia.
For the horizon year 2022, three scenarios were considered for investigation viz. (1) do nothing, (2) signalizing
the intersection and (3) construction of flyover.
The analysis shows that for the above mentioned parameters scenario (3) will be the best scenario followed by
scenario (2), while worst case scenario will be do nothing.
Keywords: Improving Urban road Intersection, intersection pollution, improving vehicle operating cost at
intersection, Improving Fuel Consumption.
I. Introduction
Automobile air pollution, once largely a
problem of developed countries, is now an alarming
environmental problem in developing countries.
Rapid urbanization, motorization and economic
growth are contributors to an increasing air pollution
problem in most cities in developing urban centers. In
the United States, according to EPA (Environmental
Protection Agency)(6)
, in 1999, the road mobile
sources contributed 29% of Hydrocarbon (HC), 51%
of Carbon mono oxide (CO), 34% of Nitrogen oxides
(NOx) and 10% of particulate matter PM(2.5).
Due to high pollution rate caused by vehicle
traffic a decision is made to estimate the road
vehicles pollution at an intersection in Sana'a city and
to investigate various scenarios and choose one
which will have least pollution rate.
Sana'a city is the capital of Yemen with
estimated population in the city of 1,896,000 in year
2007. The number of registered vehicles in Sana'a
city was 149,526 vehicles in the same year 2007(5)
.
Figure (1) shows the study area which is the
intersection of two major streets in Sana'a Al-Nasser
Street and Marab Street. It is one of the major
uncontrolled (un signalized) intersection, having four
lanes in each approach. The hourly turning traffic at
the intersection for the base year 2012 as well as
horizon year 2022 is shown in Table (1).
Figure (1): The Study area.
RESEARCH ARTICLE OPEN ACCESS
Dr. Fareed M.A.Karim Int. Journal of Engineering Research and Applications www.ijera.com
ISSN : 2248-9622, Vol. 4, Issue 3( Version 3), March 2014, pp.35-41
www.ijera.com 36 | P a g e
Table (1): Peak hour Turning Traffic at the Intersection for the year 2012 and 2022.
Year
Daily Peak Hour Turning Traffic
Total
North South East West
E S W W N E S W N N E S
2012 90 760 127 540 566 23 25 30 26 172 65 619 3237
2022 152 1285 216 913 957 40 55 66 57 290 143 1362 5890
Figure (2) shows the peak hour turning traffic for the year 2012.
Figure (2): Peak hour turning Traffic for the year 2012.
II. MATERIAL AND METHOD
Road intersection is responsible for an
important proportion of air pollution especially in
urban areas, due to long queues of vehicles waiting
for discharge. It is, therefore, necessary to quantify
their emissions as accurately as possible.
To estimate pollutant quantities it is
necessary to have reliable emission factors and
reliable activity data.
In Yemen there is no data available as to
vehicle emission factors and traffic pollution. There
is no systematic monitoring of road side pollutants
concentration. In order to have a general overview of
the traffic pollution at present and in the near future,
the author made a case study of a major un signalized
intersection in Sana'a city. Vehicular emission and
fuel consumption as well as delays and vehicle
operating cost were calculated for this un signalized
intersection for the year 2012.
To estimate the fuel consumption and
vehicular emission such as CO2, HC, CO and NOx,
the author used aaSIDRA 2.0 software (1)
.
aaSIDRA employs four-mode model that provides a
highly reliable general method of estimating fuel
consumption and pollutant emissions(2),(3),(4)
. This
method differs from the more commonly used but
less accurate three-mode elemental model (cruise,
idling and number of stops using excess fuel
consumption, excess emission, or excess cost per
stop) used by other softwares.
For each lane of traffic, aaSIDRA derives
drive cycles consisting of a series of cruise,
acceleration, deceleration and idling (stopped) time
elements for specific traffic conditions (geometry,
control and demand flows). Fuel consumption and
pollutant emissions are then calculated for each of the
four driving modes, and the results added together for
the entire driving maneuver.
Fuel consumption and emissions are
calculated for light and heavy vehicles in each lane
separately, and then the total and average values are
calculated for all traffic using the lane. Different
vehicle parameters (vehicle mass, acceleration and
deceleration rates) apply to light and heavy vehicles.
To estimate the vehicle operating cost,
aaSIDRA 2.0 software require appropriate data to be
entered to the program in order to calculate the
vehicle operating cost. The following data entered in
the program which reflects the present values used in
Yemen:
Pump price of fuel $/Liter = 0.6 $/Liter
Fuel resource cost factor = 0.7
Ratio of Running cost/ Fuel cost = 3
Time Value factor = 0.4
Average occupancy (person /vehicle) =3.4
Average Income = 1$/ hour
Dr. Fareed M.A.Karim Int. Journal of Engineering Research and Applications www.ijera.com
ISSN : 2248-9622, Vol. 4, Issue 3( Version 3), March 2014, pp.35-41
www.ijera.com 37 | P a g e
Saving in the value of time (travel time) is
essential based on the average income of various
individuals among vehicular passengers, the average
vehicle occupancy, and the trip purpose.
The average hourly rates for three groups
were considered: professionals, skilled labor, and
others. The proportion of each of the three groups
among vehicular passengers in the study area was
estimated at 15%, 25% and 60% respectively.
Hourly Rate ($/hr)
Professional 2.00
Skilled labor 1.20
Others 0.60
Weighing the hourly rates by the proportion
of each group among the vehicle passengers results in
the following weighted average.
2.0 x 0.15 = 0.30
1.2 x 0.25 = 0.30
0.6 x 0.60 = 0.36
Average income 0.96 $/hr ≈ 1$/hr.
The average saving in travel time is applied
to the average vehicle occupancy, to account for all
the passenger savings resulting from one hour of
reduction in vehicle-hours. Daily savings are
multiplied by 332 (instead of 365) to account for
annual savings. This ensures that time savings are not
overestimated, by avoiding including any time
savings for 33 days per year, accounting for days
during which traffic levels are low and thus no actual
savings are realized, with and without the proposed
improvements.
In order to minimize the future air pollution,
fuel consumption, delay and vehicle operating cost,
three scenarios were considered which are:
1) Do nothing scenario 2) Signalization
3) Construction of flyover.
aaSIDRA 2.0 software were run for the
above three scenarios with the horizon year traffic
(2022).
Figure (3) below shows the intersection with
flyover in the north-south direction.
Figure (3): Intersection with proposed fly over in North-South direction.
III. Results and Conclusions
The necessary input data of vehicular traffic
such as number of vehicles entering the intersection,
their composition, speed etc. were fed into the
software as well as the geometric layout of the
intersection such as turning radius, number entering
lanes in each approach, width of lanes etc. The output
of the software was fuel consumption at the
intersection, emission rates of different pollutants,
delays of vehicles and vehicle operating cost at the
intersection.
Figure (4) shows the yearly vehicle
operating cost in million $ at the intersection for base
year 2012 and for the three future scenarios 2022.
Dr. Fareed M.A.Karim Int. Journal of Engineering Research and Applications www.ijera.com
ISSN : 2248-9622, Vol. 4, Issue 3( Version 3), March 2014, pp.35-41
www.ijera.com 38 | P a g e
It Is Clear From The Figure That If Do
Nothing Scenario Will Be Consider For This
Intersection, The Future (2022) Vehicle Operating
Cost Will Be Increased By 390% Than The Base
Year, While If Scenario (2) Will Be Consider Then
The Vehicle Operating Cost Will Be Increased Only
By 14% With Respect To Base Year, The Best
Solution Will Be Scenario (3) Where The Vehicle
Operating Cost Will Be Decreased By 46%
Compared To Base Year.
Figure (5) Shows The Yearly Fuel
Consumption In Million Liters At The Intersection
For Base Year 2012 And For The Three Future
Scenarios 2022.
It Obvious From Figure That If Do Nothing
Scenario Will Be Consider For This Intersection, The
Future (2022) Vehicle Fuel Consumption Will Be
Increased By 355% Than The Base Year, While If
Scenario (2) Will Be Consider Then The Vehicle
Fuel Consumption Will Be Increased By 41% With
Respect To Base Year, The Best Solution Will Be
Scenario (3) Where The Vehicle Fuel Consumption
Will Be Decreased By 32% Compared To Base Year.
Figure (6) shows the yearly delay in million
vehicle-hours per year at the intersection for base
year 2012 and for the three future scenarios 2022.
The figure reveal that if do nothing scenario
will be consider for this intersection, the future
(2022) vehicle delays will be increased by 488% than
the base year, while if scenario (2) will be consider
2.737
13.45
3.124
1.46
0
2
4
6
8
10
12
14
16
Base Year2012 Do Nothing2022 Signalizing2022 Fly over2022
VehicleOperatingCostMillion$
Fig (4): Vehice Operating Cost in Million $
1.384
6.3
1.951
0.94
0
1
2
3
4
5
6
7
Base Year2012 Do Nothing2022 Signalizing2022 Fly over2022
FuelConsumptioninMillionLitres
Fig. (5): Fuel Consumption in Million Litres
Dr. Fareed M.A.Karim Int. Journal of Engineering Research and Applications www.ijera.com
ISSN : 2248-9622, Vol. 4, Issue 3( Version 3), March 2014, pp.35-41
www.ijera.com 39 | P a g e
then the vehicle delays will be decreased by 60%
with respect to base year, the best solution will be
scenario (3) where the vehicle delays will be
decreased by 87% compared to base year.
Figure (7) shows the yearly CO2 emission in
tons at the intersection for base year 2012 and for the
three future scenarios 2022. It is clear from the figure
that if do nothing scenario will be consider for this
intersection, the future (2022) CO2 emission in tons
will be increased by 350% than the base year, while
if scenario (2) will be consider then the CO2 emission
will be increased only by 41% with respect to base
year, the best solution will be scenario (3) where the
CO2 emission will be decreased by 32% compared to
the base year.
Figure (8) shows the yearly CO emission in
tons at the intersection for base year 2012 and for the
three future scenarios 2022. It is obvious from figure
if do nothing scenario will be consider for this
intersection, the future (2022) CO emission in tons
will be increased by 190% than the base year, while
if scenario (2) will be consider then the CO emission
will be increased by 155% with respect to base year,
the best solution will be scenario (3) where the CO
emission will be increased only by 33% compared to
base year.
0.66649
3.93324
0.267289
0.088877
0
0.5
1
1.5
2
2.5
3
3.5
4
4.5
Base Year2012 Do Nothing2022 Signalizing2022 Fly over2022
DelayinmillionVehicle-hourperyear
Fig. (6): Delay in Million Vehicle-hour/Year
3463.5
15757
4884.43
2355.7
0
2000
4000
6000
8000
10000
12000
14000
16000
18000
Base Year2012 Do Nothing2022 Signalizing2022 Fly over2022
CO2EmissioninTonsperYear
Fig.(7 ): CO2 Emission for Different Scenarios
Dr. Fareed M.A.Karim Int. Journal of Engineering Research and Applications www.ijera.com
ISSN : 2248-9622, Vol. 4, Issue 3( Version 3), March 2014, pp.35-41
www.ijera.com 40 | P a g e
Figure (9) shows the yearly HC emission in
tons at the intersection for base year 2012 and for the
three future scenarios 2022. Figure reveal if do
nothing scenario will be consider for this intersection,
the future (2022) HC emission in tons will be
increased by 383% than the base year, while if
scenario (2) will be consider then the HC emission
will be increased by 19% with respect to base year,
the best solution will be scenario (3) where the HC
emission will be decreased by 43% compared to base
year.
Figure (10) shows the yearly NOx emission
in tons at the intersection for base year 2012 and for
the three future scenarios 2002. It is clear from figure
that if do nothing scenario will be consider for this
intersection, the future (2022) NOx emission in tons
will be increased by 212% than the base year, while
if scenario (2) will be consider then the NOx
emission will be increased by 142% with respect to
base year, the best solution will be scenario (3) where
the NOx emission will be increased by 24% compared
to base year.
146.95
425.2
374.9
196.3
0
50
100
150
200
250
300
350
400
450
Base Year2012 Do Nothing2022 Signalizing2022 Fly over2022
COEmissioninTonsperyear
Fig. ( 8 ): CO Emission for Different Scenarios
7.32
35.376
8.727
4.135
0
5
10
15
20
25
30
35
40
Base Year2012 Do Nothing2022 Signalizing2022 Fly over2022
HCEmissionintonsperyear
Fig. (9 ): HC Emissions for Different Scenarios
Dr. Fareed M.A.Karim Int. Journal of Engineering Research and Applications www.ijera.com
ISSN : 2248-9622, Vol. 4, Issue 3( Version 3), March 2014, pp.35-41
www.ijera.com 41 | P a g e
IV. Conclusion
The intersection chosen for the study is one
of the major uncontrolled intersections in Sana'a city.
It is decided to improve the future performance of the
intersection with three different scenarios. Scenario
(1) do nothing, while scenario (2) will be signalizing
the intersection and the third scenario will be
constructing the flyover. The future year traffic
(2022) fed into aaSIDRA 2.0 software.
The analysis shows that if do nothing
scenario is considered, the vehicle operating cost in
million $, fuel consumption in million liters, delay in
million vehicle-hour /year, CO2 , HC, CO and NOx
emissions in tons will be increased in year 2022 by
390%, 355%,488%, 357%, 383%, 189% and 212%
respectively.
If scenario (2) will be considered which is
signalizing the intersection, the vehicle operating cost
in million $, fuel consumption in million liters, CO2 ,
HC , CO and NOx emissions in tons in year 2022
will be increased by only 14%, 41%,41%, 19%,
155%, and 142% respectively. Only vehicle delays in
million vehicle-hour/ year will be reduced by 60%.
If scenario (3) will be considered which is
constructing the flyover in the north-south direction,
the vehicle operating cost in million $, fuel
consumption in million liters, delay in million
vehicle-hour /year, CO2 , HC emissions in tons will
be decreased in 2022 by 46%, 41%, 87%, 32%, 43%,
and 142% respectively. Only CO and NOx emission
in tons will be increased by 33% and 24%
respectively.
References
[1] aaSIDRA User Guide (2002), Akçelik and
Associates Private Limited, Australia.
[2] Akçelik R and Biggs D C (1987),
Acceleration Profile Models for Vehicles in
Road Traffic, Transportation Science, 21
(1), pp 36-54.
[3] Biggs, D C (1988), ARFCOM - Models for
Estimating Light to Heavy Vehicle Fuel
Consumption, Research Report ARR No
152, ARRB Transport Research Ltd,
Vermont South, Australia.
[4] Bowyer D P, Akçelik R and Biggs D C
(1985), Guide to Fuel Consumption
Analysis for Urban Traffic Management,
Special Report SR No 32, ARRB Transport
Research Ltd, Vermont South, Australia.
[5] Statistical Year Book (2004), Ministry of
Planning and Development, Central
Statistical Organization, Republic of Yemen.
[6] U.S. Environmental Protection Agency,
http:// www.epa.gov
4.479
14.05
10.866
5.57
0
2
4
6
8
10
12
14
16
Base Year2012 Do Nothing2022 Signalizing2022 Fly over2022
NoxEmissionintonsperyear
Fig. ( 10 ): Nox Emission for Different Scenarios

More Related Content

Similar to G43033541

CALIBRATION OF VEHICLE EMISSIONS-SPEED RELATIONSHIPS FOR THE GREATER CAIRO ROADS
CALIBRATION OF VEHICLE EMISSIONS-SPEED RELATIONSHIPS FOR THE GREATER CAIRO ROADSCALIBRATION OF VEHICLE EMISSIONS-SPEED RELATIONSHIPS FOR THE GREATER CAIRO ROADS
CALIBRATION OF VEHICLE EMISSIONS-SPEED RELATIONSHIPS FOR THE GREATER CAIRO ROADSIAEME Publication
 
IRJET- Study on Vehicular Emission in Trivandrum Urban Centre
IRJET- Study on Vehicular Emission in Trivandrum Urban CentreIRJET- Study on Vehicular Emission in Trivandrum Urban Centre
IRJET- Study on Vehicular Emission in Trivandrum Urban CentreIRJET Journal
 
STUDYING THE EFFECT OF CAR TECHNOLOGY ON CO EMISSIONS AND BENEFITS OF UPDATIN...
STUDYING THE EFFECT OF CAR TECHNOLOGY ON CO EMISSIONS AND BENEFITS OF UPDATIN...STUDYING THE EFFECT OF CAR TECHNOLOGY ON CO EMISSIONS AND BENEFITS OF UPDATIN...
STUDYING THE EFFECT OF CAR TECHNOLOGY ON CO EMISSIONS AND BENEFITS OF UPDATIN...IAEME Publication
 
IRJET- Analytical Evaluation of Vehicular Air Pollutants at Urban Arterial Ro...
IRJET- Analytical Evaluation of Vehicular Air Pollutants at Urban Arterial Ro...IRJET- Analytical Evaluation of Vehicular Air Pollutants at Urban Arterial Ro...
IRJET- Analytical Evaluation of Vehicular Air Pollutants at Urban Arterial Ro...IRJET Journal
 
The Effects of Countdown Signals on Intersection Capacity
The Effects of Countdown Signals on Intersection Capacity The Effects of Countdown Signals on Intersection Capacity
The Effects of Countdown Signals on Intersection Capacity drboon
 
myBas driving cycle for Kuala Terengganu city
myBas driving cycle for Kuala Terengganu city myBas driving cycle for Kuala Terengganu city
myBas driving cycle for Kuala Terengganu city IJECEIAES
 
AMBIENT AIR POLLUTION MODELLING IN PUDUCHERRY, INDIA
AMBIENT AIR POLLUTION MODELLING IN PUDUCHERRY, INDIAAMBIENT AIR POLLUTION MODELLING IN PUDUCHERRY, INDIA
AMBIENT AIR POLLUTION MODELLING IN PUDUCHERRY, INDIAJournal For Research
 
Energy use and CO2 emissions of the Moroccan transport sector
Energy use and CO2 emissions of the Moroccan transport sectorEnergy use and CO2 emissions of the Moroccan transport sector
Energy use and CO2 emissions of the Moroccan transport sectorIJECEIAES
 
IRJET- Design of Parking Area and Traffic Signal for Moodbidri Town based...
IRJET-  	  Design of Parking Area and Traffic Signal for Moodbidri Town based...IRJET-  	  Design of Parking Area and Traffic Signal for Moodbidri Town based...
IRJET- Design of Parking Area and Traffic Signal for Moodbidri Town based...IRJET Journal
 
bajaj two wheeler manufacturing plan electrical
bajaj two wheeler manufacturing plan electricalbajaj two wheeler manufacturing plan electrical
bajaj two wheeler manufacturing plan electricalShiva Kumar HM
 
Fuel wastage and emission due to idling of vehicles at road traffic signals
Fuel wastage and emission due to idling of vehicles at road traffic signalsFuel wastage and emission due to idling of vehicles at road traffic signals
Fuel wastage and emission due to idling of vehicles at road traffic signalseSAT Journals
 
Fuel wastage and emission due to idling of vehicles at
Fuel wastage and emission due to idling of vehicles atFuel wastage and emission due to idling of vehicles at
Fuel wastage and emission due to idling of vehicles ateSAT Publishing House
 
IRJET - To Study Impact of Road Roughness on Free Flow Speed of Vehicle
IRJET - To Study Impact of Road Roughness on Free Flow Speed of VehicleIRJET - To Study Impact of Road Roughness on Free Flow Speed of Vehicle
IRJET - To Study Impact of Road Roughness on Free Flow Speed of VehicleIRJET Journal
 
IRJET- Estimation of Vehicular Emission at Major Road Corridors in Thiruvanth...
IRJET- Estimation of Vehicular Emission at Major Road Corridors in Thiruvanth...IRJET- Estimation of Vehicular Emission at Major Road Corridors in Thiruvanth...
IRJET- Estimation of Vehicular Emission at Major Road Corridors in Thiruvanth...IRJET Journal
 
Transport Sustainability of Dhaka: A Measure of Ecological Footprint and Mean...
Transport Sustainability of Dhaka: A Measure of Ecological Footprint and Mean...Transport Sustainability of Dhaka: A Measure of Ecological Footprint and Mean...
Transport Sustainability of Dhaka: A Measure of Ecological Footprint and Mean...Shahadat Hossain Shakil
 
A Literature towards ongoing trends of automobile washing bay
A Literature towards ongoing trends of automobile washing bayA Literature towards ongoing trends of automobile washing bay
A Literature towards ongoing trends of automobile washing bayIRJET Journal
 

Similar to G43033541 (20)

CALIBRATION OF VEHICLE EMISSIONS-SPEED RELATIONSHIPS FOR THE GREATER CAIRO ROADS
CALIBRATION OF VEHICLE EMISSIONS-SPEED RELATIONSHIPS FOR THE GREATER CAIRO ROADSCALIBRATION OF VEHICLE EMISSIONS-SPEED RELATIONSHIPS FOR THE GREATER CAIRO ROADS
CALIBRATION OF VEHICLE EMISSIONS-SPEED RELATIONSHIPS FOR THE GREATER CAIRO ROADS
 
IRJET- Study on Vehicular Emission in Trivandrum Urban Centre
IRJET- Study on Vehicular Emission in Trivandrum Urban CentreIRJET- Study on Vehicular Emission in Trivandrum Urban Centre
IRJET- Study on Vehicular Emission in Trivandrum Urban Centre
 
STUDYING THE EFFECT OF CAR TECHNOLOGY ON CO EMISSIONS AND BENEFITS OF UPDATIN...
STUDYING THE EFFECT OF CAR TECHNOLOGY ON CO EMISSIONS AND BENEFITS OF UPDATIN...STUDYING THE EFFECT OF CAR TECHNOLOGY ON CO EMISSIONS AND BENEFITS OF UPDATIN...
STUDYING THE EFFECT OF CAR TECHNOLOGY ON CO EMISSIONS AND BENEFITS OF UPDATIN...
 
Ijciet 10 01_004
Ijciet 10 01_004Ijciet 10 01_004
Ijciet 10 01_004
 
IRJET- Analytical Evaluation of Vehicular Air Pollutants at Urban Arterial Ro...
IRJET- Analytical Evaluation of Vehicular Air Pollutants at Urban Arterial Ro...IRJET- Analytical Evaluation of Vehicular Air Pollutants at Urban Arterial Ro...
IRJET- Analytical Evaluation of Vehicular Air Pollutants at Urban Arterial Ro...
 
The Effects of Countdown Signals on Intersection Capacity
The Effects of Countdown Signals on Intersection Capacity The Effects of Countdown Signals on Intersection Capacity
The Effects of Countdown Signals on Intersection Capacity
 
Economic Impact Analysis
Economic Impact AnalysisEconomic Impact Analysis
Economic Impact Analysis
 
myBas driving cycle for Kuala Terengganu city
myBas driving cycle for Kuala Terengganu city myBas driving cycle for Kuala Terengganu city
myBas driving cycle for Kuala Terengganu city
 
Final Defence (3).pptx
Final Defence (3).pptxFinal Defence (3).pptx
Final Defence (3).pptx
 
5. Microsimulation of Traffic
5. Microsimulation of Traffic5. Microsimulation of Traffic
5. Microsimulation of Traffic
 
AMBIENT AIR POLLUTION MODELLING IN PUDUCHERRY, INDIA
AMBIENT AIR POLLUTION MODELLING IN PUDUCHERRY, INDIAAMBIENT AIR POLLUTION MODELLING IN PUDUCHERRY, INDIA
AMBIENT AIR POLLUTION MODELLING IN PUDUCHERRY, INDIA
 
Energy use and CO2 emissions of the Moroccan transport sector
Energy use and CO2 emissions of the Moroccan transport sectorEnergy use and CO2 emissions of the Moroccan transport sector
Energy use and CO2 emissions of the Moroccan transport sector
 
IRJET- Design of Parking Area and Traffic Signal for Moodbidri Town based...
IRJET-  	  Design of Parking Area and Traffic Signal for Moodbidri Town based...IRJET-  	  Design of Parking Area and Traffic Signal for Moodbidri Town based...
IRJET- Design of Parking Area and Traffic Signal for Moodbidri Town based...
 
bajaj two wheeler manufacturing plan electrical
bajaj two wheeler manufacturing plan electricalbajaj two wheeler manufacturing plan electrical
bajaj two wheeler manufacturing plan electrical
 
Fuel wastage and emission due to idling of vehicles at road traffic signals
Fuel wastage and emission due to idling of vehicles at road traffic signalsFuel wastage and emission due to idling of vehicles at road traffic signals
Fuel wastage and emission due to idling of vehicles at road traffic signals
 
Fuel wastage and emission due to idling of vehicles at
Fuel wastage and emission due to idling of vehicles atFuel wastage and emission due to idling of vehicles at
Fuel wastage and emission due to idling of vehicles at
 
IRJET - To Study Impact of Road Roughness on Free Flow Speed of Vehicle
IRJET - To Study Impact of Road Roughness on Free Flow Speed of VehicleIRJET - To Study Impact of Road Roughness on Free Flow Speed of Vehicle
IRJET - To Study Impact of Road Roughness on Free Flow Speed of Vehicle
 
IRJET- Estimation of Vehicular Emission at Major Road Corridors in Thiruvanth...
IRJET- Estimation of Vehicular Emission at Major Road Corridors in Thiruvanth...IRJET- Estimation of Vehicular Emission at Major Road Corridors in Thiruvanth...
IRJET- Estimation of Vehicular Emission at Major Road Corridors in Thiruvanth...
 
Transport Sustainability of Dhaka: A Measure of Ecological Footprint and Mean...
Transport Sustainability of Dhaka: A Measure of Ecological Footprint and Mean...Transport Sustainability of Dhaka: A Measure of Ecological Footprint and Mean...
Transport Sustainability of Dhaka: A Measure of Ecological Footprint and Mean...
 
A Literature towards ongoing trends of automobile washing bay
A Literature towards ongoing trends of automobile washing bayA Literature towards ongoing trends of automobile washing bay
A Literature towards ongoing trends of automobile washing bay
 

Recently uploaded

The 7 Things I Know About Cyber Security After 25 Years | April 2024
The 7 Things I Know About Cyber Security After 25 Years | April 2024The 7 Things I Know About Cyber Security After 25 Years | April 2024
The 7 Things I Know About Cyber Security After 25 Years | April 2024Rafal Los
 
Google AI Hackathon: LLM based Evaluator for RAG
Google AI Hackathon: LLM based Evaluator for RAGGoogle AI Hackathon: LLM based Evaluator for RAG
Google AI Hackathon: LLM based Evaluator for RAGSujit Pal
 
Neo4j - How KGs are shaping the future of Generative AI at AWS Summit London ...
Neo4j - How KGs are shaping the future of Generative AI at AWS Summit London ...Neo4j - How KGs are shaping the future of Generative AI at AWS Summit London ...
Neo4j - How KGs are shaping the future of Generative AI at AWS Summit London ...Neo4j
 
Handwritten Text Recognition for manuscripts and early printed texts
Handwritten Text Recognition for manuscripts and early printed textsHandwritten Text Recognition for manuscripts and early printed texts
Handwritten Text Recognition for manuscripts and early printed textsMaria Levchenko
 
The Codex of Business Writing Software for Real-World Solutions 2.pptx
The Codex of Business Writing Software for Real-World Solutions 2.pptxThe Codex of Business Writing Software for Real-World Solutions 2.pptx
The Codex of Business Writing Software for Real-World Solutions 2.pptxMalak Abu Hammad
 
Boost PC performance: How more available memory can improve productivity
Boost PC performance: How more available memory can improve productivityBoost PC performance: How more available memory can improve productivity
Boost PC performance: How more available memory can improve productivityPrincipled Technologies
 
Unblocking The Main Thread Solving ANRs and Frozen Frames
Unblocking The Main Thread Solving ANRs and Frozen FramesUnblocking The Main Thread Solving ANRs and Frozen Frames
Unblocking The Main Thread Solving ANRs and Frozen FramesSinan KOZAK
 
04-2024-HHUG-Sales-and-Marketing-Alignment.pptx
04-2024-HHUG-Sales-and-Marketing-Alignment.pptx04-2024-HHUG-Sales-and-Marketing-Alignment.pptx
04-2024-HHUG-Sales-and-Marketing-Alignment.pptxHampshireHUG
 
Histor y of HAM Radio presentation slide
Histor y of HAM Radio presentation slideHistor y of HAM Radio presentation slide
Histor y of HAM Radio presentation slidevu2urc
 
08448380779 Call Girls In Greater Kailash - I Women Seeking Men
08448380779 Call Girls In Greater Kailash - I Women Seeking Men08448380779 Call Girls In Greater Kailash - I Women Seeking Men
08448380779 Call Girls In Greater Kailash - I Women Seeking MenDelhi Call girls
 
Kalyanpur ) Call Girls in Lucknow Finest Escorts Service 🍸 8923113531 🎰 Avail...
Kalyanpur ) Call Girls in Lucknow Finest Escorts Service 🍸 8923113531 🎰 Avail...Kalyanpur ) Call Girls in Lucknow Finest Escorts Service 🍸 8923113531 🎰 Avail...
Kalyanpur ) Call Girls in Lucknow Finest Escorts Service 🍸 8923113531 🎰 Avail...gurkirankumar98700
 
Transforming Data Streams with Kafka Connect: An Introduction to Single Messa...
Transforming Data Streams with Kafka Connect: An Introduction to Single Messa...Transforming Data Streams with Kafka Connect: An Introduction to Single Messa...
Transforming Data Streams with Kafka Connect: An Introduction to Single Messa...HostedbyConfluent
 
FULL ENJOY 🔝 8264348440 🔝 Call Girls in Diplomatic Enclave | Delhi
FULL ENJOY 🔝 8264348440 🔝 Call Girls in Diplomatic Enclave | DelhiFULL ENJOY 🔝 8264348440 🔝 Call Girls in Diplomatic Enclave | Delhi
FULL ENJOY 🔝 8264348440 🔝 Call Girls in Diplomatic Enclave | Delhisoniya singh
 
Understanding the Laravel MVC Architecture
Understanding the Laravel MVC ArchitectureUnderstanding the Laravel MVC Architecture
Understanding the Laravel MVC ArchitecturePixlogix Infotech
 
Slack Application Development 101 Slides
Slack Application Development 101 SlidesSlack Application Development 101 Slides
Slack Application Development 101 Slidespraypatel2
 
Maximizing Board Effectiveness 2024 Webinar.pptx
Maximizing Board Effectiveness 2024 Webinar.pptxMaximizing Board Effectiveness 2024 Webinar.pptx
Maximizing Board Effectiveness 2024 Webinar.pptxOnBoard
 
Transcript: #StandardsGoals for 2024: What’s new for BISAC - Tech Forum 2024
Transcript: #StandardsGoals for 2024: What’s new for BISAC - Tech Forum 2024Transcript: #StandardsGoals for 2024: What’s new for BISAC - Tech Forum 2024
Transcript: #StandardsGoals for 2024: What’s new for BISAC - Tech Forum 2024BookNet Canada
 
08448380779 Call Girls In Friends Colony Women Seeking Men
08448380779 Call Girls In Friends Colony Women Seeking Men08448380779 Call Girls In Friends Colony Women Seeking Men
08448380779 Call Girls In Friends Colony Women Seeking MenDelhi Call girls
 
Automating Business Process via MuleSoft Composer | Bangalore MuleSoft Meetup...
Automating Business Process via MuleSoft Composer | Bangalore MuleSoft Meetup...Automating Business Process via MuleSoft Composer | Bangalore MuleSoft Meetup...
Automating Business Process via MuleSoft Composer | Bangalore MuleSoft Meetup...shyamraj55
 
How to Troubleshoot Apps for the Modern Connected Worker
How to Troubleshoot Apps for the Modern Connected WorkerHow to Troubleshoot Apps for the Modern Connected Worker
How to Troubleshoot Apps for the Modern Connected WorkerThousandEyes
 

Recently uploaded (20)

The 7 Things I Know About Cyber Security After 25 Years | April 2024
The 7 Things I Know About Cyber Security After 25 Years | April 2024The 7 Things I Know About Cyber Security After 25 Years | April 2024
The 7 Things I Know About Cyber Security After 25 Years | April 2024
 
Google AI Hackathon: LLM based Evaluator for RAG
Google AI Hackathon: LLM based Evaluator for RAGGoogle AI Hackathon: LLM based Evaluator for RAG
Google AI Hackathon: LLM based Evaluator for RAG
 
Neo4j - How KGs are shaping the future of Generative AI at AWS Summit London ...
Neo4j - How KGs are shaping the future of Generative AI at AWS Summit London ...Neo4j - How KGs are shaping the future of Generative AI at AWS Summit London ...
Neo4j - How KGs are shaping the future of Generative AI at AWS Summit London ...
 
Handwritten Text Recognition for manuscripts and early printed texts
Handwritten Text Recognition for manuscripts and early printed textsHandwritten Text Recognition for manuscripts and early printed texts
Handwritten Text Recognition for manuscripts and early printed texts
 
The Codex of Business Writing Software for Real-World Solutions 2.pptx
The Codex of Business Writing Software for Real-World Solutions 2.pptxThe Codex of Business Writing Software for Real-World Solutions 2.pptx
The Codex of Business Writing Software for Real-World Solutions 2.pptx
 
Boost PC performance: How more available memory can improve productivity
Boost PC performance: How more available memory can improve productivityBoost PC performance: How more available memory can improve productivity
Boost PC performance: How more available memory can improve productivity
 
Unblocking The Main Thread Solving ANRs and Frozen Frames
Unblocking The Main Thread Solving ANRs and Frozen FramesUnblocking The Main Thread Solving ANRs and Frozen Frames
Unblocking The Main Thread Solving ANRs and Frozen Frames
 
04-2024-HHUG-Sales-and-Marketing-Alignment.pptx
04-2024-HHUG-Sales-and-Marketing-Alignment.pptx04-2024-HHUG-Sales-and-Marketing-Alignment.pptx
04-2024-HHUG-Sales-and-Marketing-Alignment.pptx
 
Histor y of HAM Radio presentation slide
Histor y of HAM Radio presentation slideHistor y of HAM Radio presentation slide
Histor y of HAM Radio presentation slide
 
08448380779 Call Girls In Greater Kailash - I Women Seeking Men
08448380779 Call Girls In Greater Kailash - I Women Seeking Men08448380779 Call Girls In Greater Kailash - I Women Seeking Men
08448380779 Call Girls In Greater Kailash - I Women Seeking Men
 
Kalyanpur ) Call Girls in Lucknow Finest Escorts Service 🍸 8923113531 🎰 Avail...
Kalyanpur ) Call Girls in Lucknow Finest Escorts Service 🍸 8923113531 🎰 Avail...Kalyanpur ) Call Girls in Lucknow Finest Escorts Service 🍸 8923113531 🎰 Avail...
Kalyanpur ) Call Girls in Lucknow Finest Escorts Service 🍸 8923113531 🎰 Avail...
 
Transforming Data Streams with Kafka Connect: An Introduction to Single Messa...
Transforming Data Streams with Kafka Connect: An Introduction to Single Messa...Transforming Data Streams with Kafka Connect: An Introduction to Single Messa...
Transforming Data Streams with Kafka Connect: An Introduction to Single Messa...
 
FULL ENJOY 🔝 8264348440 🔝 Call Girls in Diplomatic Enclave | Delhi
FULL ENJOY 🔝 8264348440 🔝 Call Girls in Diplomatic Enclave | DelhiFULL ENJOY 🔝 8264348440 🔝 Call Girls in Diplomatic Enclave | Delhi
FULL ENJOY 🔝 8264348440 🔝 Call Girls in Diplomatic Enclave | Delhi
 
Understanding the Laravel MVC Architecture
Understanding the Laravel MVC ArchitectureUnderstanding the Laravel MVC Architecture
Understanding the Laravel MVC Architecture
 
Slack Application Development 101 Slides
Slack Application Development 101 SlidesSlack Application Development 101 Slides
Slack Application Development 101 Slides
 
Maximizing Board Effectiveness 2024 Webinar.pptx
Maximizing Board Effectiveness 2024 Webinar.pptxMaximizing Board Effectiveness 2024 Webinar.pptx
Maximizing Board Effectiveness 2024 Webinar.pptx
 
Transcript: #StandardsGoals for 2024: What’s new for BISAC - Tech Forum 2024
Transcript: #StandardsGoals for 2024: What’s new for BISAC - Tech Forum 2024Transcript: #StandardsGoals for 2024: What’s new for BISAC - Tech Forum 2024
Transcript: #StandardsGoals for 2024: What’s new for BISAC - Tech Forum 2024
 
08448380779 Call Girls In Friends Colony Women Seeking Men
08448380779 Call Girls In Friends Colony Women Seeking Men08448380779 Call Girls In Friends Colony Women Seeking Men
08448380779 Call Girls In Friends Colony Women Seeking Men
 
Automating Business Process via MuleSoft Composer | Bangalore MuleSoft Meetup...
Automating Business Process via MuleSoft Composer | Bangalore MuleSoft Meetup...Automating Business Process via MuleSoft Composer | Bangalore MuleSoft Meetup...
Automating Business Process via MuleSoft Composer | Bangalore MuleSoft Meetup...
 
How to Troubleshoot Apps for the Modern Connected Worker
How to Troubleshoot Apps for the Modern Connected WorkerHow to Troubleshoot Apps for the Modern Connected Worker
How to Troubleshoot Apps for the Modern Connected Worker
 

G43033541

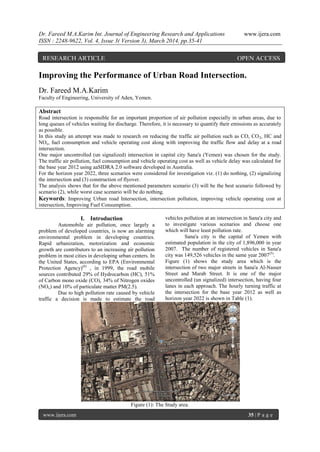
  • 1. Dr. Fareed M.A.Karim Int. Journal of Engineering Research and Applications www.ijera.com ISSN : 2248-9622, Vol. 4, Issue 3( Version 3), March 2014, pp.35-41 www.ijera.com 35 | P a g e Improving the Performance of Urban Road Intersection. Dr. Fareed M.A.Karim Faculty of Engineering, University of Aden, Yemen. Abstract Road intersection is responsible for an important proportion of air pollution especially in urban areas, due to long queues of vehicles waiting for discharge. Therefore, it is necessary to quantify their emissions as accurately as possible. In this study an attempt was made to research on reducing the traffic air pollution such as CO, CO2, HC and NOx, fuel consumption and vehicle operating cost along with improving the traffic flow and delay at a road intersection. One major uncontrolled (un signalized) intersection in capital city Sana'a (Yemen) was chosen for the study. The traffic air pollution, fuel consumption and vehicle operating cost as well as vehicle delay was calculated for the base year 2012 using aaSIDRA 2.0 software developed in Australia. For the horizon year 2022, three scenarios were considered for investigation viz. (1) do nothing, (2) signalizing the intersection and (3) construction of flyover. The analysis shows that for the above mentioned parameters scenario (3) will be the best scenario followed by scenario (2), while worst case scenario will be do nothing. Keywords: Improving Urban road Intersection, intersection pollution, improving vehicle operating cost at intersection, Improving Fuel Consumption. I. Introduction Automobile air pollution, once largely a problem of developed countries, is now an alarming environmental problem in developing countries. Rapid urbanization, motorization and economic growth are contributors to an increasing air pollution problem in most cities in developing urban centers. In the United States, according to EPA (Environmental Protection Agency)(6) , in 1999, the road mobile sources contributed 29% of Hydrocarbon (HC), 51% of Carbon mono oxide (CO), 34% of Nitrogen oxides (NOx) and 10% of particulate matter PM(2.5). Due to high pollution rate caused by vehicle traffic a decision is made to estimate the road vehicles pollution at an intersection in Sana'a city and to investigate various scenarios and choose one which will have least pollution rate. Sana'a city is the capital of Yemen with estimated population in the city of 1,896,000 in year 2007. The number of registered vehicles in Sana'a city was 149,526 vehicles in the same year 2007(5) . Figure (1) shows the study area which is the intersection of two major streets in Sana'a Al-Nasser Street and Marab Street. It is one of the major uncontrolled (un signalized) intersection, having four lanes in each approach. The hourly turning traffic at the intersection for the base year 2012 as well as horizon year 2022 is shown in Table (1). Figure (1): The Study area. RESEARCH ARTICLE OPEN ACCESS
  • 2. Dr. Fareed M.A.Karim Int. Journal of Engineering Research and Applications www.ijera.com ISSN : 2248-9622, Vol. 4, Issue 3( Version 3), March 2014, pp.35-41 www.ijera.com 36 | P a g e Table (1): Peak hour Turning Traffic at the Intersection for the year 2012 and 2022. Year Daily Peak Hour Turning Traffic Total North South East West E S W W N E S W N N E S 2012 90 760 127 540 566 23 25 30 26 172 65 619 3237 2022 152 1285 216 913 957 40 55 66 57 290 143 1362 5890 Figure (2) shows the peak hour turning traffic for the year 2012. Figure (2): Peak hour turning Traffic for the year 2012. II. MATERIAL AND METHOD Road intersection is responsible for an important proportion of air pollution especially in urban areas, due to long queues of vehicles waiting for discharge. It is, therefore, necessary to quantify their emissions as accurately as possible. To estimate pollutant quantities it is necessary to have reliable emission factors and reliable activity data. In Yemen there is no data available as to vehicle emission factors and traffic pollution. There is no systematic monitoring of road side pollutants concentration. In order to have a general overview of the traffic pollution at present and in the near future, the author made a case study of a major un signalized intersection in Sana'a city. Vehicular emission and fuel consumption as well as delays and vehicle operating cost were calculated for this un signalized intersection for the year 2012. To estimate the fuel consumption and vehicular emission such as CO2, HC, CO and NOx, the author used aaSIDRA 2.0 software (1) . aaSIDRA employs four-mode model that provides a highly reliable general method of estimating fuel consumption and pollutant emissions(2),(3),(4) . This method differs from the more commonly used but less accurate three-mode elemental model (cruise, idling and number of stops using excess fuel consumption, excess emission, or excess cost per stop) used by other softwares. For each lane of traffic, aaSIDRA derives drive cycles consisting of a series of cruise, acceleration, deceleration and idling (stopped) time elements for specific traffic conditions (geometry, control and demand flows). Fuel consumption and pollutant emissions are then calculated for each of the four driving modes, and the results added together for the entire driving maneuver. Fuel consumption and emissions are calculated for light and heavy vehicles in each lane separately, and then the total and average values are calculated for all traffic using the lane. Different vehicle parameters (vehicle mass, acceleration and deceleration rates) apply to light and heavy vehicles. To estimate the vehicle operating cost, aaSIDRA 2.0 software require appropriate data to be entered to the program in order to calculate the vehicle operating cost. The following data entered in the program which reflects the present values used in Yemen: Pump price of fuel $/Liter = 0.6 $/Liter Fuel resource cost factor = 0.7 Ratio of Running cost/ Fuel cost = 3 Time Value factor = 0.4 Average occupancy (person /vehicle) =3.4 Average Income = 1$/ hour
  • 3. Dr. Fareed M.A.Karim Int. Journal of Engineering Research and Applications www.ijera.com ISSN : 2248-9622, Vol. 4, Issue 3( Version 3), March 2014, pp.35-41 www.ijera.com 37 | P a g e Saving in the value of time (travel time) is essential based on the average income of various individuals among vehicular passengers, the average vehicle occupancy, and the trip purpose. The average hourly rates for three groups were considered: professionals, skilled labor, and others. The proportion of each of the three groups among vehicular passengers in the study area was estimated at 15%, 25% and 60% respectively. Hourly Rate ($/hr) Professional 2.00 Skilled labor 1.20 Others 0.60 Weighing the hourly rates by the proportion of each group among the vehicle passengers results in the following weighted average. 2.0 x 0.15 = 0.30 1.2 x 0.25 = 0.30 0.6 x 0.60 = 0.36 Average income 0.96 $/hr ≈ 1$/hr. The average saving in travel time is applied to the average vehicle occupancy, to account for all the passenger savings resulting from one hour of reduction in vehicle-hours. Daily savings are multiplied by 332 (instead of 365) to account for annual savings. This ensures that time savings are not overestimated, by avoiding including any time savings for 33 days per year, accounting for days during which traffic levels are low and thus no actual savings are realized, with and without the proposed improvements. In order to minimize the future air pollution, fuel consumption, delay and vehicle operating cost, three scenarios were considered which are: 1) Do nothing scenario 2) Signalization 3) Construction of flyover. aaSIDRA 2.0 software were run for the above three scenarios with the horizon year traffic (2022). Figure (3) below shows the intersection with flyover in the north-south direction. Figure (3): Intersection with proposed fly over in North-South direction. III. Results and Conclusions The necessary input data of vehicular traffic such as number of vehicles entering the intersection, their composition, speed etc. were fed into the software as well as the geometric layout of the intersection such as turning radius, number entering lanes in each approach, width of lanes etc. The output of the software was fuel consumption at the intersection, emission rates of different pollutants, delays of vehicles and vehicle operating cost at the intersection. Figure (4) shows the yearly vehicle operating cost in million $ at the intersection for base year 2012 and for the three future scenarios 2022.
  • 4. Dr. Fareed M.A.Karim Int. Journal of Engineering Research and Applications www.ijera.com ISSN : 2248-9622, Vol. 4, Issue 3( Version 3), March 2014, pp.35-41 www.ijera.com 38 | P a g e It Is Clear From The Figure That If Do Nothing Scenario Will Be Consider For This Intersection, The Future (2022) Vehicle Operating Cost Will Be Increased By 390% Than The Base Year, While If Scenario (2) Will Be Consider Then The Vehicle Operating Cost Will Be Increased Only By 14% With Respect To Base Year, The Best Solution Will Be Scenario (3) Where The Vehicle Operating Cost Will Be Decreased By 46% Compared To Base Year. Figure (5) Shows The Yearly Fuel Consumption In Million Liters At The Intersection For Base Year 2012 And For The Three Future Scenarios 2022. It Obvious From Figure That If Do Nothing Scenario Will Be Consider For This Intersection, The Future (2022) Vehicle Fuel Consumption Will Be Increased By 355% Than The Base Year, While If Scenario (2) Will Be Consider Then The Vehicle Fuel Consumption Will Be Increased By 41% With Respect To Base Year, The Best Solution Will Be Scenario (3) Where The Vehicle Fuel Consumption Will Be Decreased By 32% Compared To Base Year. Figure (6) shows the yearly delay in million vehicle-hours per year at the intersection for base year 2012 and for the three future scenarios 2022. The figure reveal that if do nothing scenario will be consider for this intersection, the future (2022) vehicle delays will be increased by 488% than the base year, while if scenario (2) will be consider 2.737 13.45 3.124 1.46 0 2 4 6 8 10 12 14 16 Base Year2012 Do Nothing2022 Signalizing2022 Fly over2022 VehicleOperatingCostMillion$ Fig (4): Vehice Operating Cost in Million $ 1.384 6.3 1.951 0.94 0 1 2 3 4 5 6 7 Base Year2012 Do Nothing2022 Signalizing2022 Fly over2022 FuelConsumptioninMillionLitres Fig. (5): Fuel Consumption in Million Litres
  • 5. Dr. Fareed M.A.Karim Int. Journal of Engineering Research and Applications www.ijera.com ISSN : 2248-9622, Vol. 4, Issue 3( Version 3), March 2014, pp.35-41 www.ijera.com 39 | P a g e then the vehicle delays will be decreased by 60% with respect to base year, the best solution will be scenario (3) where the vehicle delays will be decreased by 87% compared to base year. Figure (7) shows the yearly CO2 emission in tons at the intersection for base year 2012 and for the three future scenarios 2022. It is clear from the figure that if do nothing scenario will be consider for this intersection, the future (2022) CO2 emission in tons will be increased by 350% than the base year, while if scenario (2) will be consider then the CO2 emission will be increased only by 41% with respect to base year, the best solution will be scenario (3) where the CO2 emission will be decreased by 32% compared to the base year. Figure (8) shows the yearly CO emission in tons at the intersection for base year 2012 and for the three future scenarios 2022. It is obvious from figure if do nothing scenario will be consider for this intersection, the future (2022) CO emission in tons will be increased by 190% than the base year, while if scenario (2) will be consider then the CO emission will be increased by 155% with respect to base year, the best solution will be scenario (3) where the CO emission will be increased only by 33% compared to base year. 0.66649 3.93324 0.267289 0.088877 0 0.5 1 1.5 2 2.5 3 3.5 4 4.5 Base Year2012 Do Nothing2022 Signalizing2022 Fly over2022 DelayinmillionVehicle-hourperyear Fig. (6): Delay in Million Vehicle-hour/Year 3463.5 15757 4884.43 2355.7 0 2000 4000 6000 8000 10000 12000 14000 16000 18000 Base Year2012 Do Nothing2022 Signalizing2022 Fly over2022 CO2EmissioninTonsperYear Fig.(7 ): CO2 Emission for Different Scenarios
  • 6. Dr. Fareed M.A.Karim Int. Journal of Engineering Research and Applications www.ijera.com ISSN : 2248-9622, Vol. 4, Issue 3( Version 3), March 2014, pp.35-41 www.ijera.com 40 | P a g e Figure (9) shows the yearly HC emission in tons at the intersection for base year 2012 and for the three future scenarios 2022. Figure reveal if do nothing scenario will be consider for this intersection, the future (2022) HC emission in tons will be increased by 383% than the base year, while if scenario (2) will be consider then the HC emission will be increased by 19% with respect to base year, the best solution will be scenario (3) where the HC emission will be decreased by 43% compared to base year. Figure (10) shows the yearly NOx emission in tons at the intersection for base year 2012 and for the three future scenarios 2002. It is clear from figure that if do nothing scenario will be consider for this intersection, the future (2022) NOx emission in tons will be increased by 212% than the base year, while if scenario (2) will be consider then the NOx emission will be increased by 142% with respect to base year, the best solution will be scenario (3) where the NOx emission will be increased by 24% compared to base year. 146.95 425.2 374.9 196.3 0 50 100 150 200 250 300 350 400 450 Base Year2012 Do Nothing2022 Signalizing2022 Fly over2022 COEmissioninTonsperyear Fig. ( 8 ): CO Emission for Different Scenarios 7.32 35.376 8.727 4.135 0 5 10 15 20 25 30 35 40 Base Year2012 Do Nothing2022 Signalizing2022 Fly over2022 HCEmissionintonsperyear Fig. (9 ): HC Emissions for Different Scenarios
  • 7. Dr. Fareed M.A.Karim Int. Journal of Engineering Research and Applications www.ijera.com ISSN : 2248-9622, Vol. 4, Issue 3( Version 3), March 2014, pp.35-41 www.ijera.com 41 | P a g e IV. Conclusion The intersection chosen for the study is one of the major uncontrolled intersections in Sana'a city. It is decided to improve the future performance of the intersection with three different scenarios. Scenario (1) do nothing, while scenario (2) will be signalizing the intersection and the third scenario will be constructing the flyover. The future year traffic (2022) fed into aaSIDRA 2.0 software. The analysis shows that if do nothing scenario is considered, the vehicle operating cost in million $, fuel consumption in million liters, delay in million vehicle-hour /year, CO2 , HC, CO and NOx emissions in tons will be increased in year 2022 by 390%, 355%,488%, 357%, 383%, 189% and 212% respectively. If scenario (2) will be considered which is signalizing the intersection, the vehicle operating cost in million $, fuel consumption in million liters, CO2 , HC , CO and NOx emissions in tons in year 2022 will be increased by only 14%, 41%,41%, 19%, 155%, and 142% respectively. Only vehicle delays in million vehicle-hour/ year will be reduced by 60%. If scenario (3) will be considered which is constructing the flyover in the north-south direction, the vehicle operating cost in million $, fuel consumption in million liters, delay in million vehicle-hour /year, CO2 , HC emissions in tons will be decreased in 2022 by 46%, 41%, 87%, 32%, 43%, and 142% respectively. Only CO and NOx emission in tons will be increased by 33% and 24% respectively. References [1] aaSIDRA User Guide (2002), Akçelik and Associates Private Limited, Australia. [2] Akçelik R and Biggs D C (1987), Acceleration Profile Models for Vehicles in Road Traffic, Transportation Science, 21 (1), pp 36-54. [3] Biggs, D C (1988), ARFCOM - Models for Estimating Light to Heavy Vehicle Fuel Consumption, Research Report ARR No 152, ARRB Transport Research Ltd, Vermont South, Australia. [4] Bowyer D P, Akçelik R and Biggs D C (1985), Guide to Fuel Consumption Analysis for Urban Traffic Management, Special Report SR No 32, ARRB Transport Research Ltd, Vermont South, Australia. [5] Statistical Year Book (2004), Ministry of Planning and Development, Central Statistical Organization, Republic of Yemen. [6] U.S. Environmental Protection Agency, http:// www.epa.gov 4.479 14.05 10.866 5.57 0 2 4 6 8 10 12 14 16 Base Year2012 Do Nothing2022 Signalizing2022 Fly over2022 NoxEmissionintonsperyear Fig. ( 10 ): Nox Emission for Different Scenarios