Download as KEY, PPTX
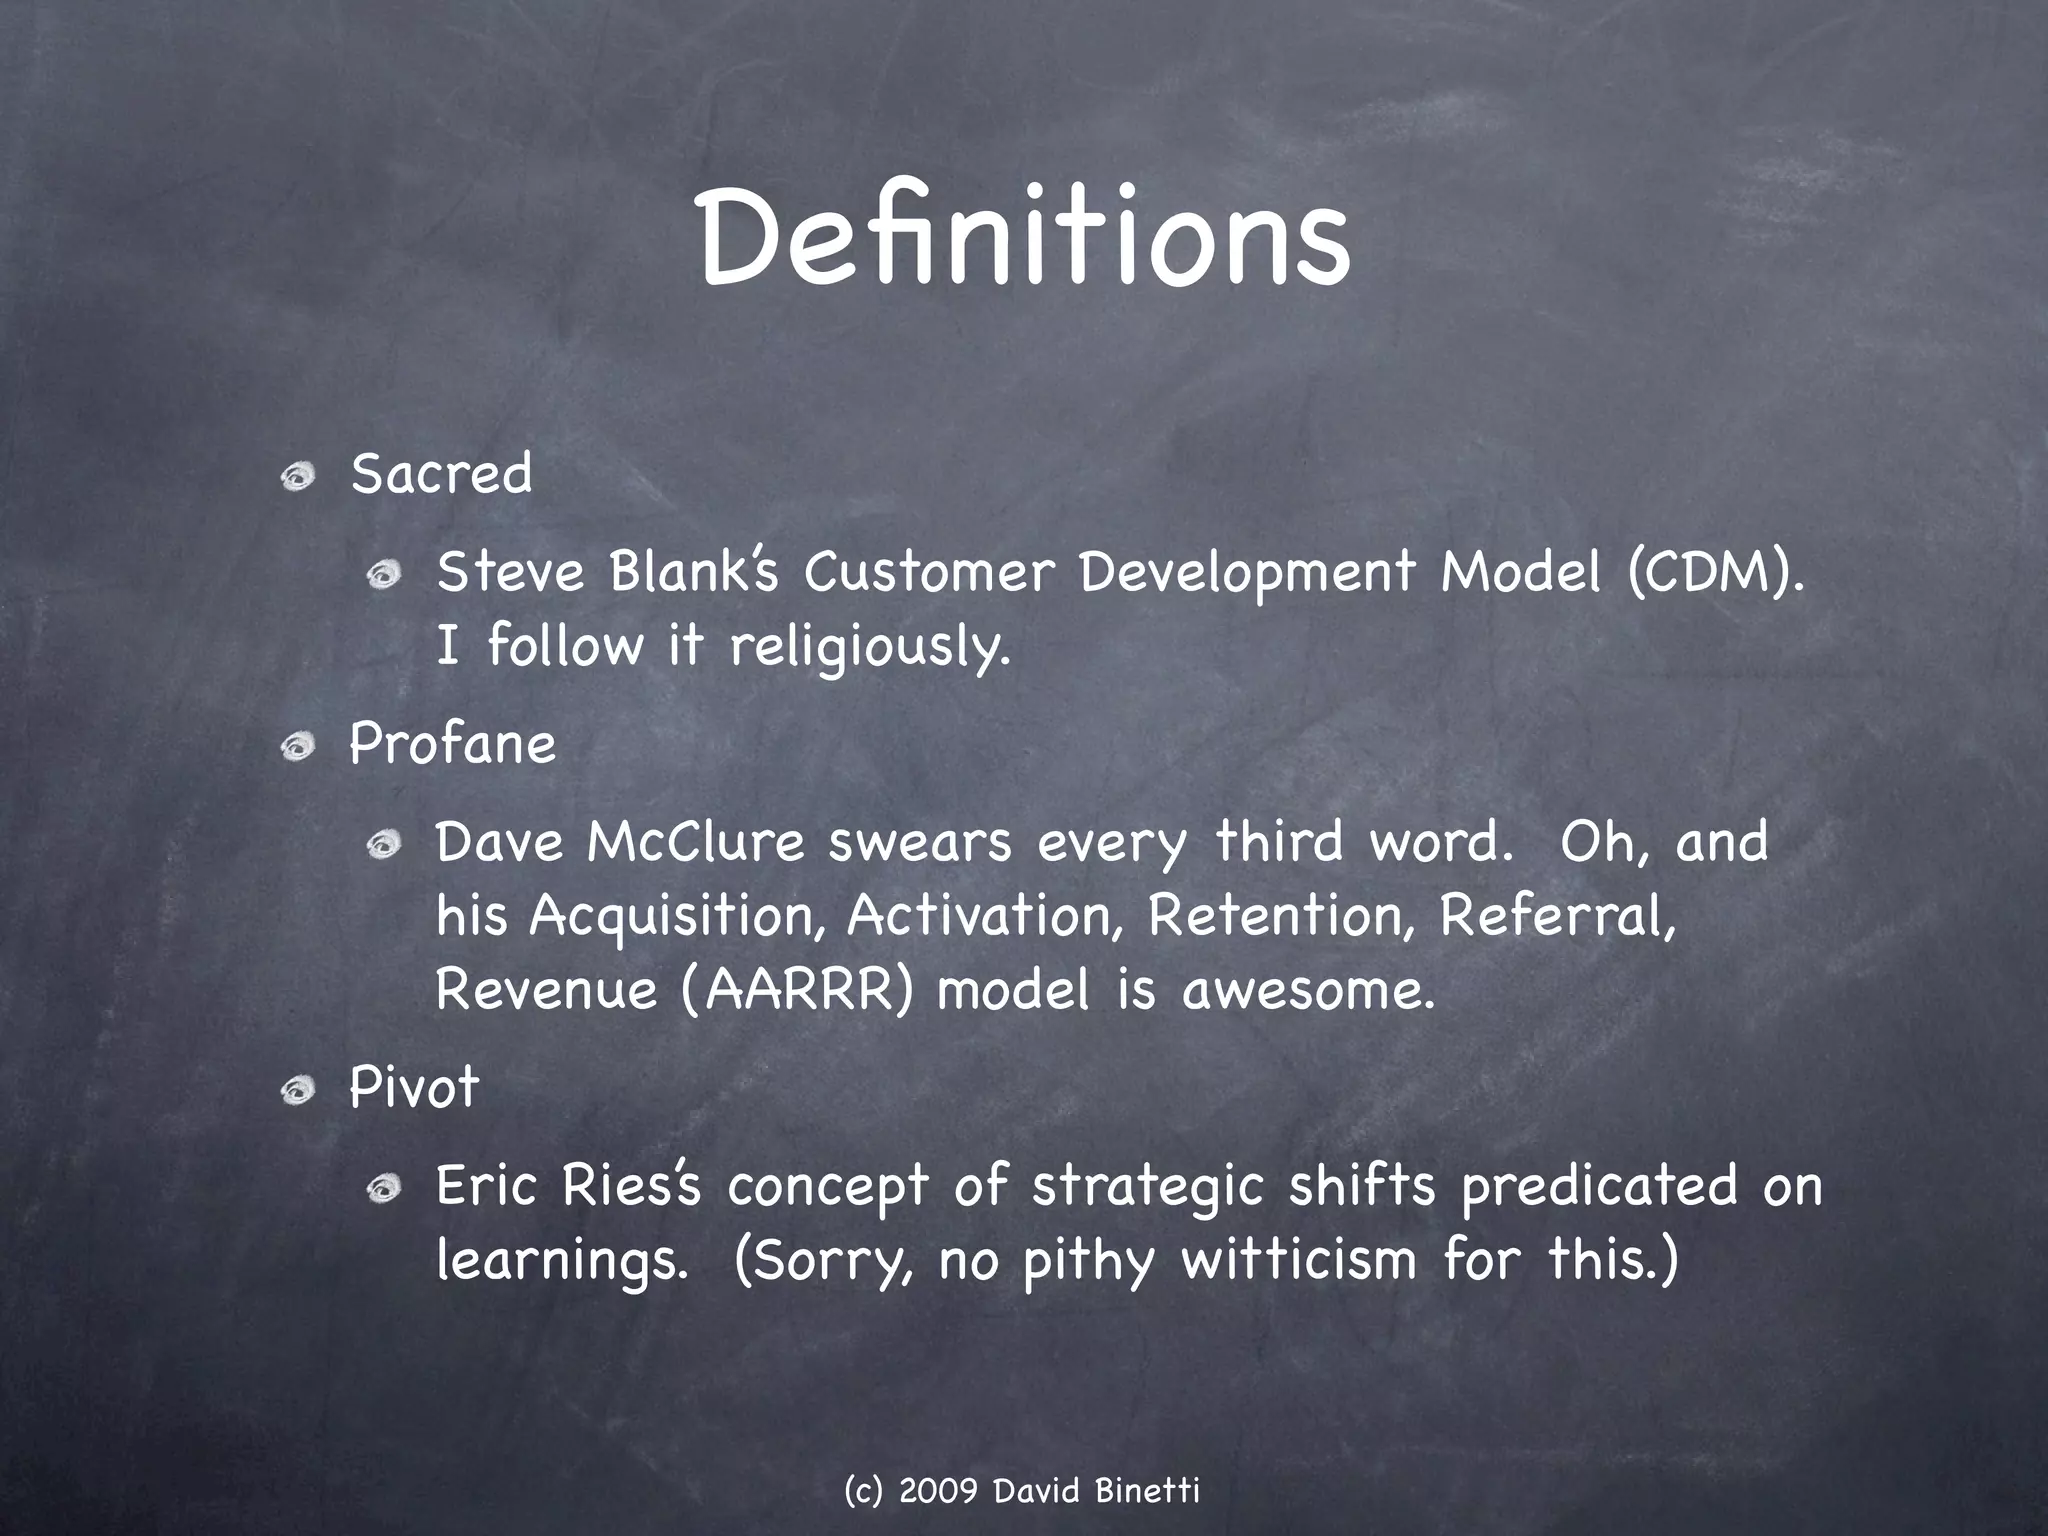
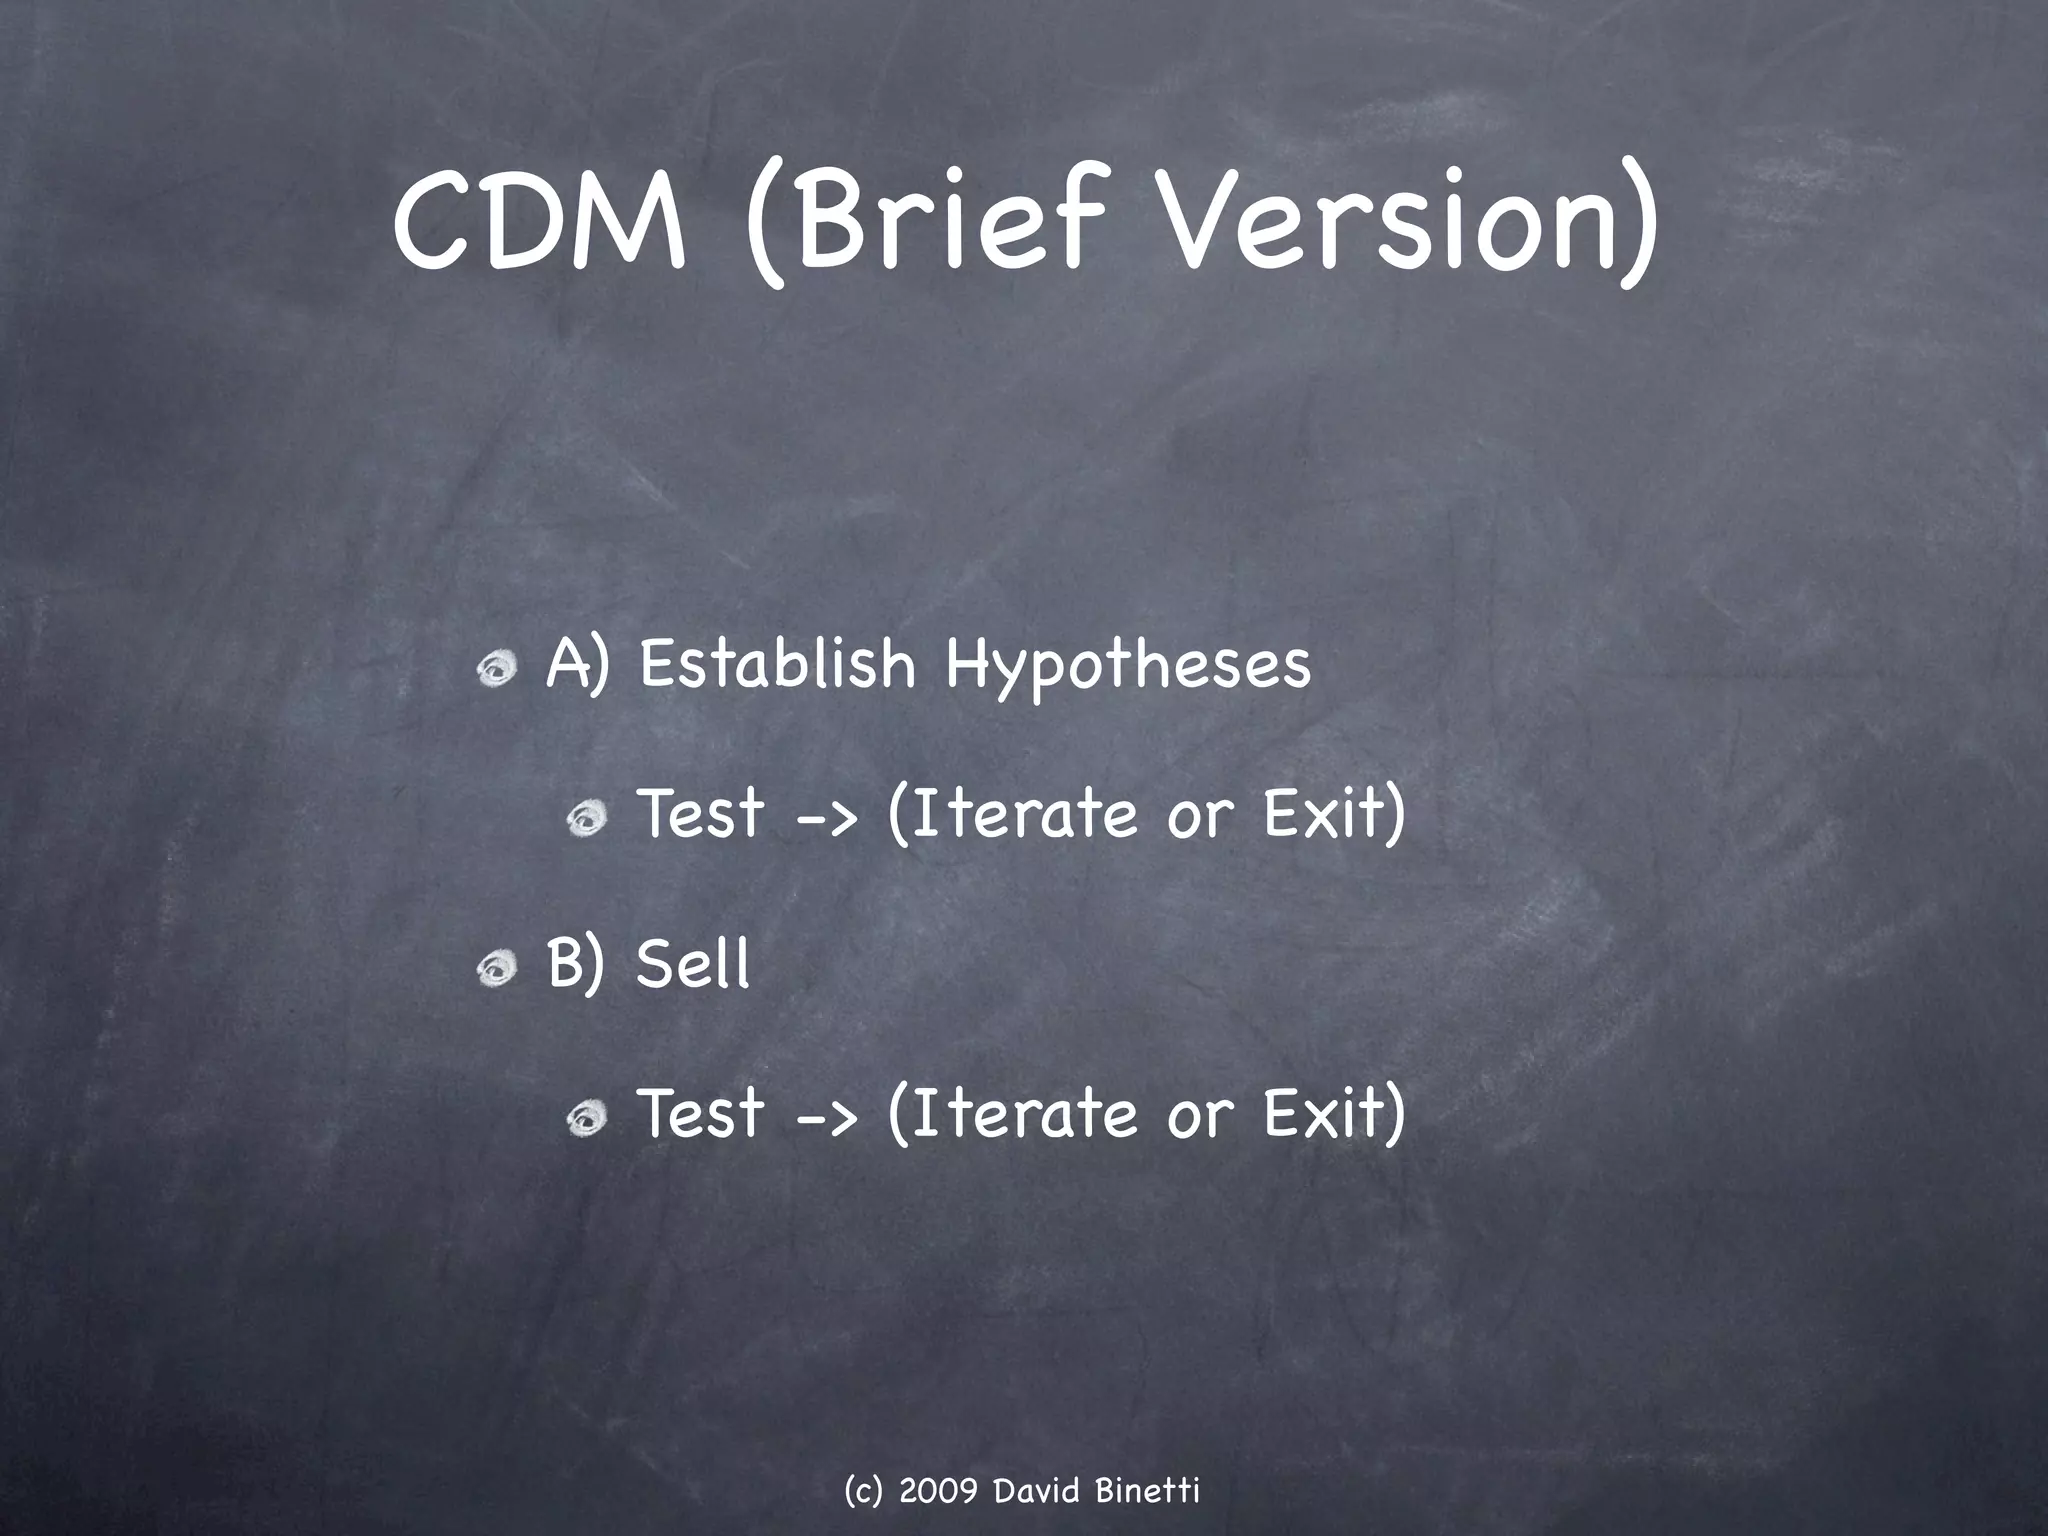
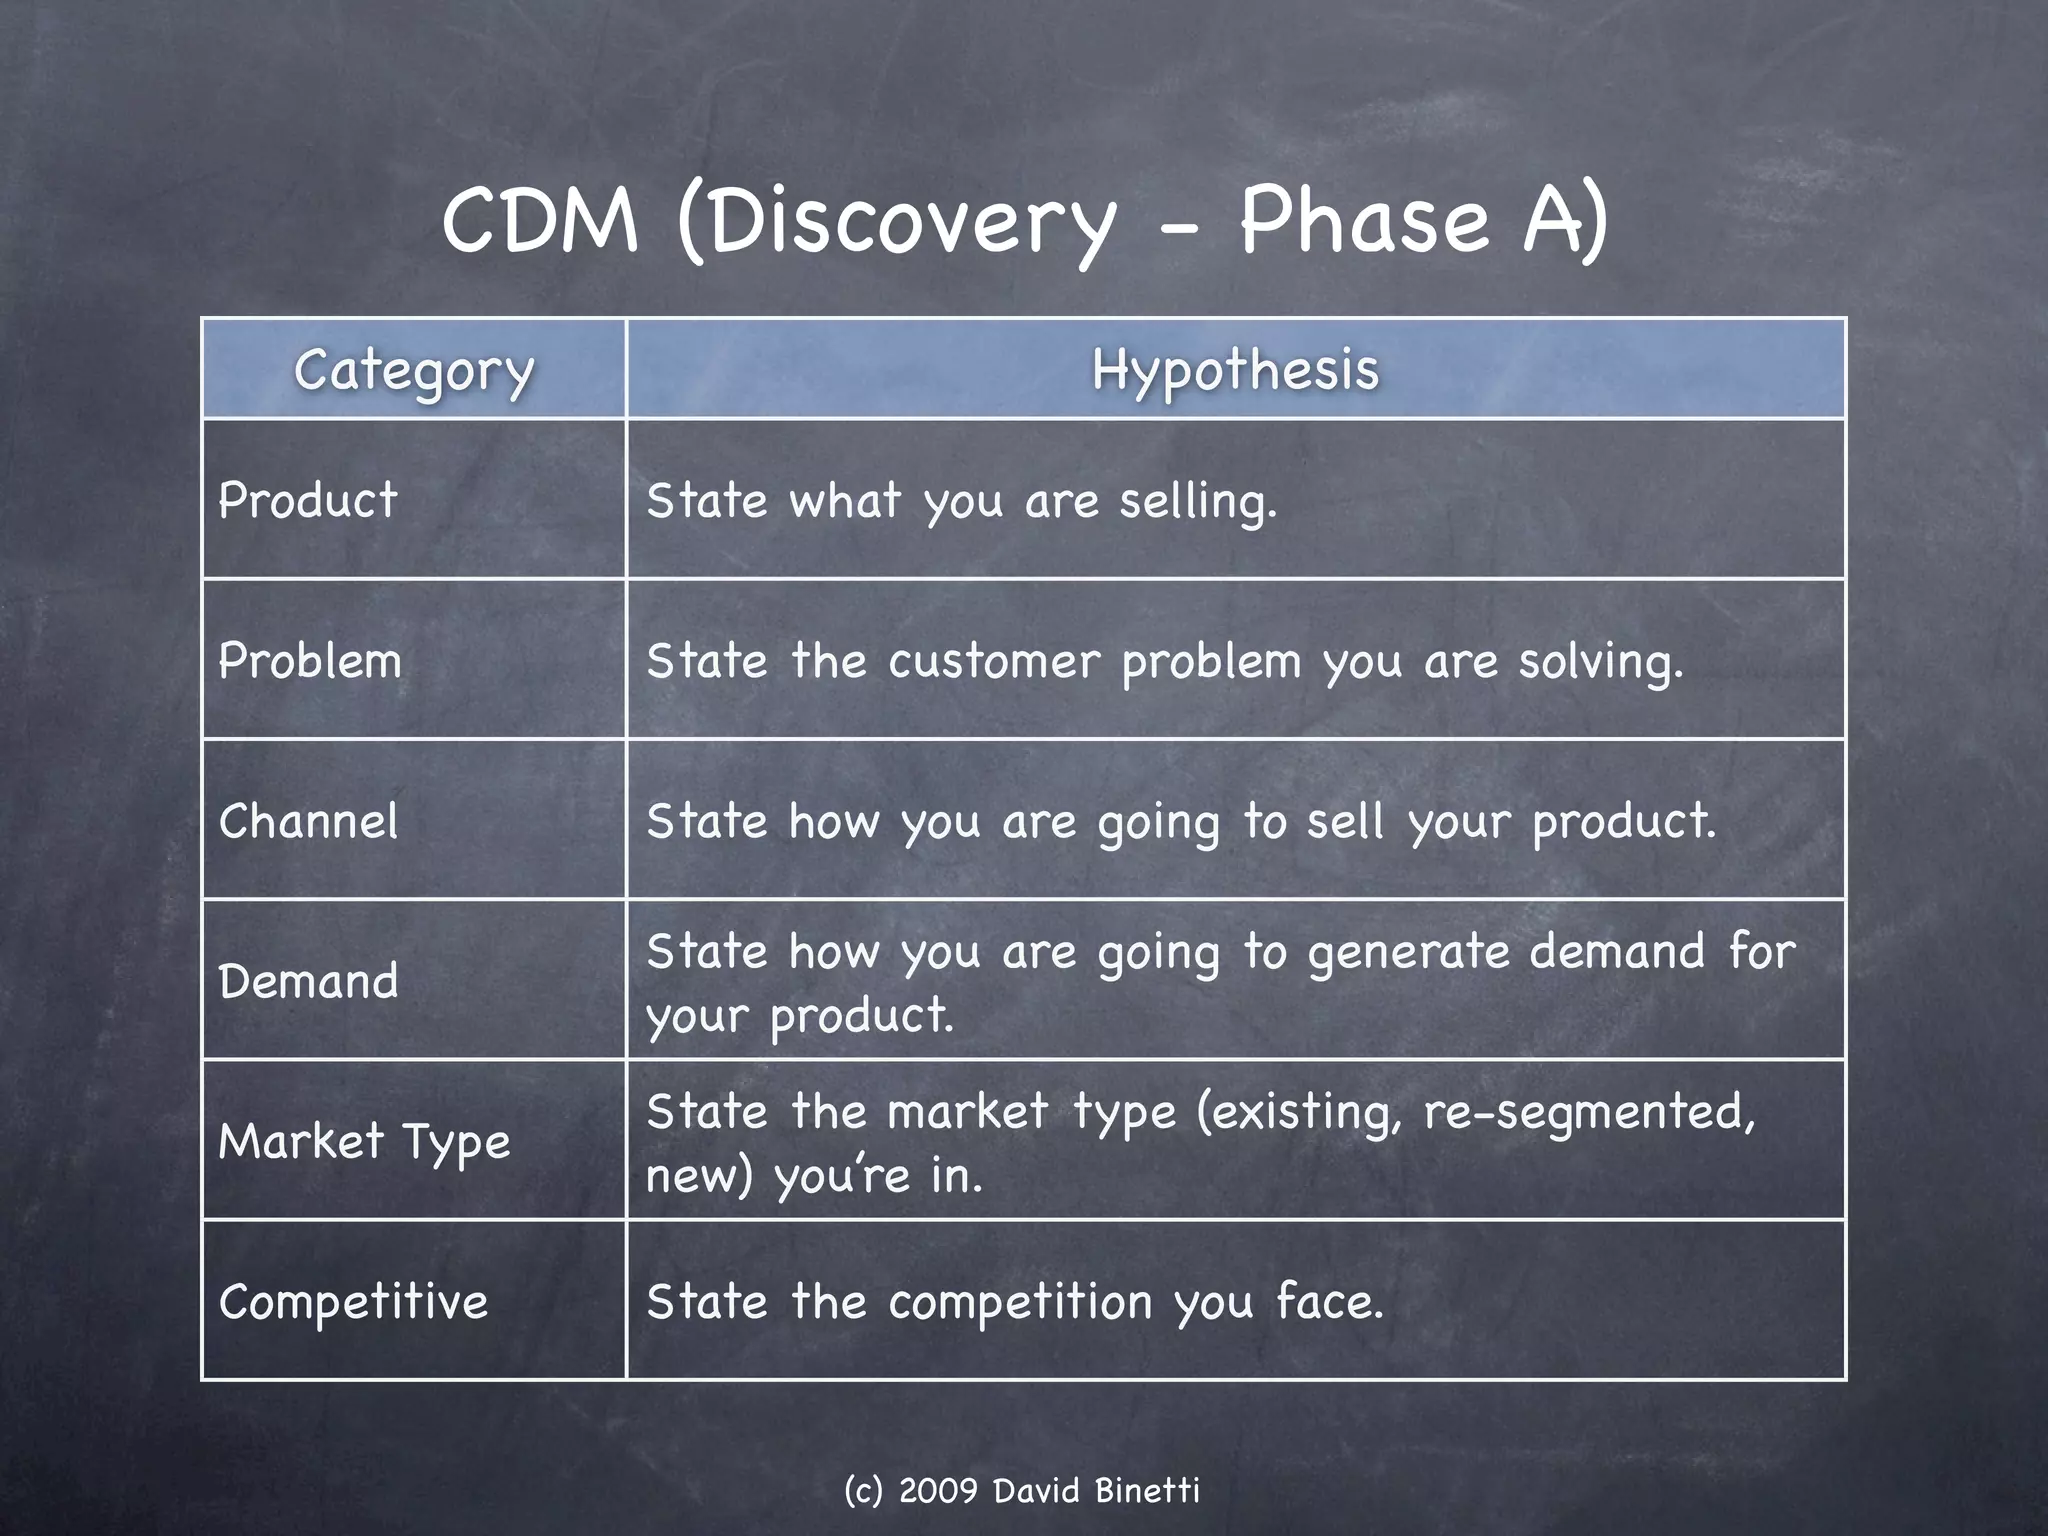
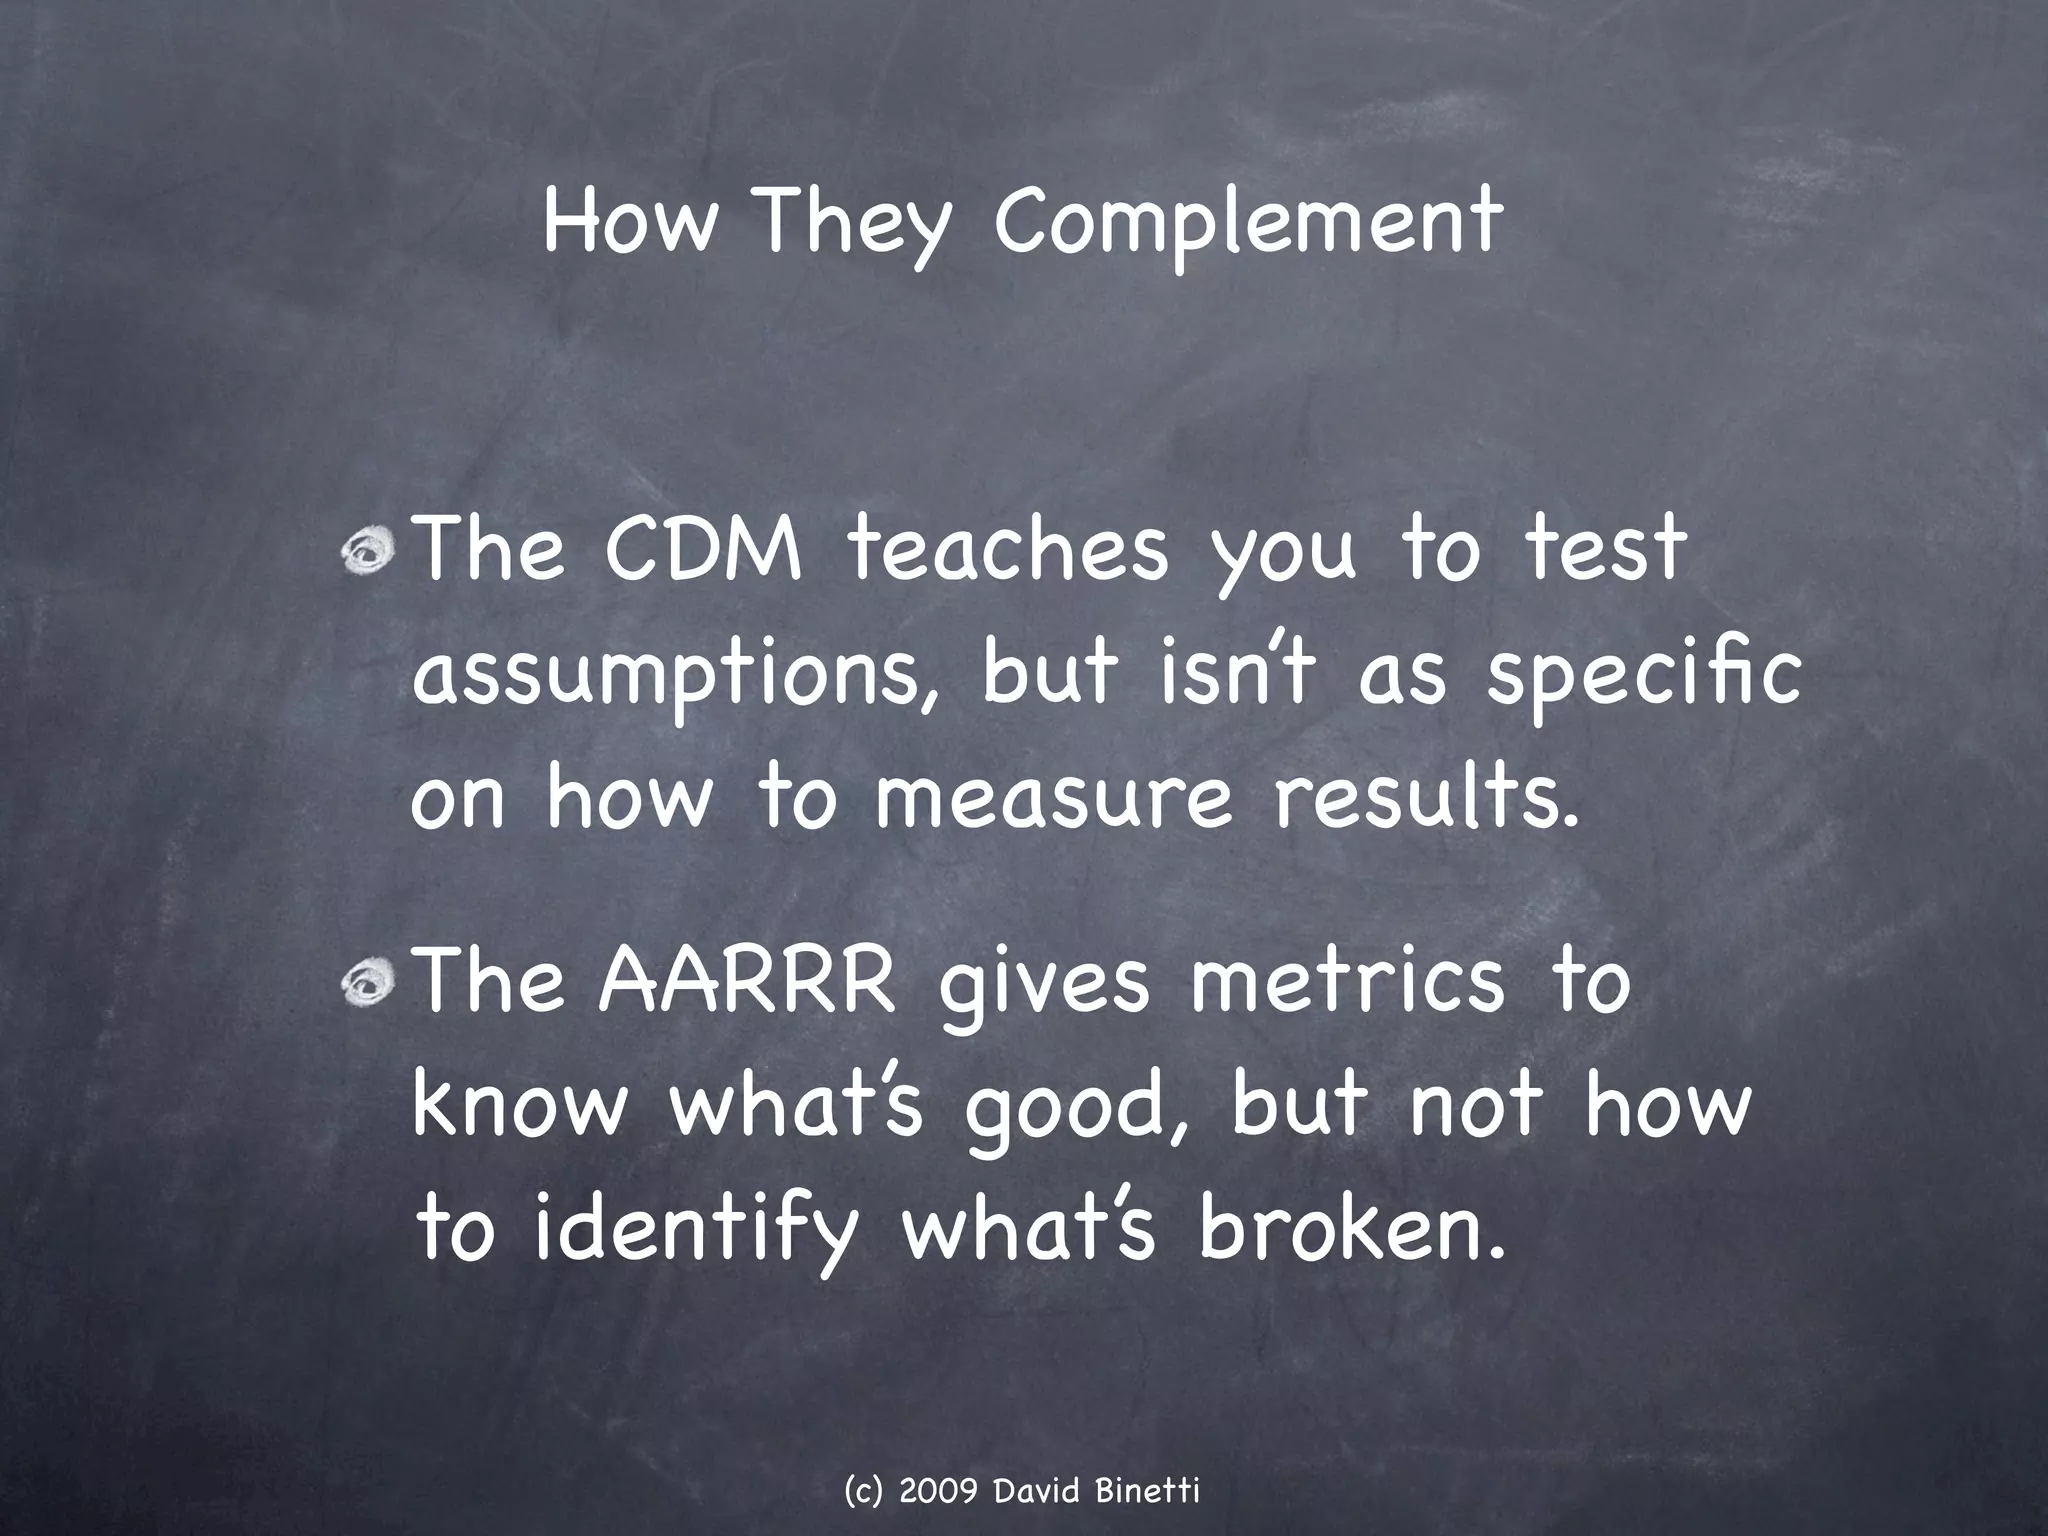
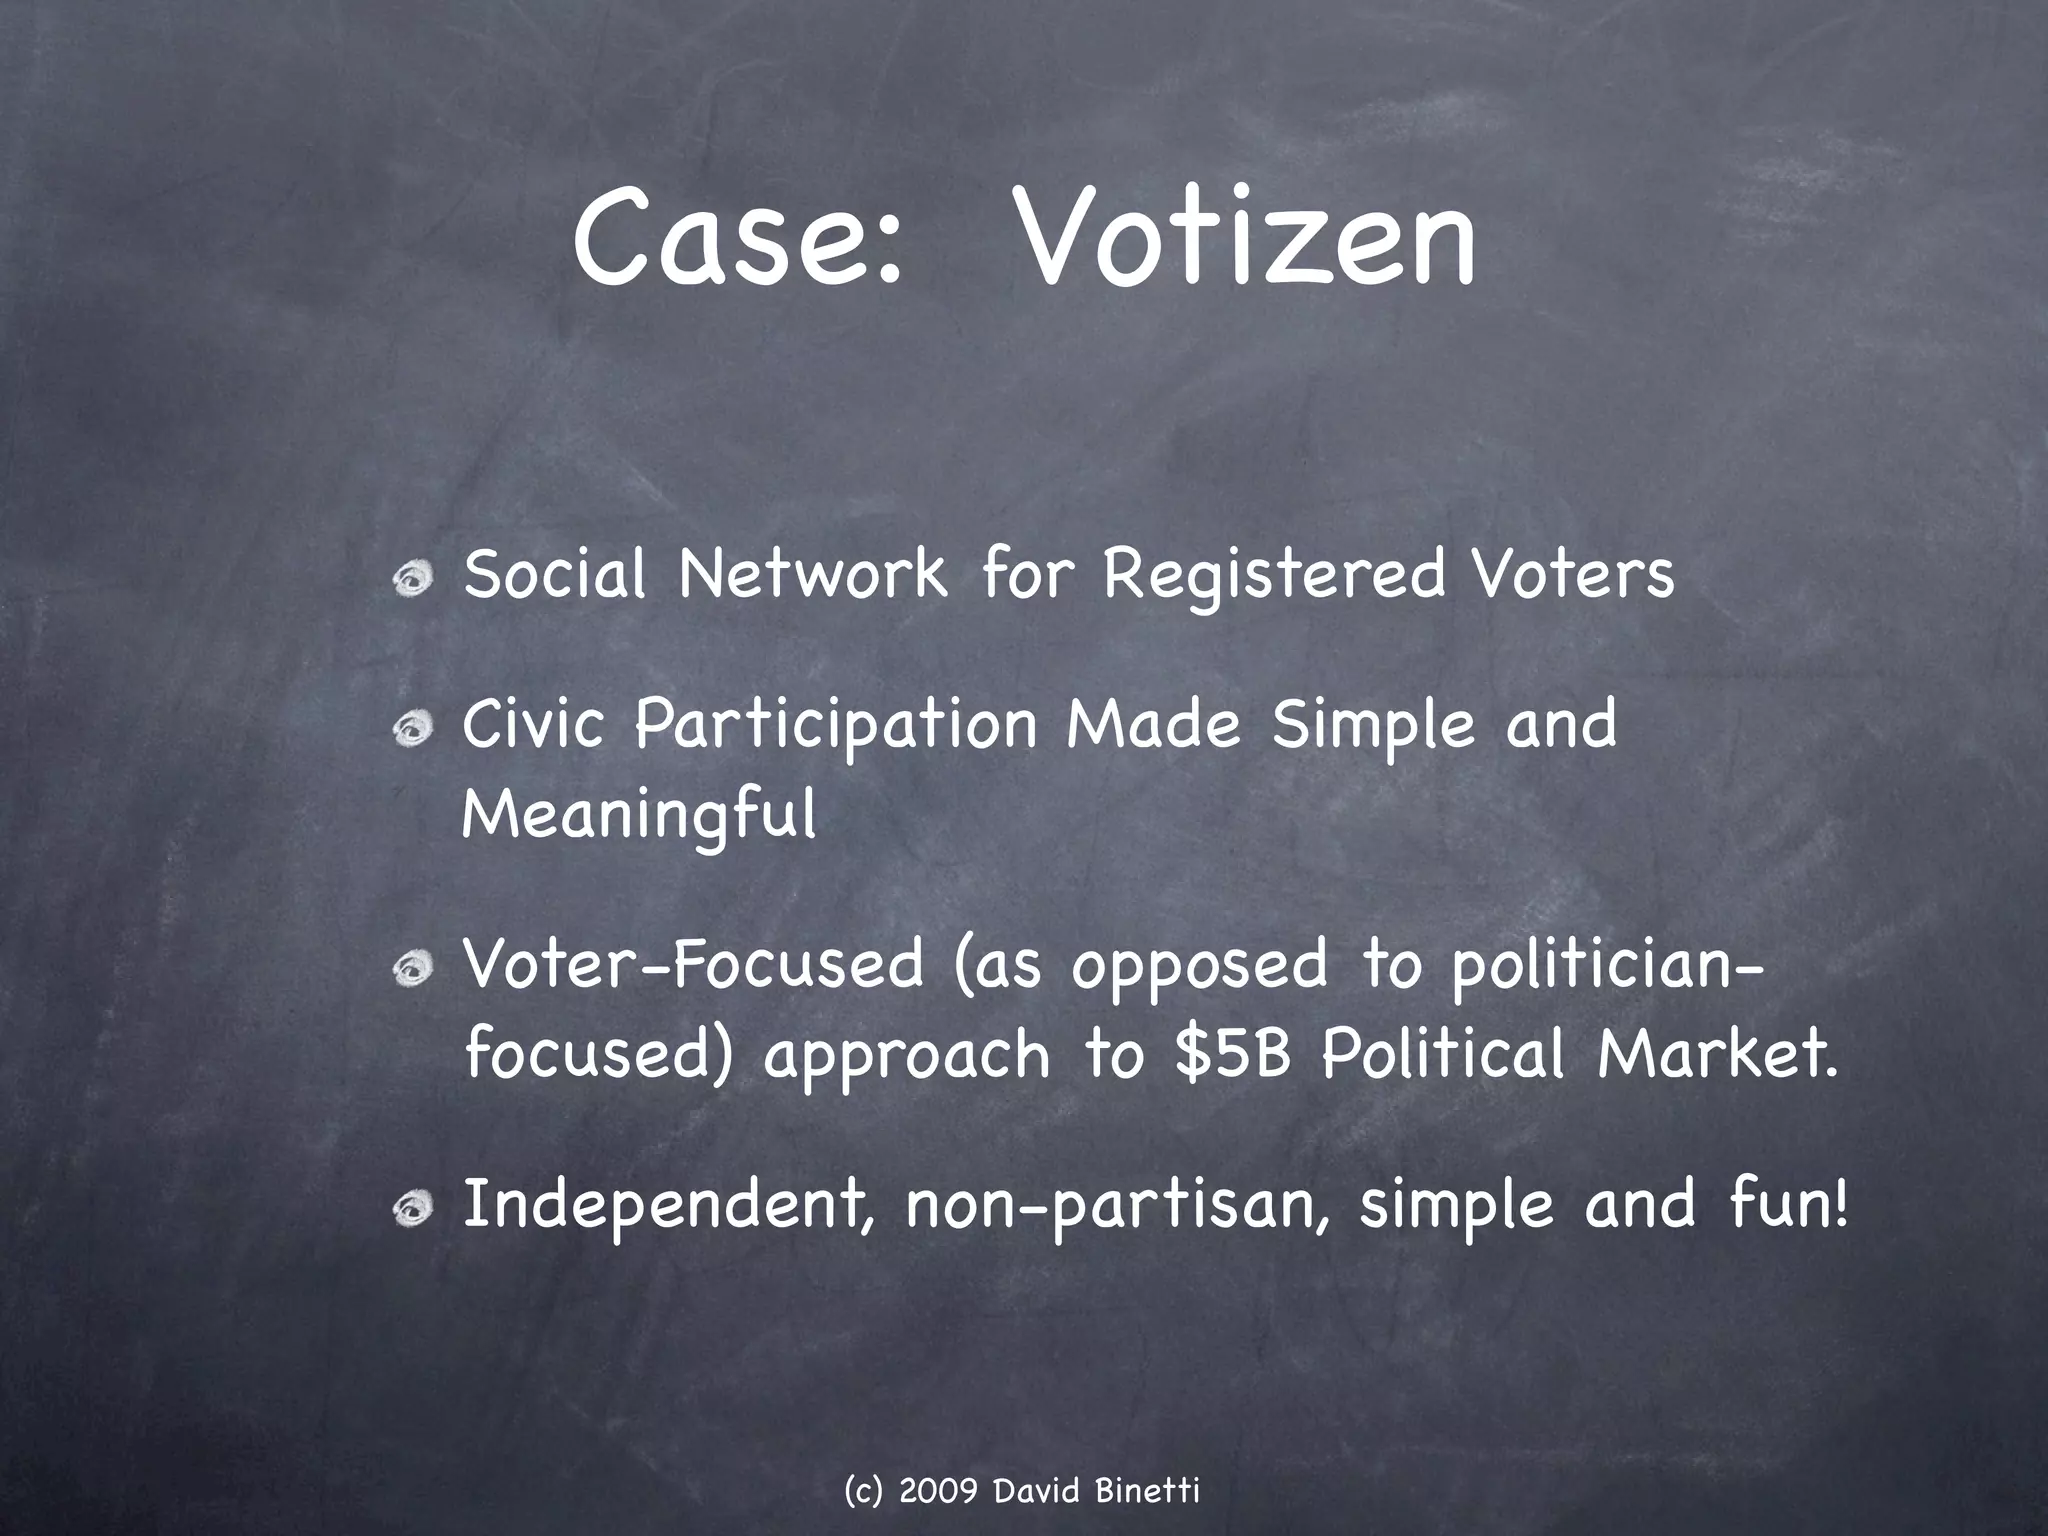
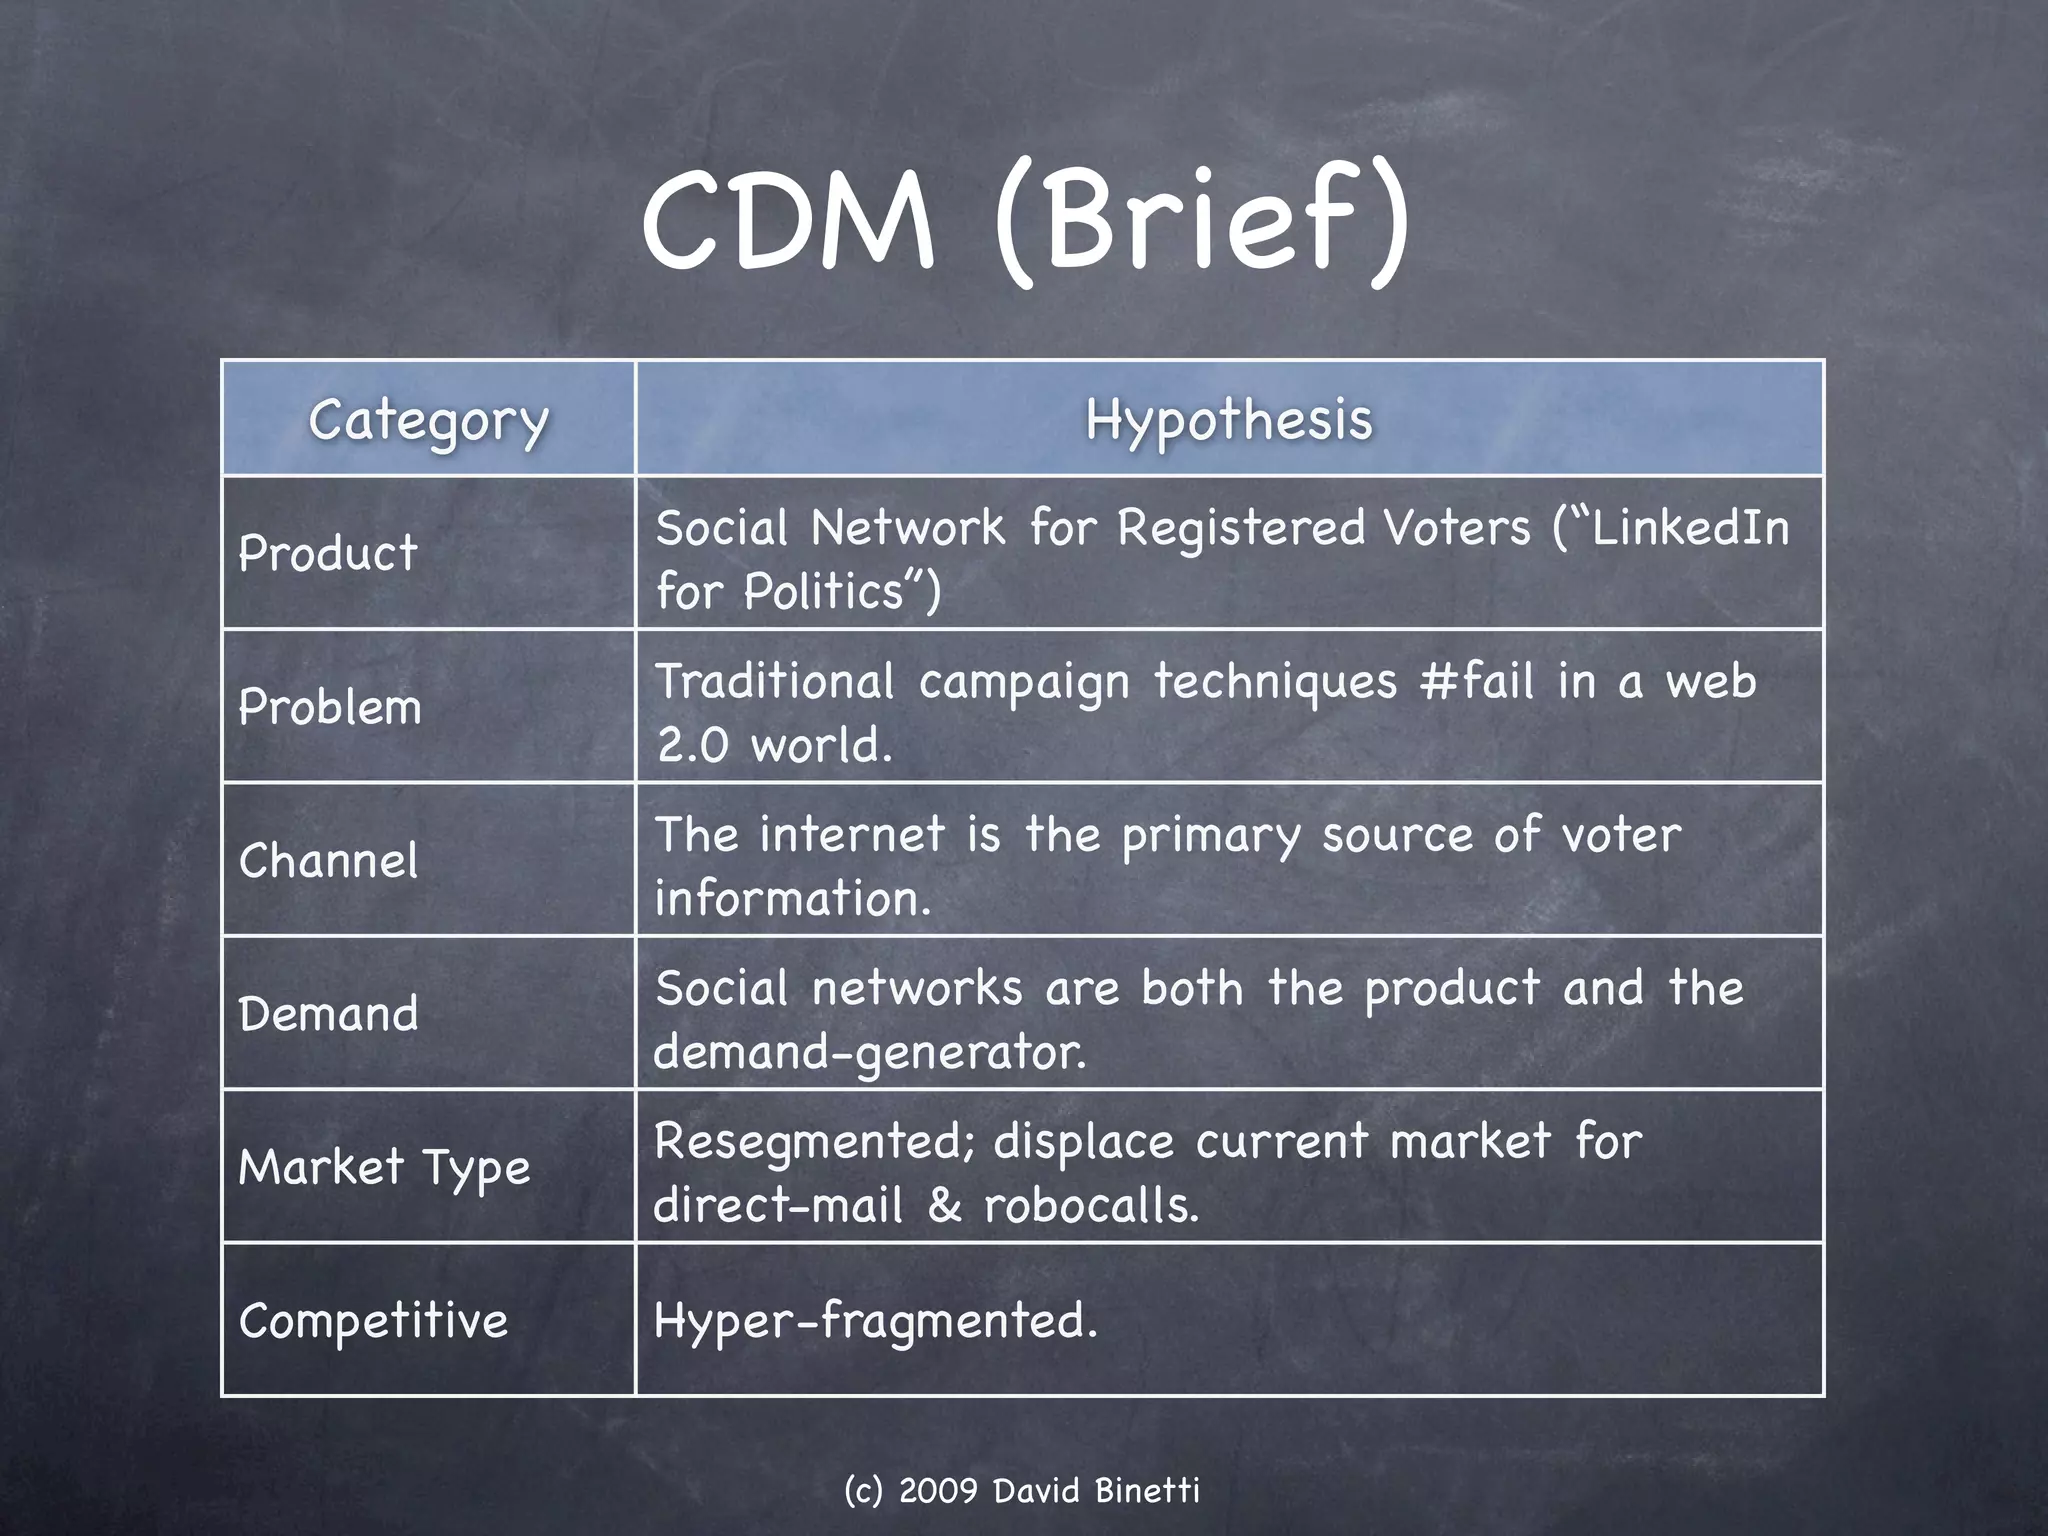
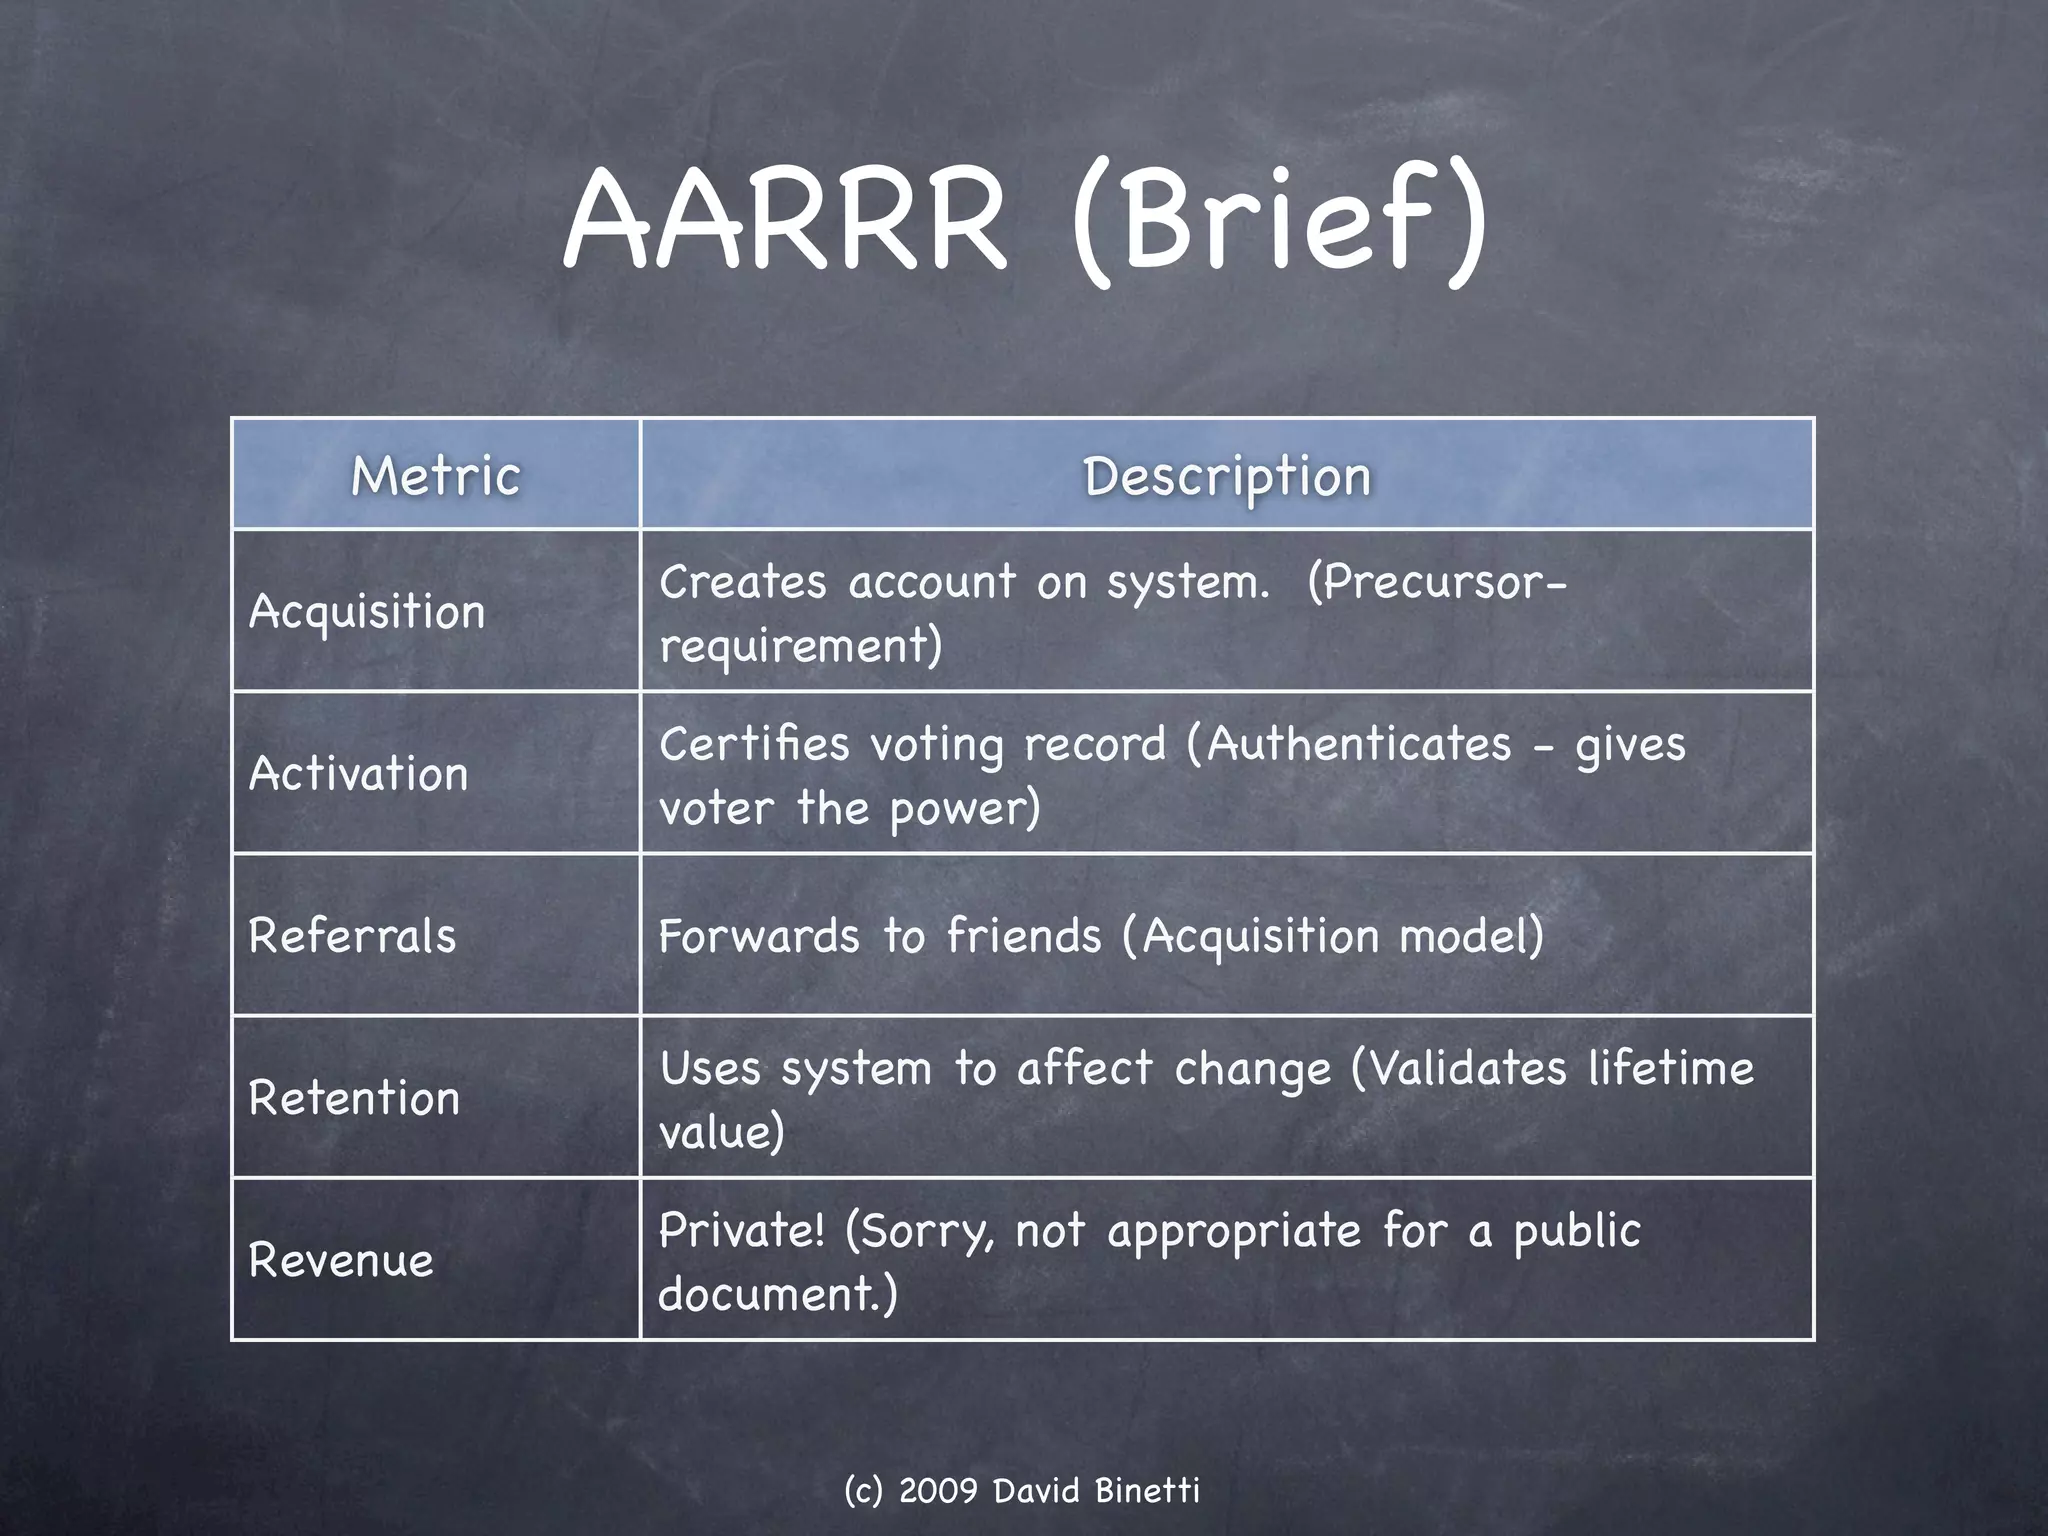
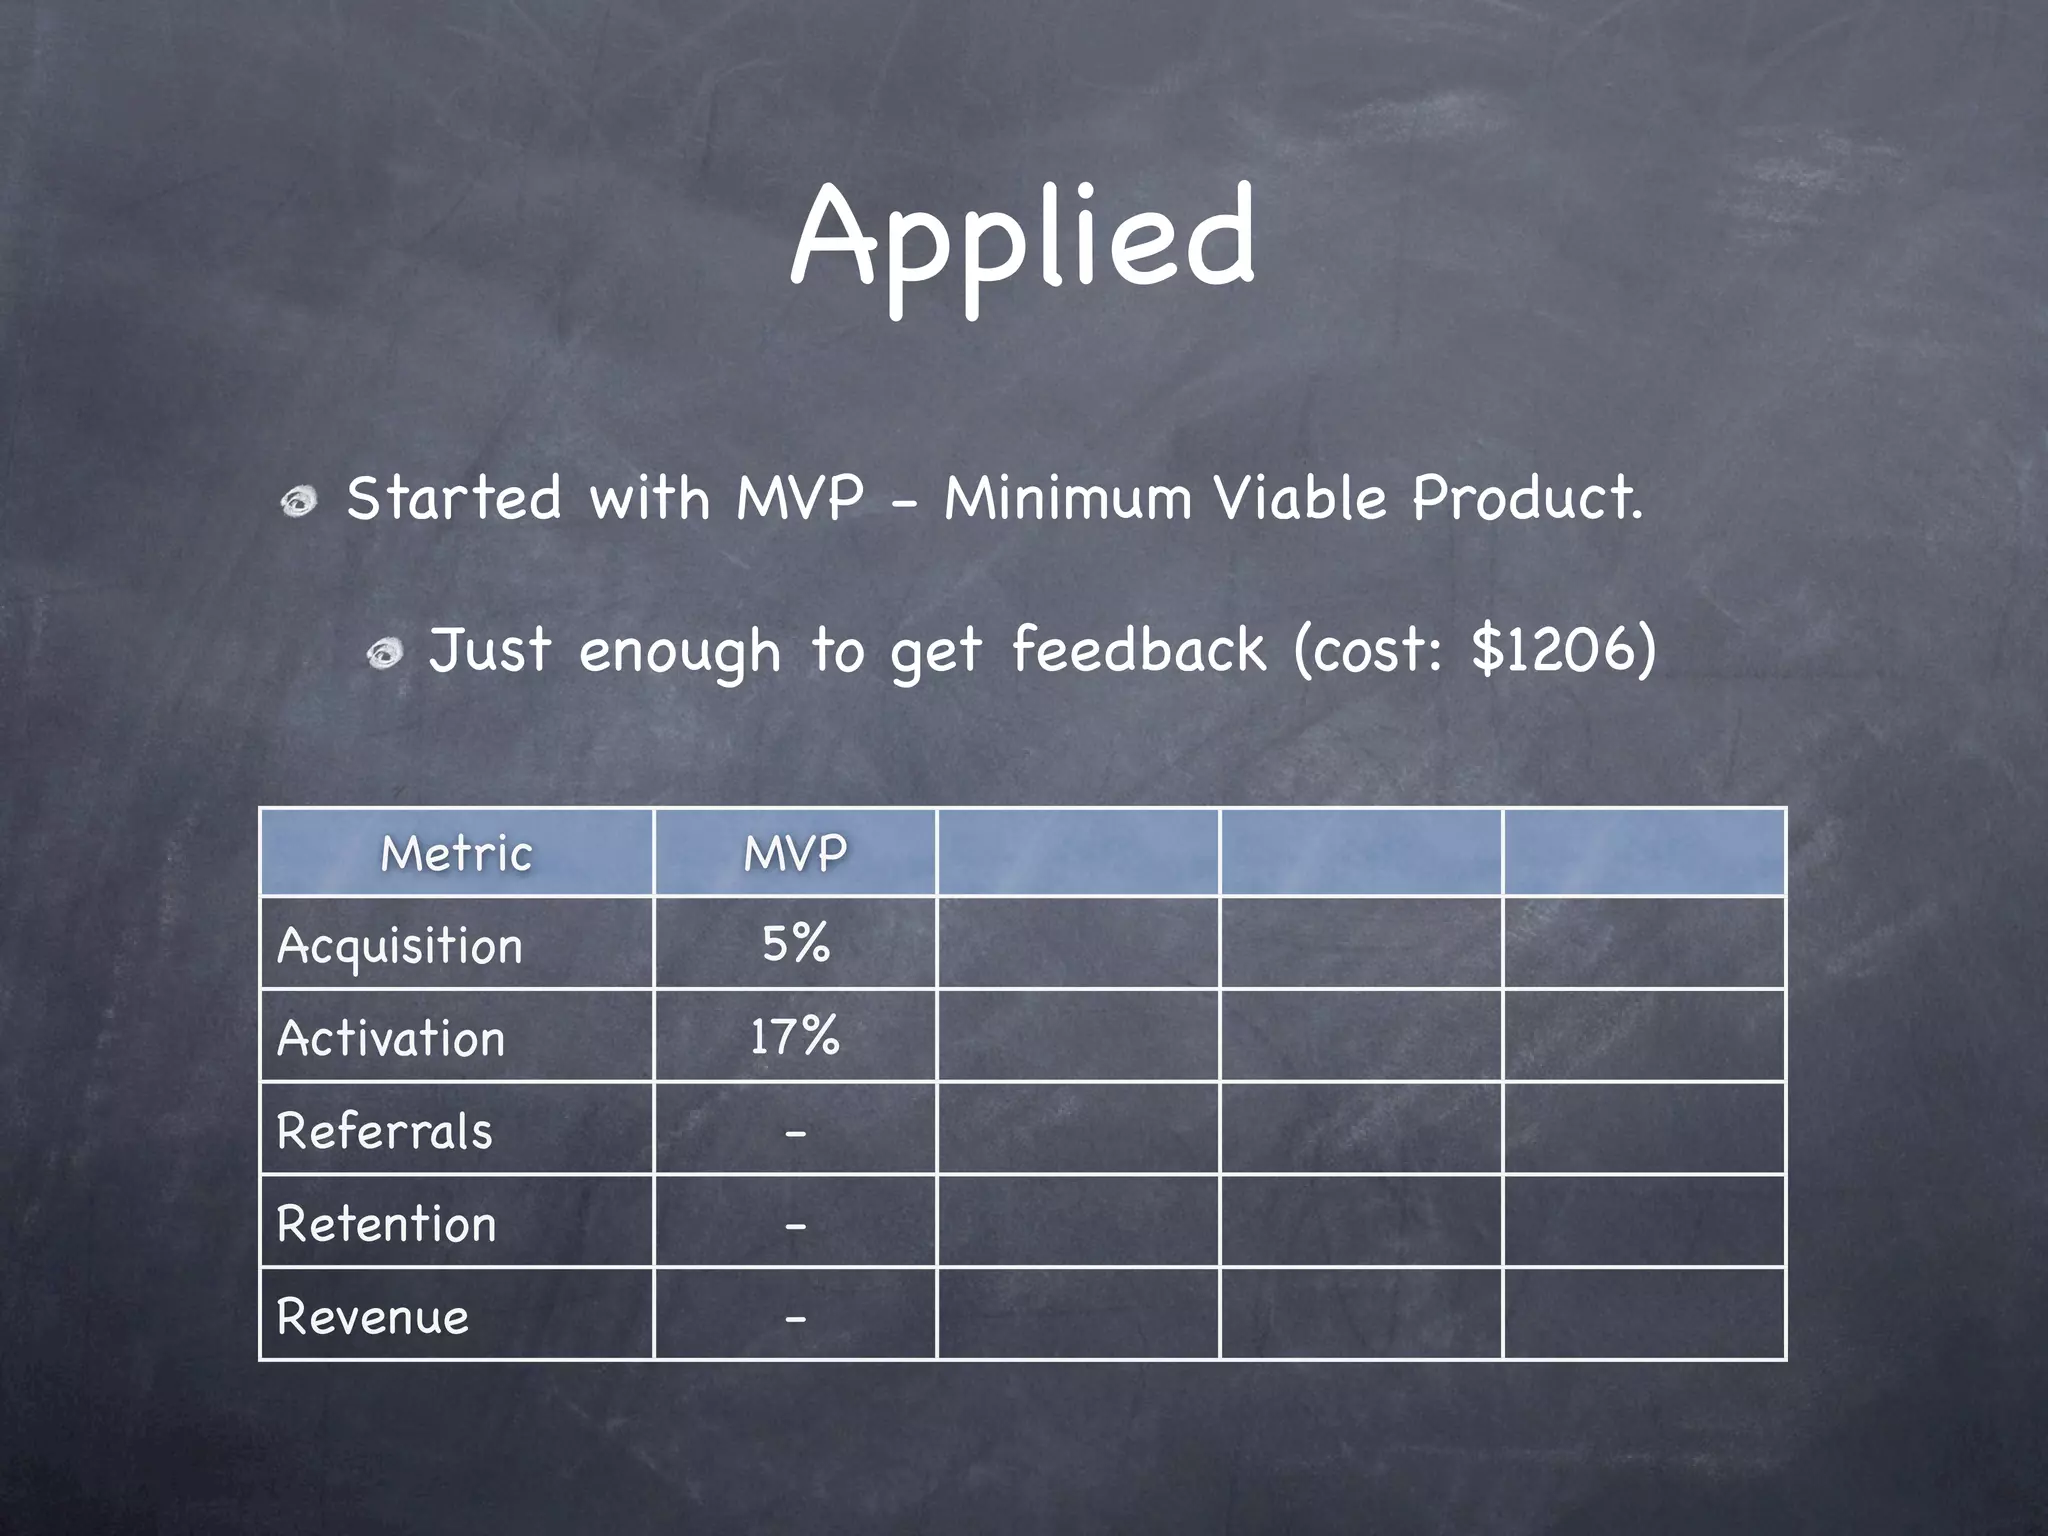
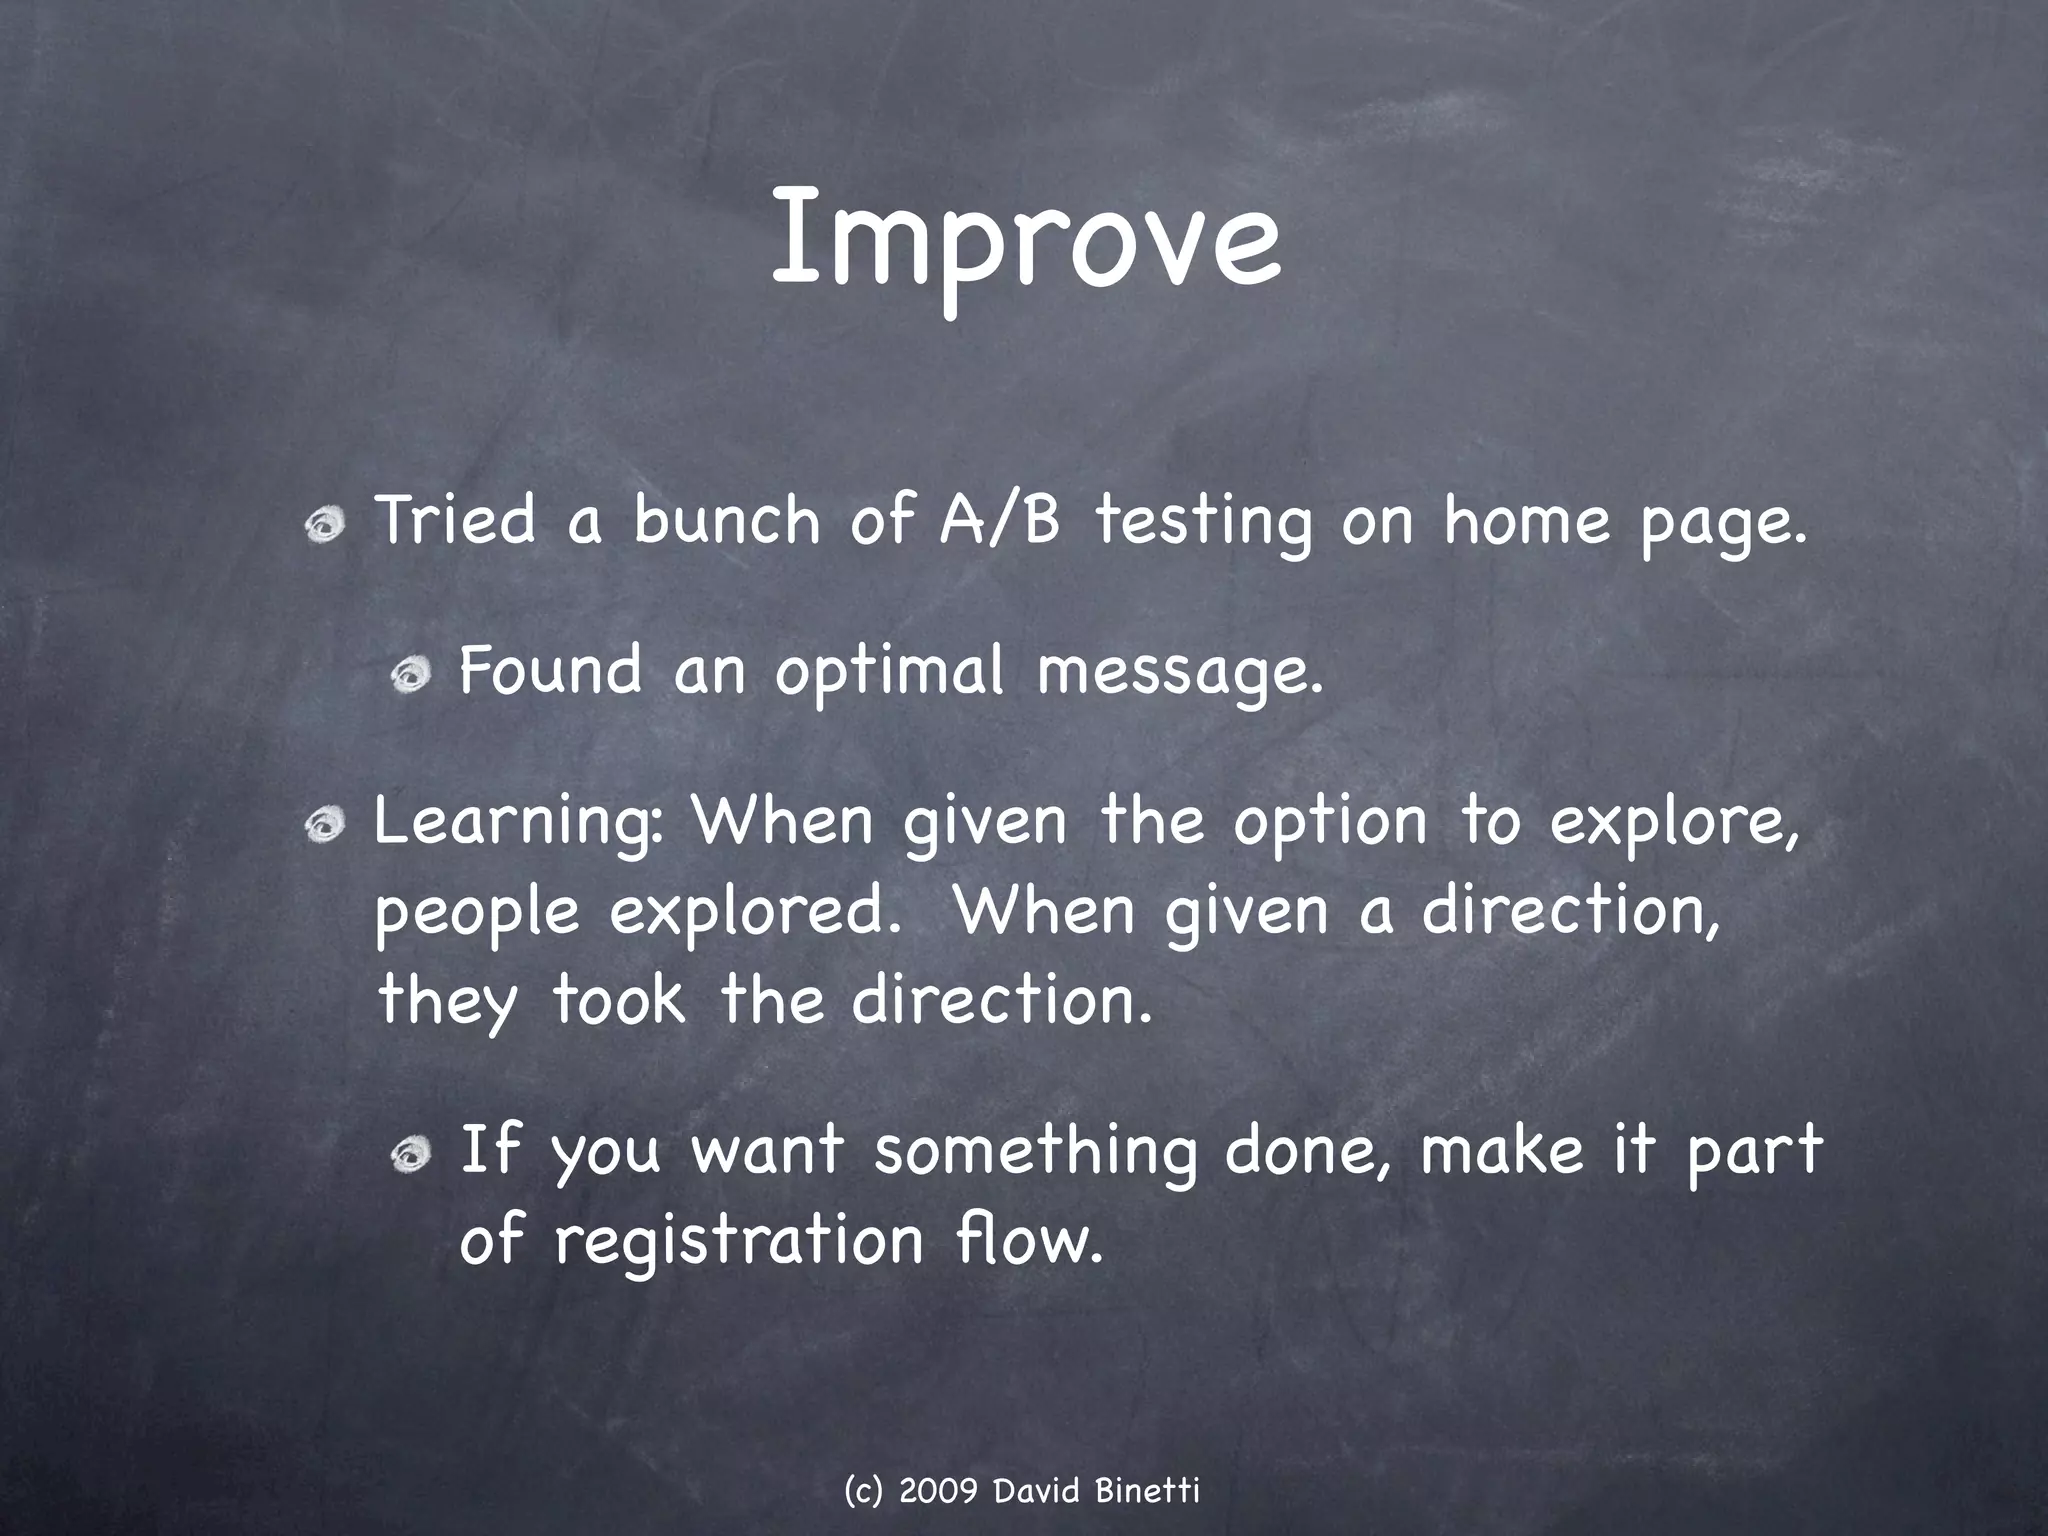
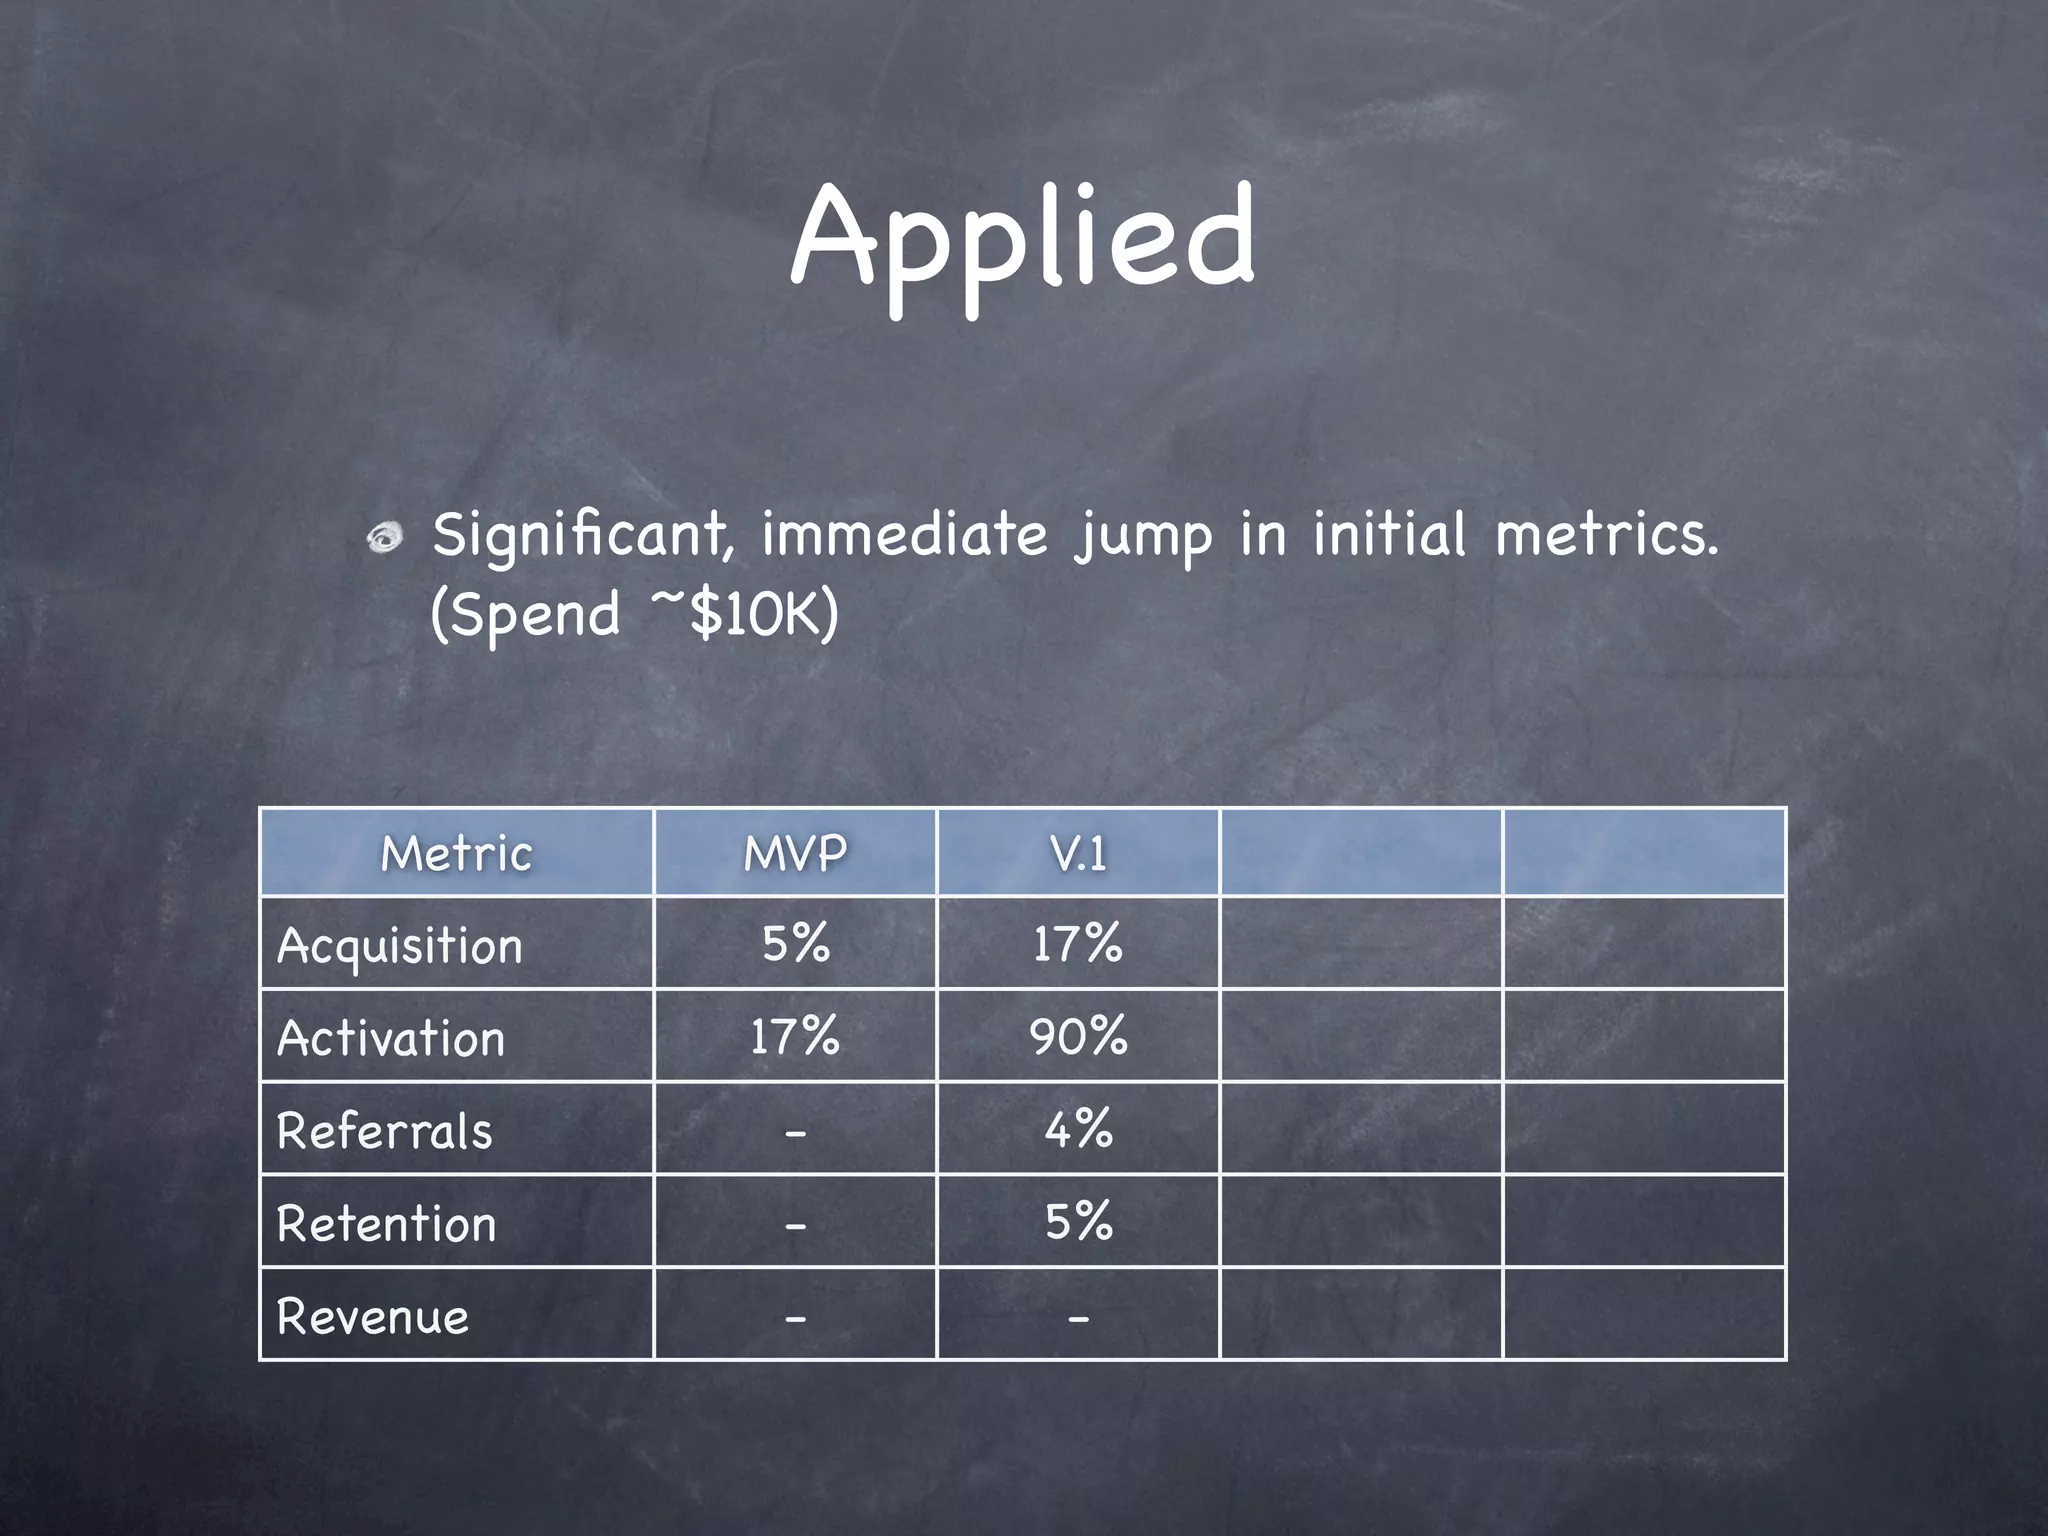
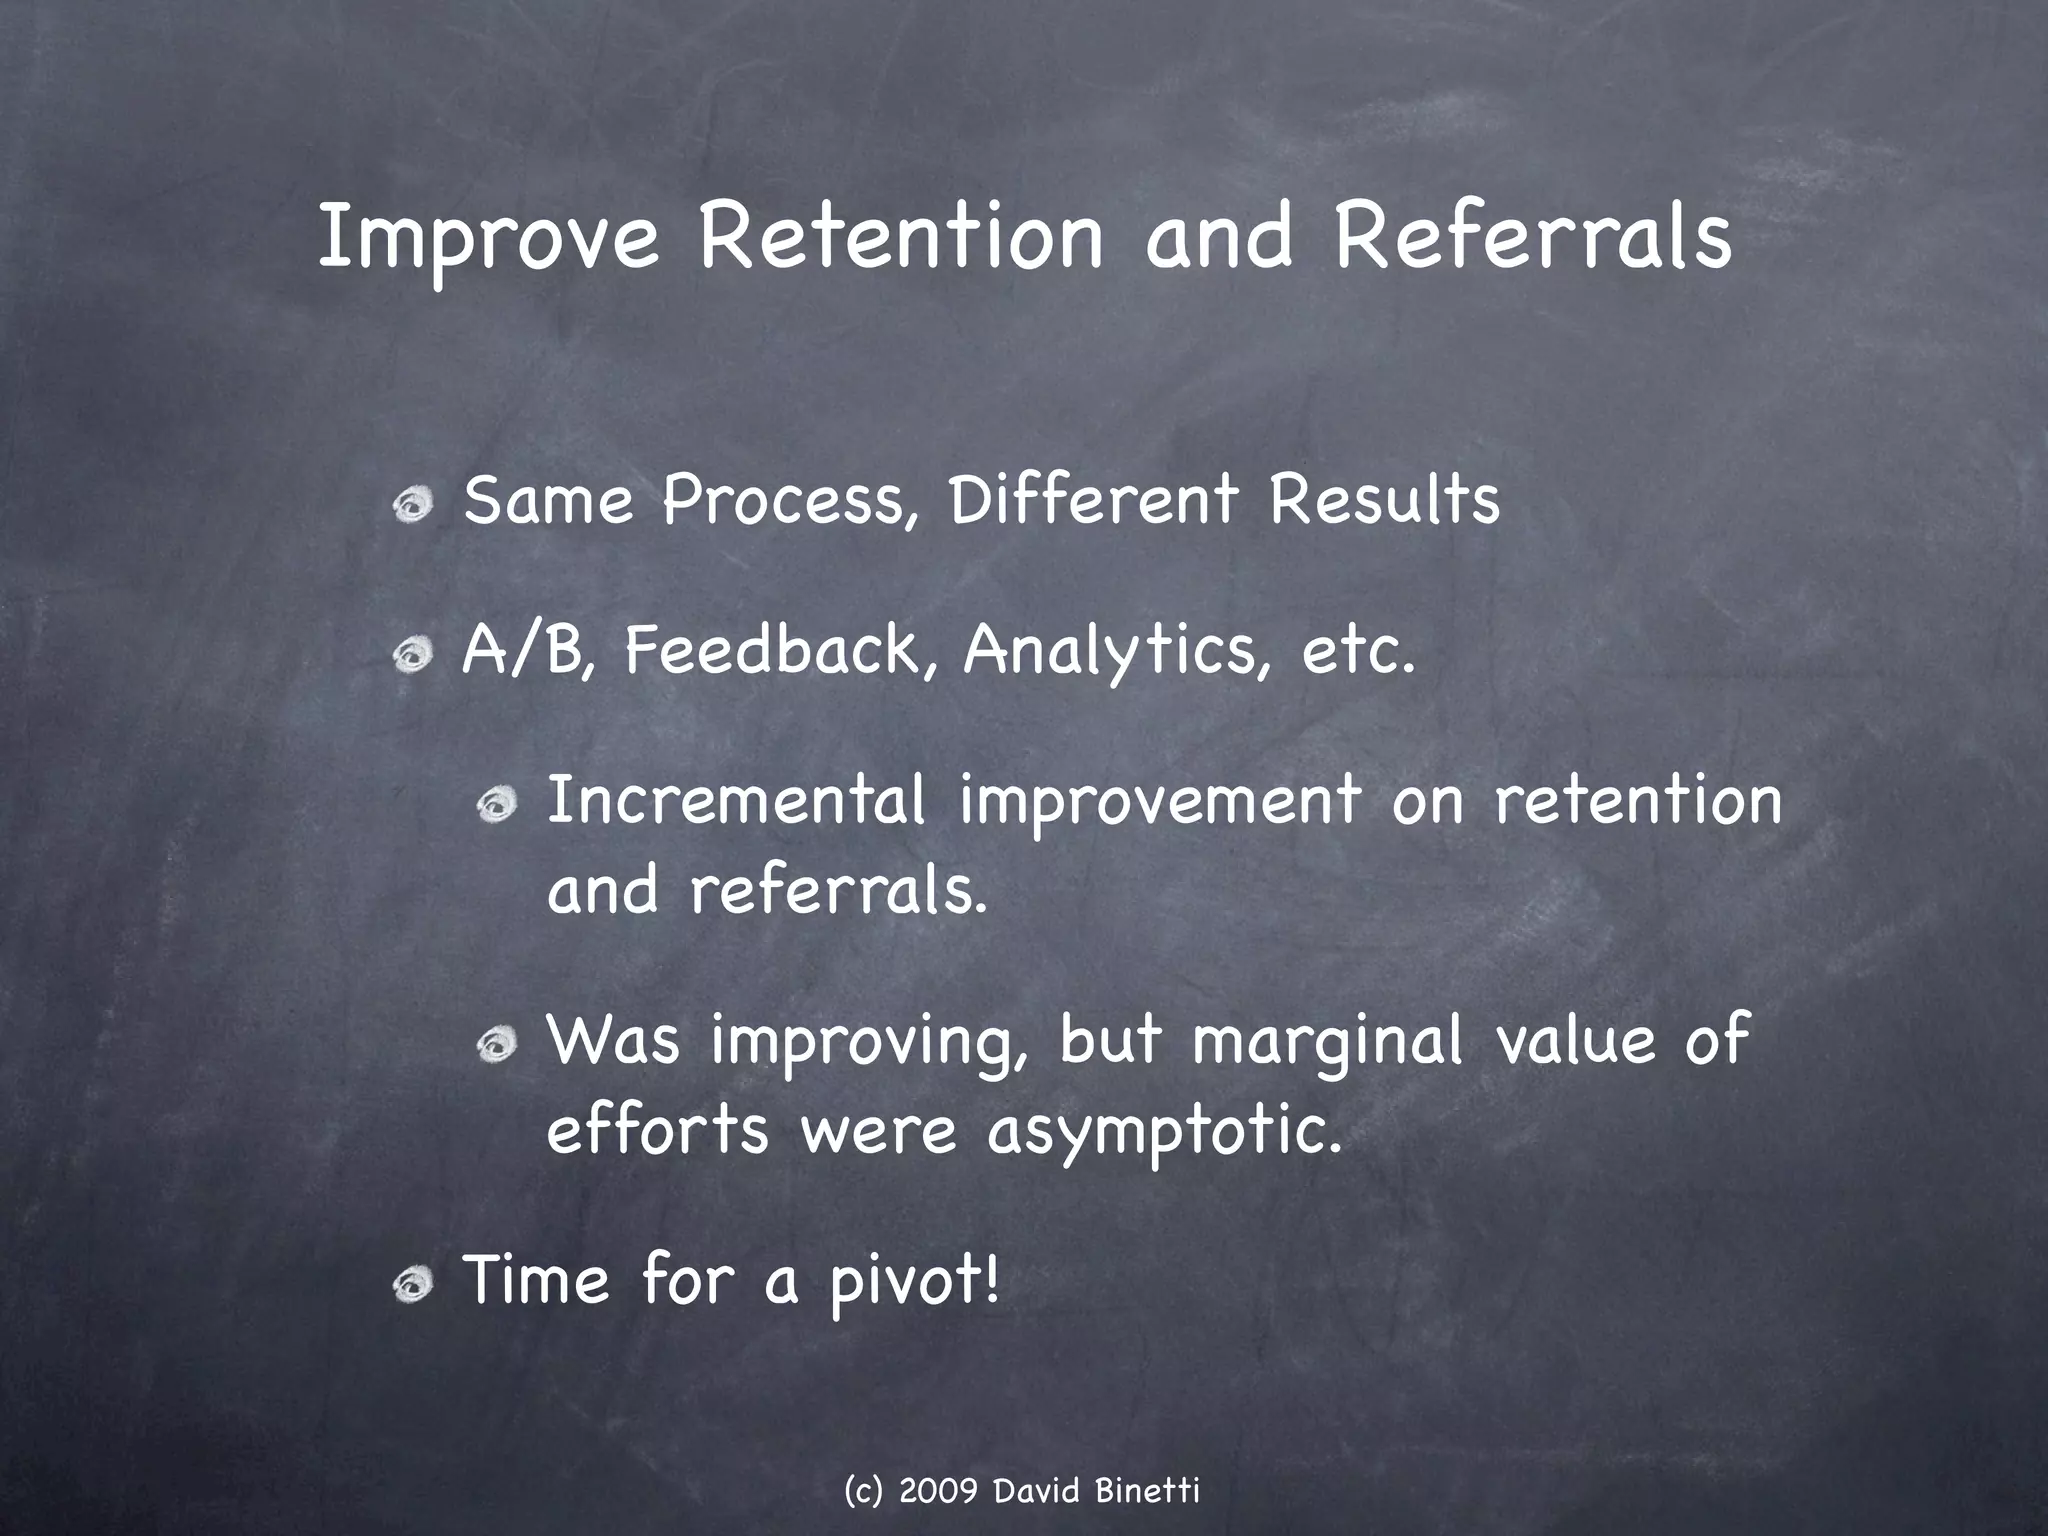
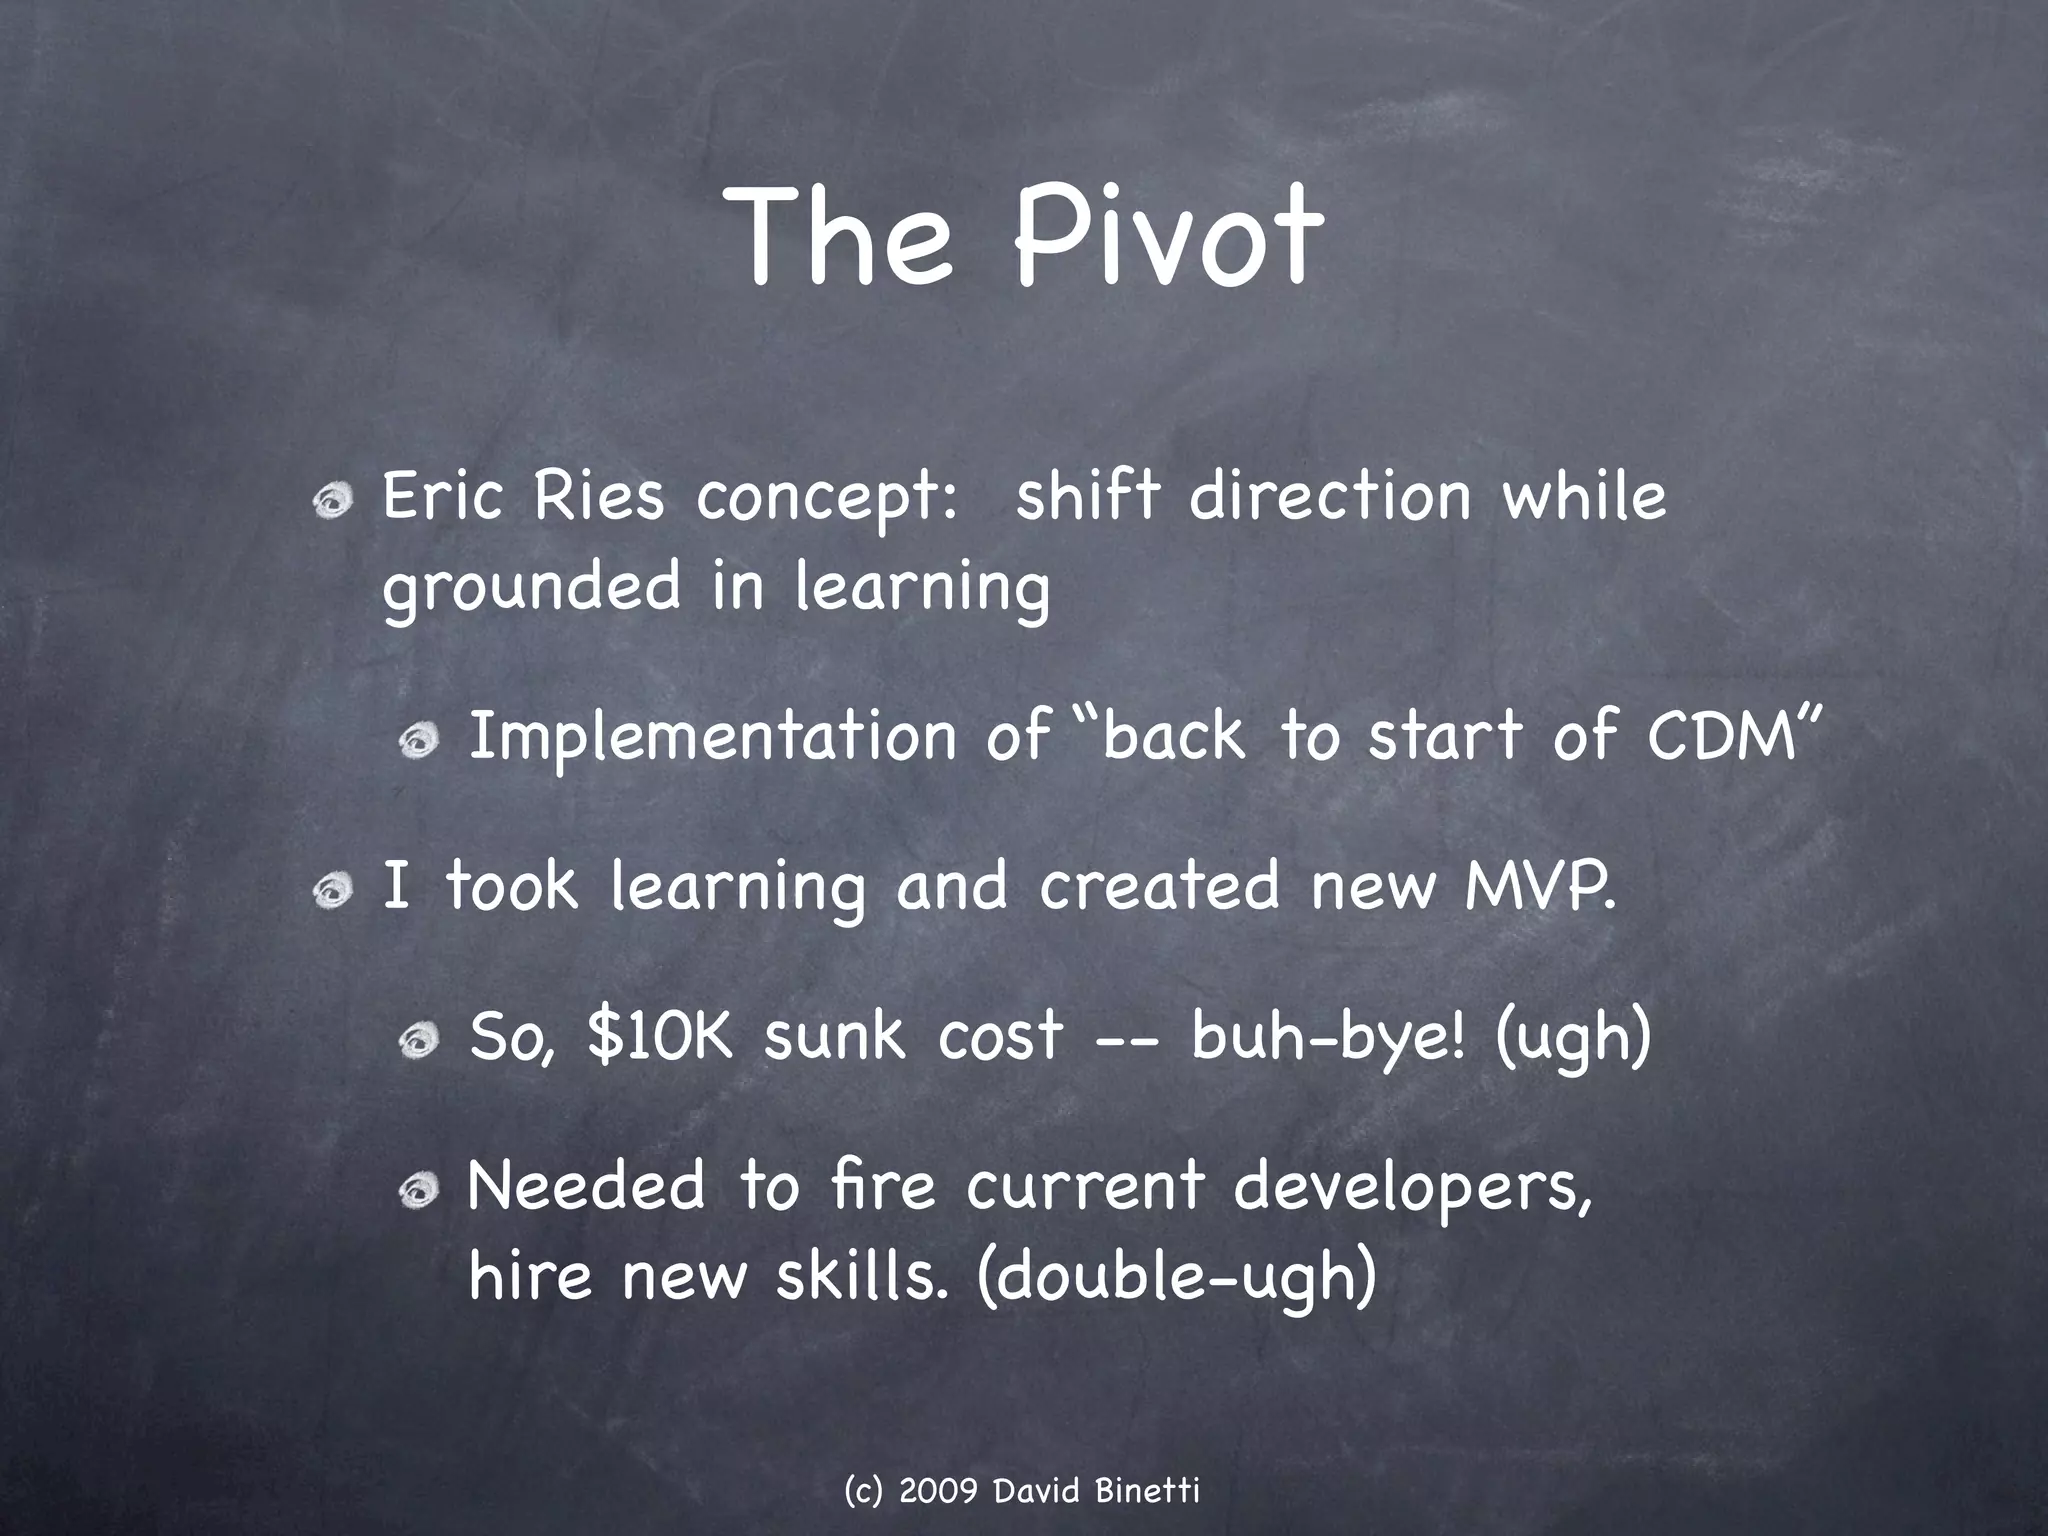
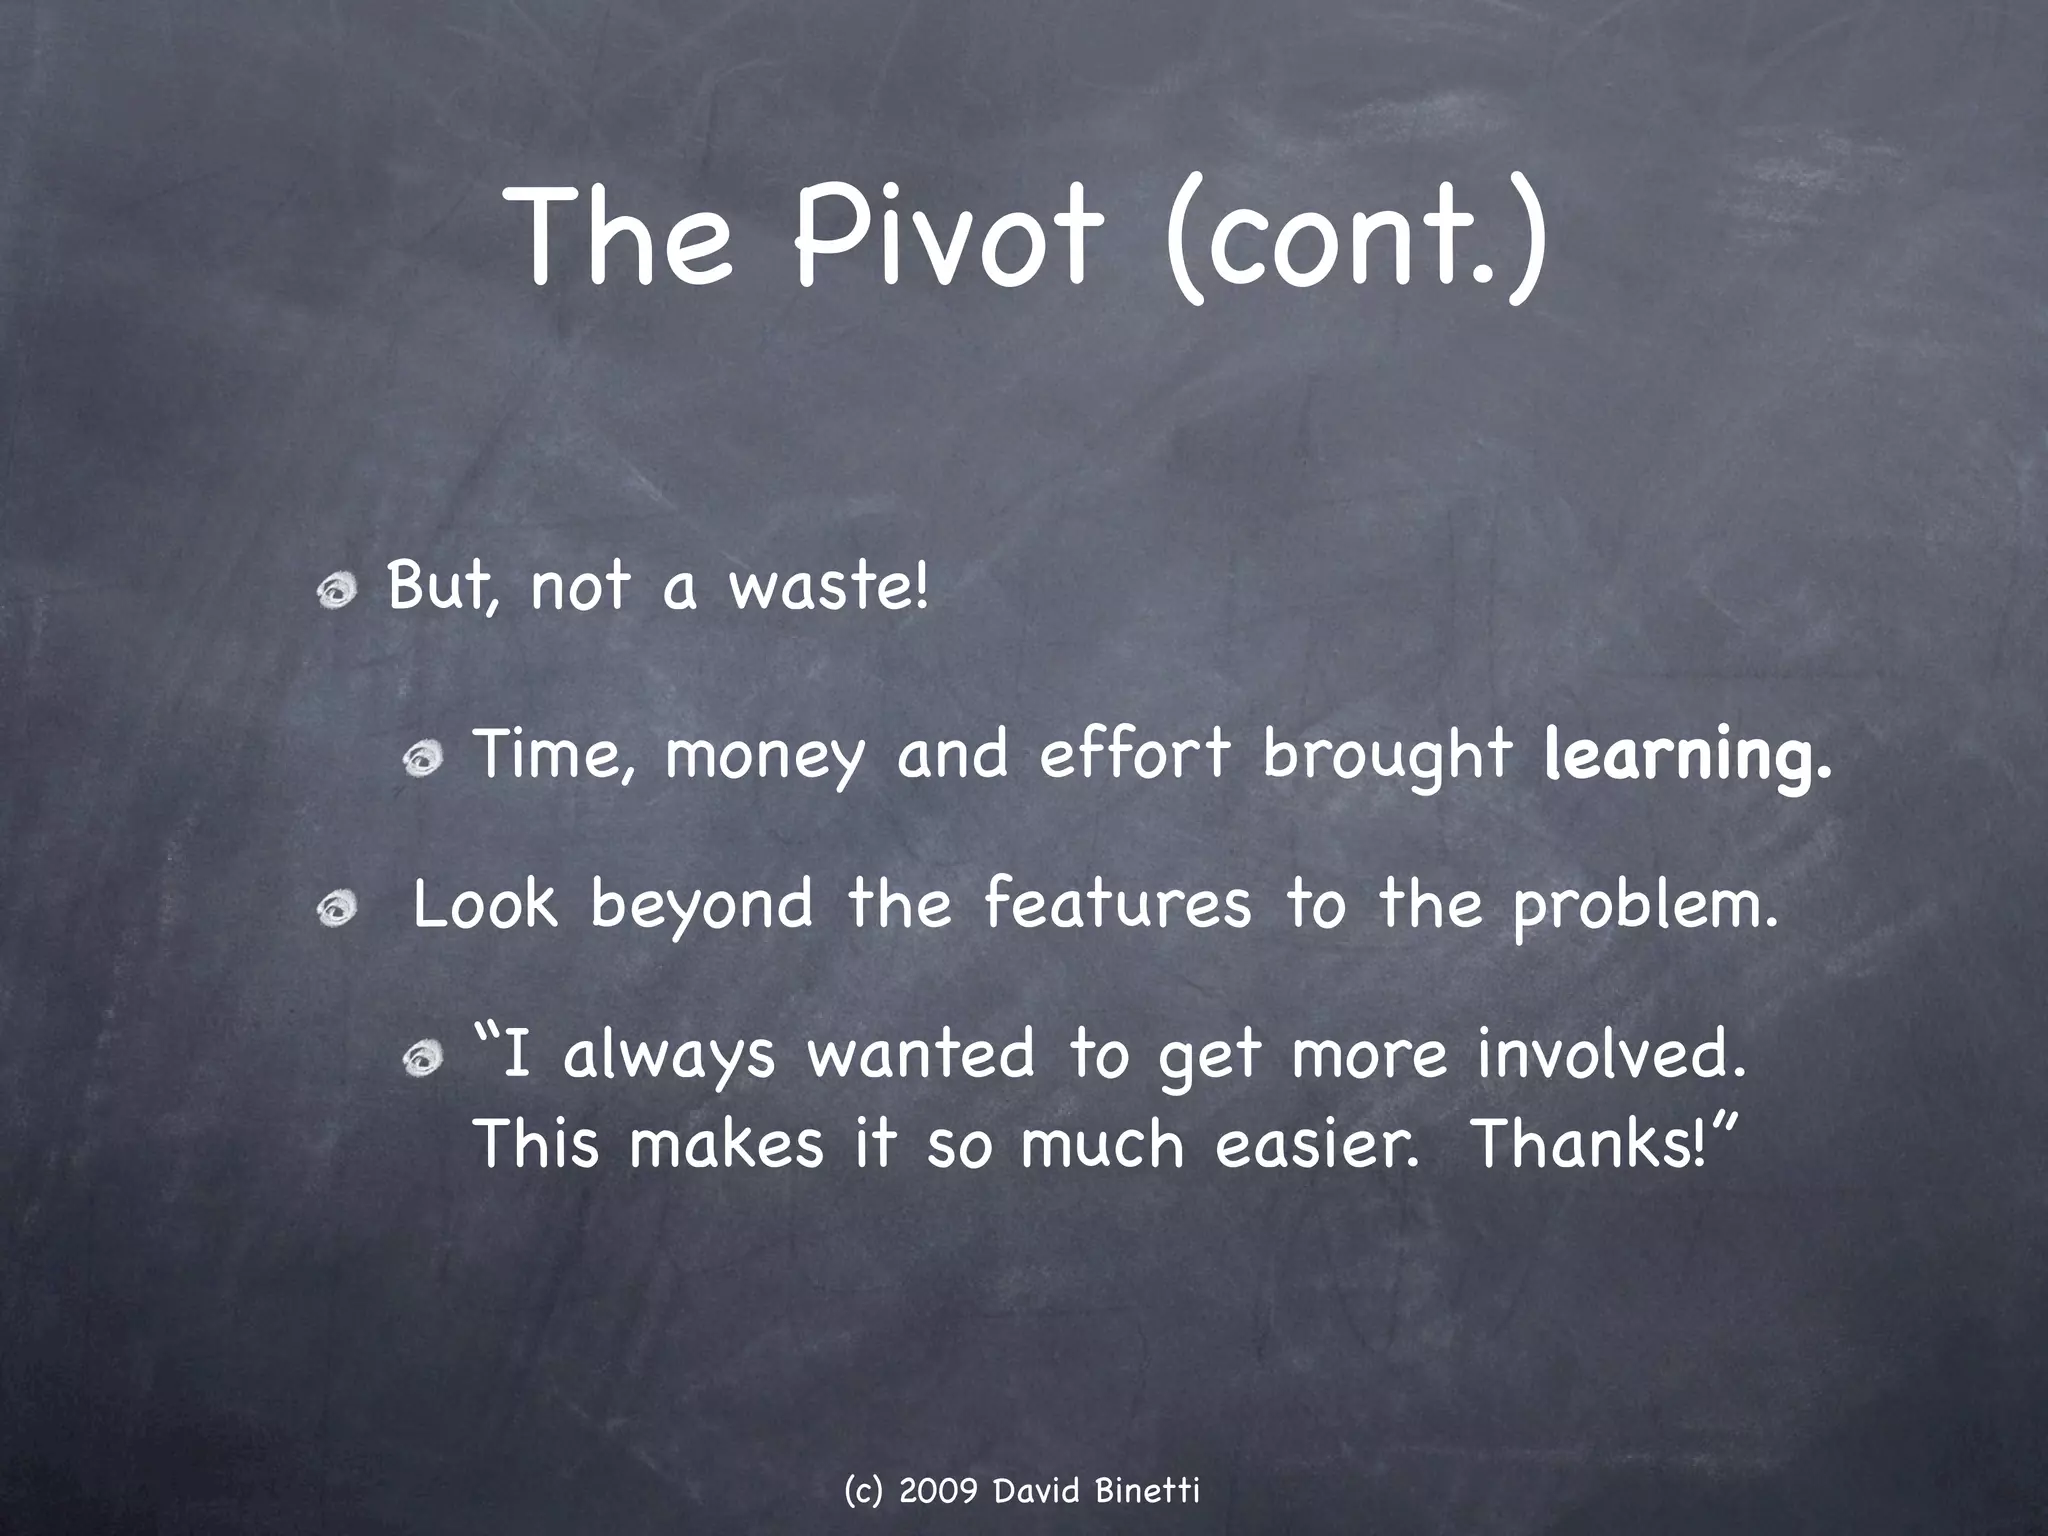
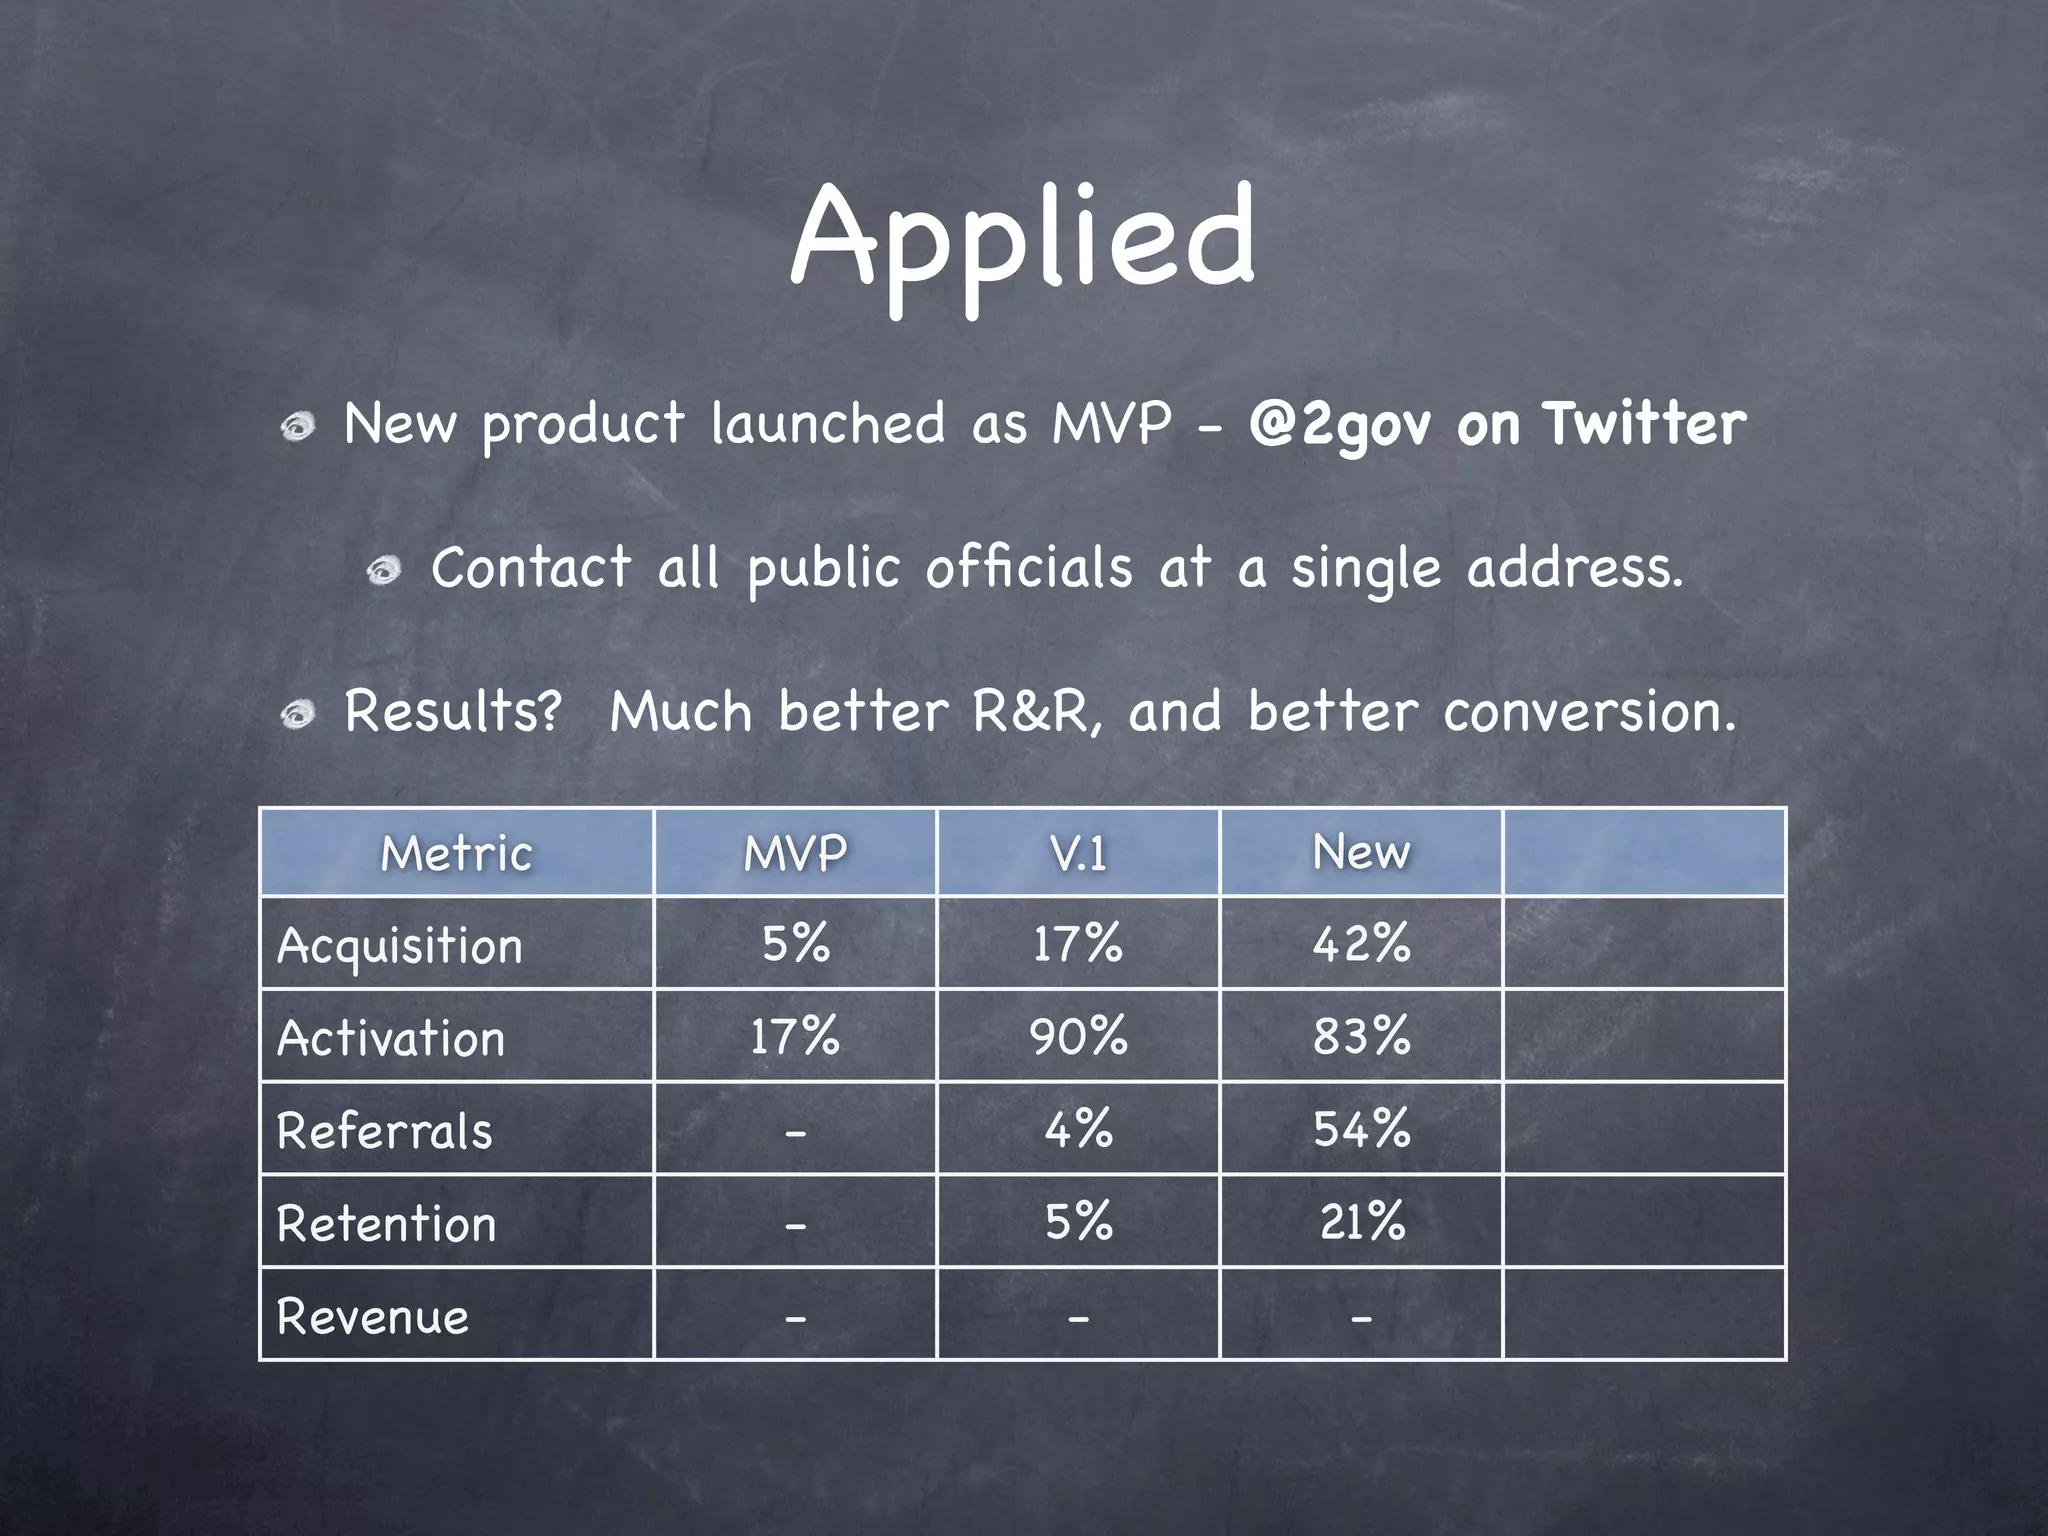
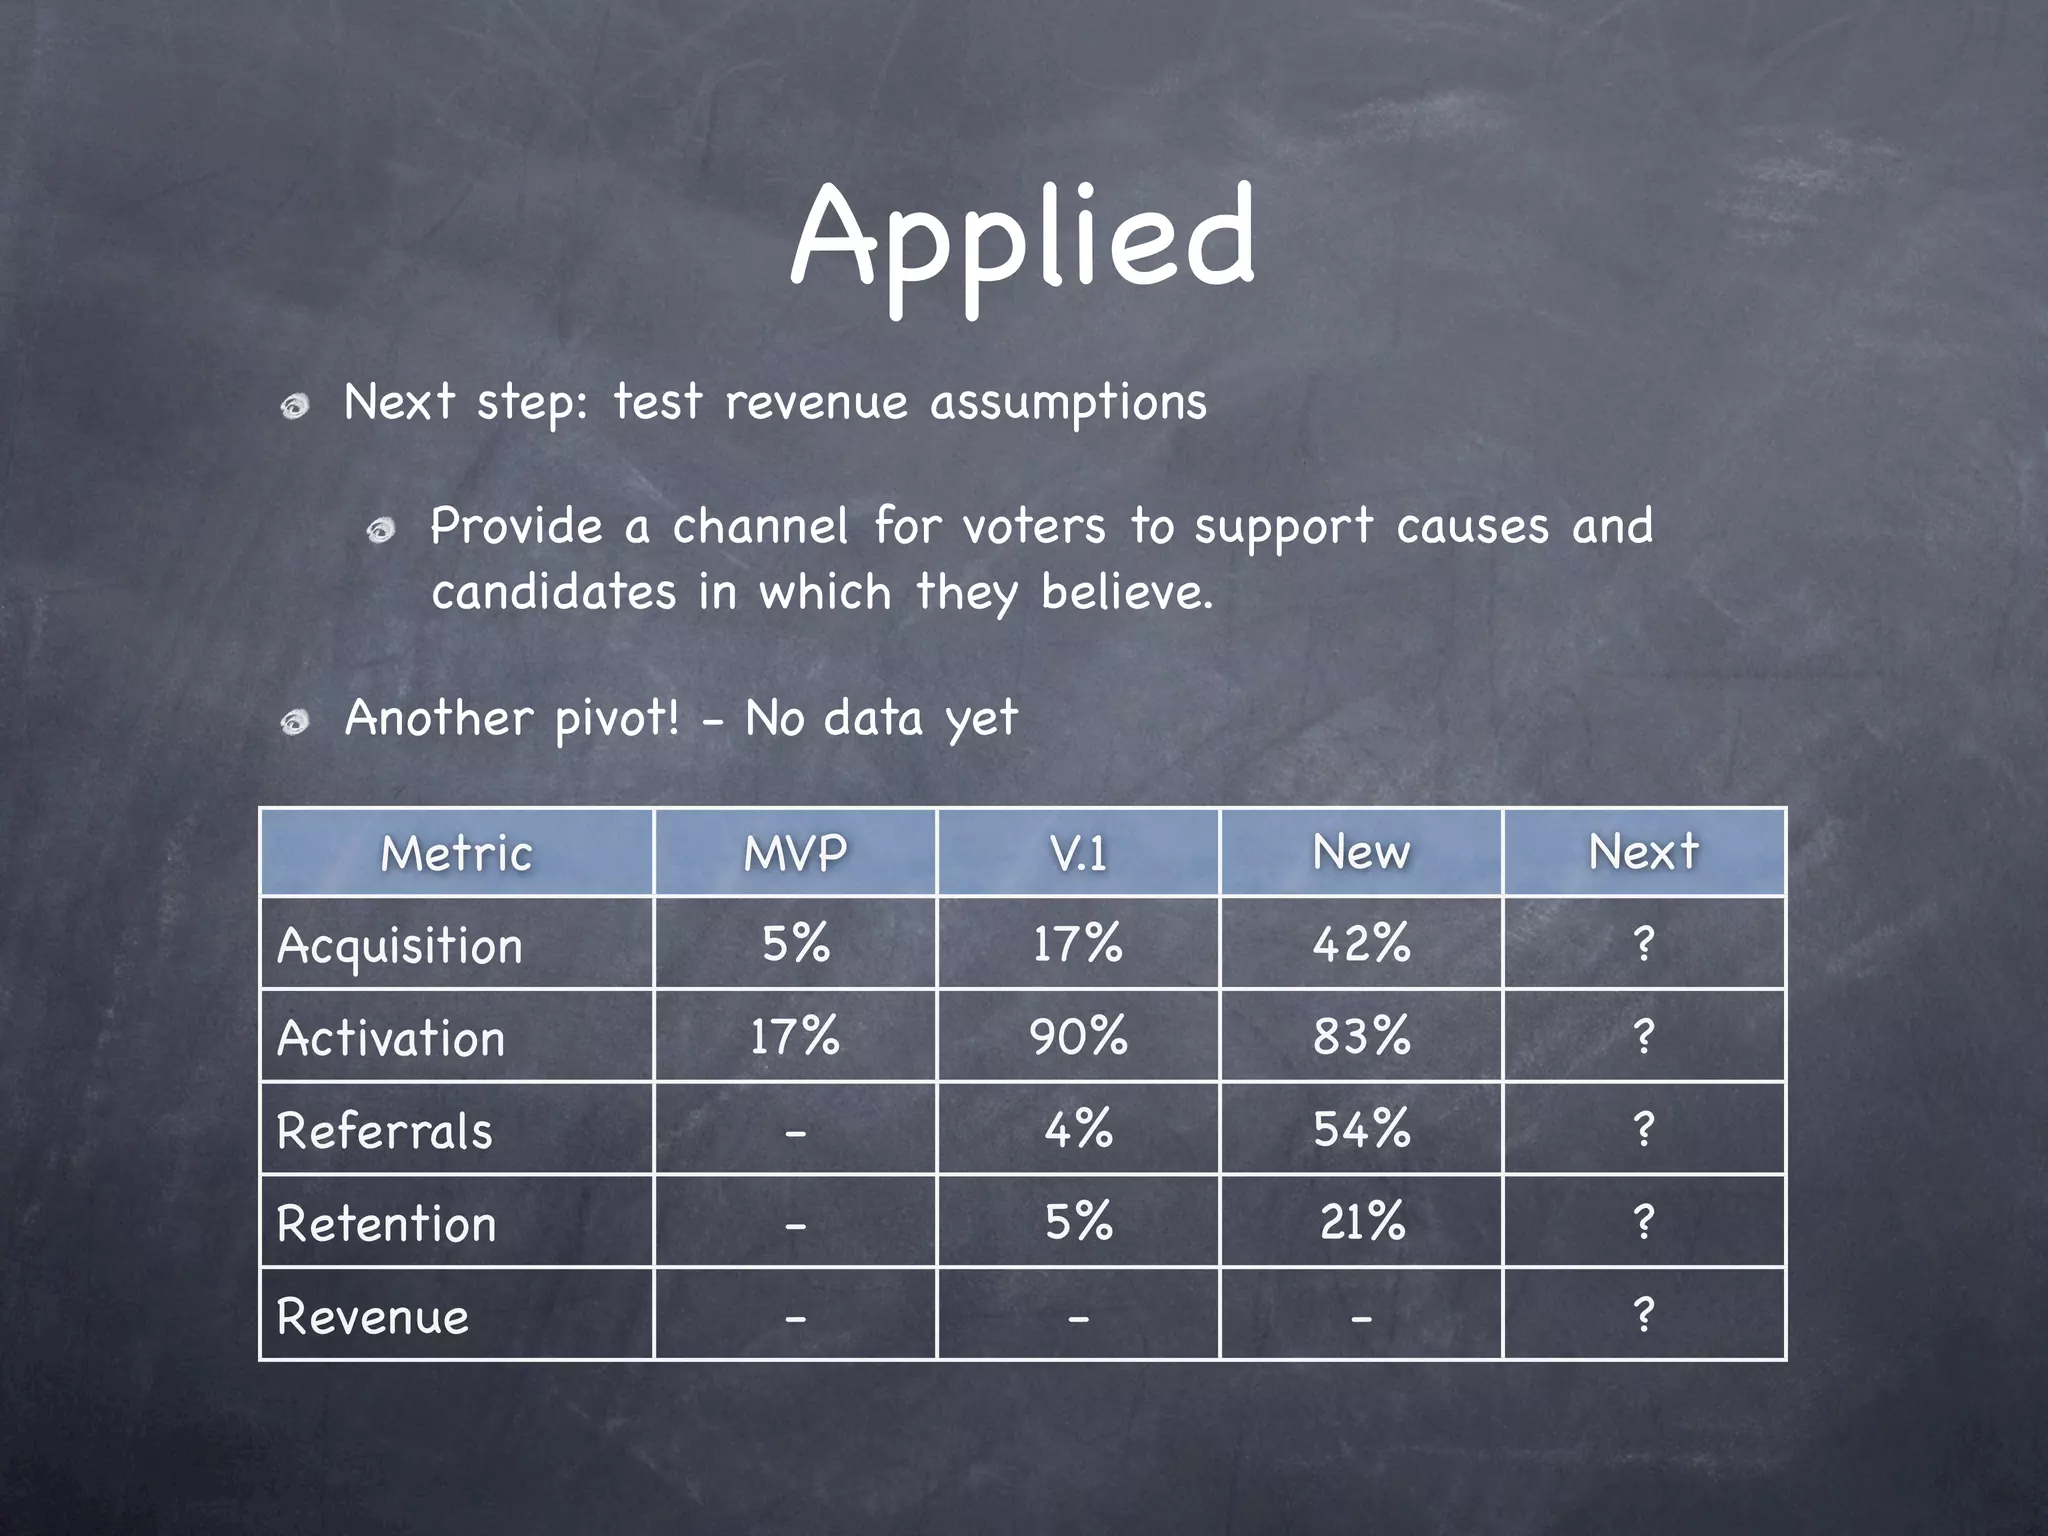
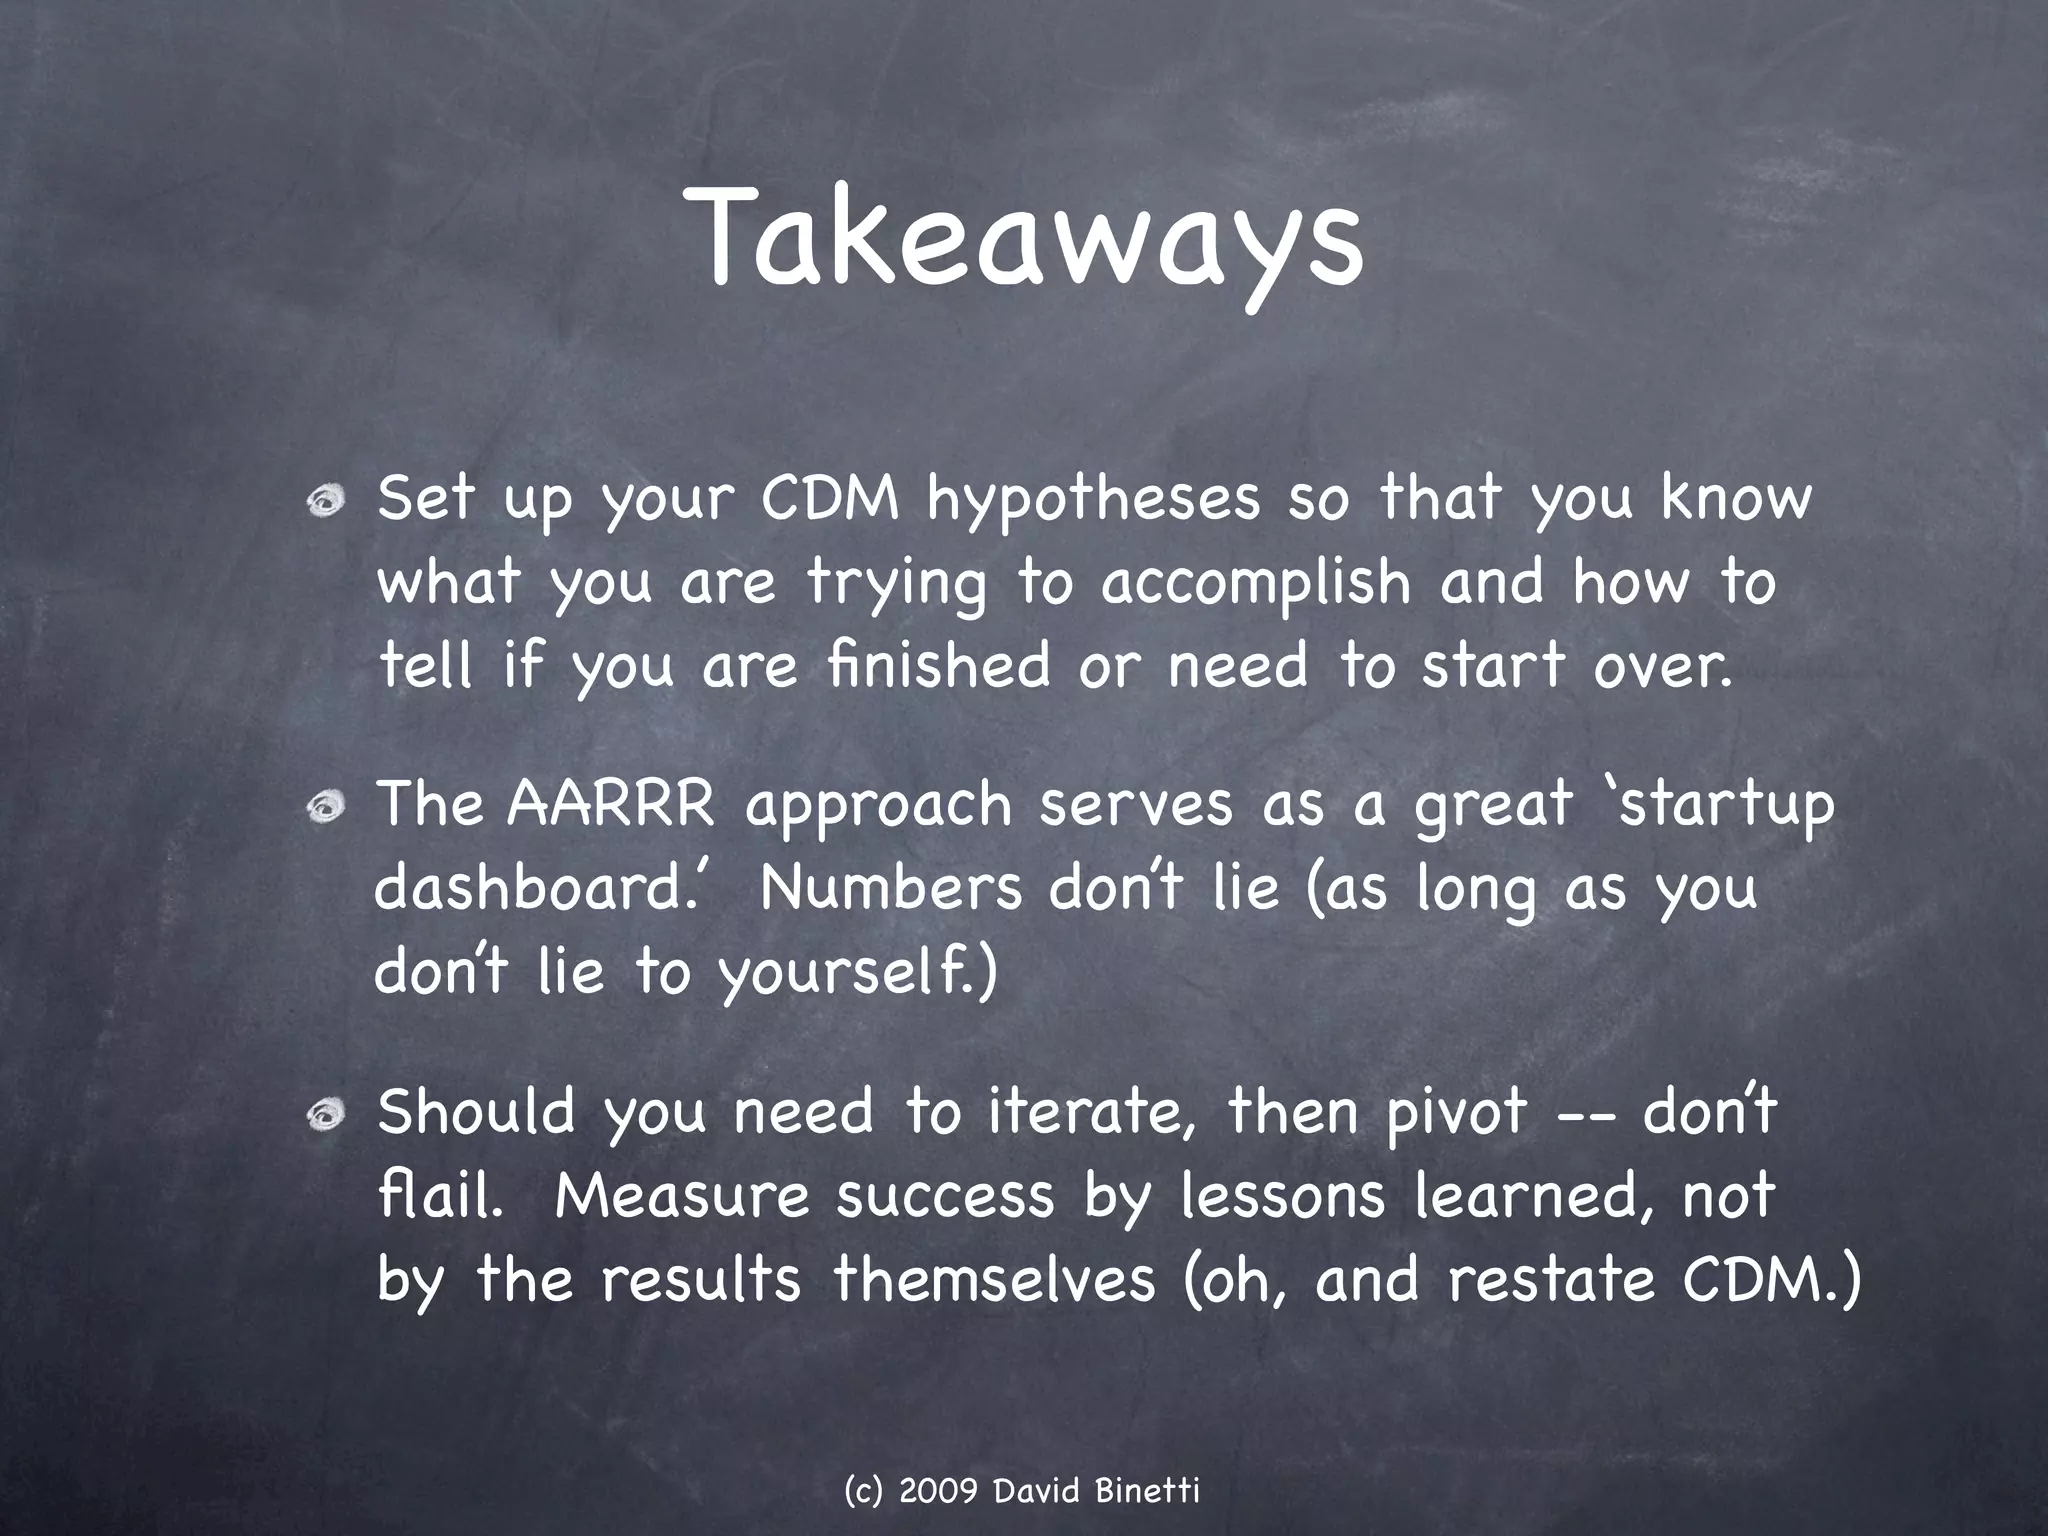

The document discusses David Binetti's application of customer development model (CDM), AARRR metrics, and lean principles in the context of a case study on Votizen, a social network for registered voters. It emphasizes the importance of testing hypotheses, measuring acquisition and retention metrics, and pivoting based on learnings. The key takeaway is to set up hypotheses to guide the development process and to use metrics for assessing progress and making informed decisions.


![Elements of a Modern Demand Generation Plan by Adam Needles]](https://cdn.slidesharecdn.com/ss_thumbnails/elementsofamoderndemandgenerationplanadamneedles110228181715phpapp021-12992623047014-phpapp02-thumbnail.jpg?width=640&height=640&fit=bounds)