Download as PDF, PPTX
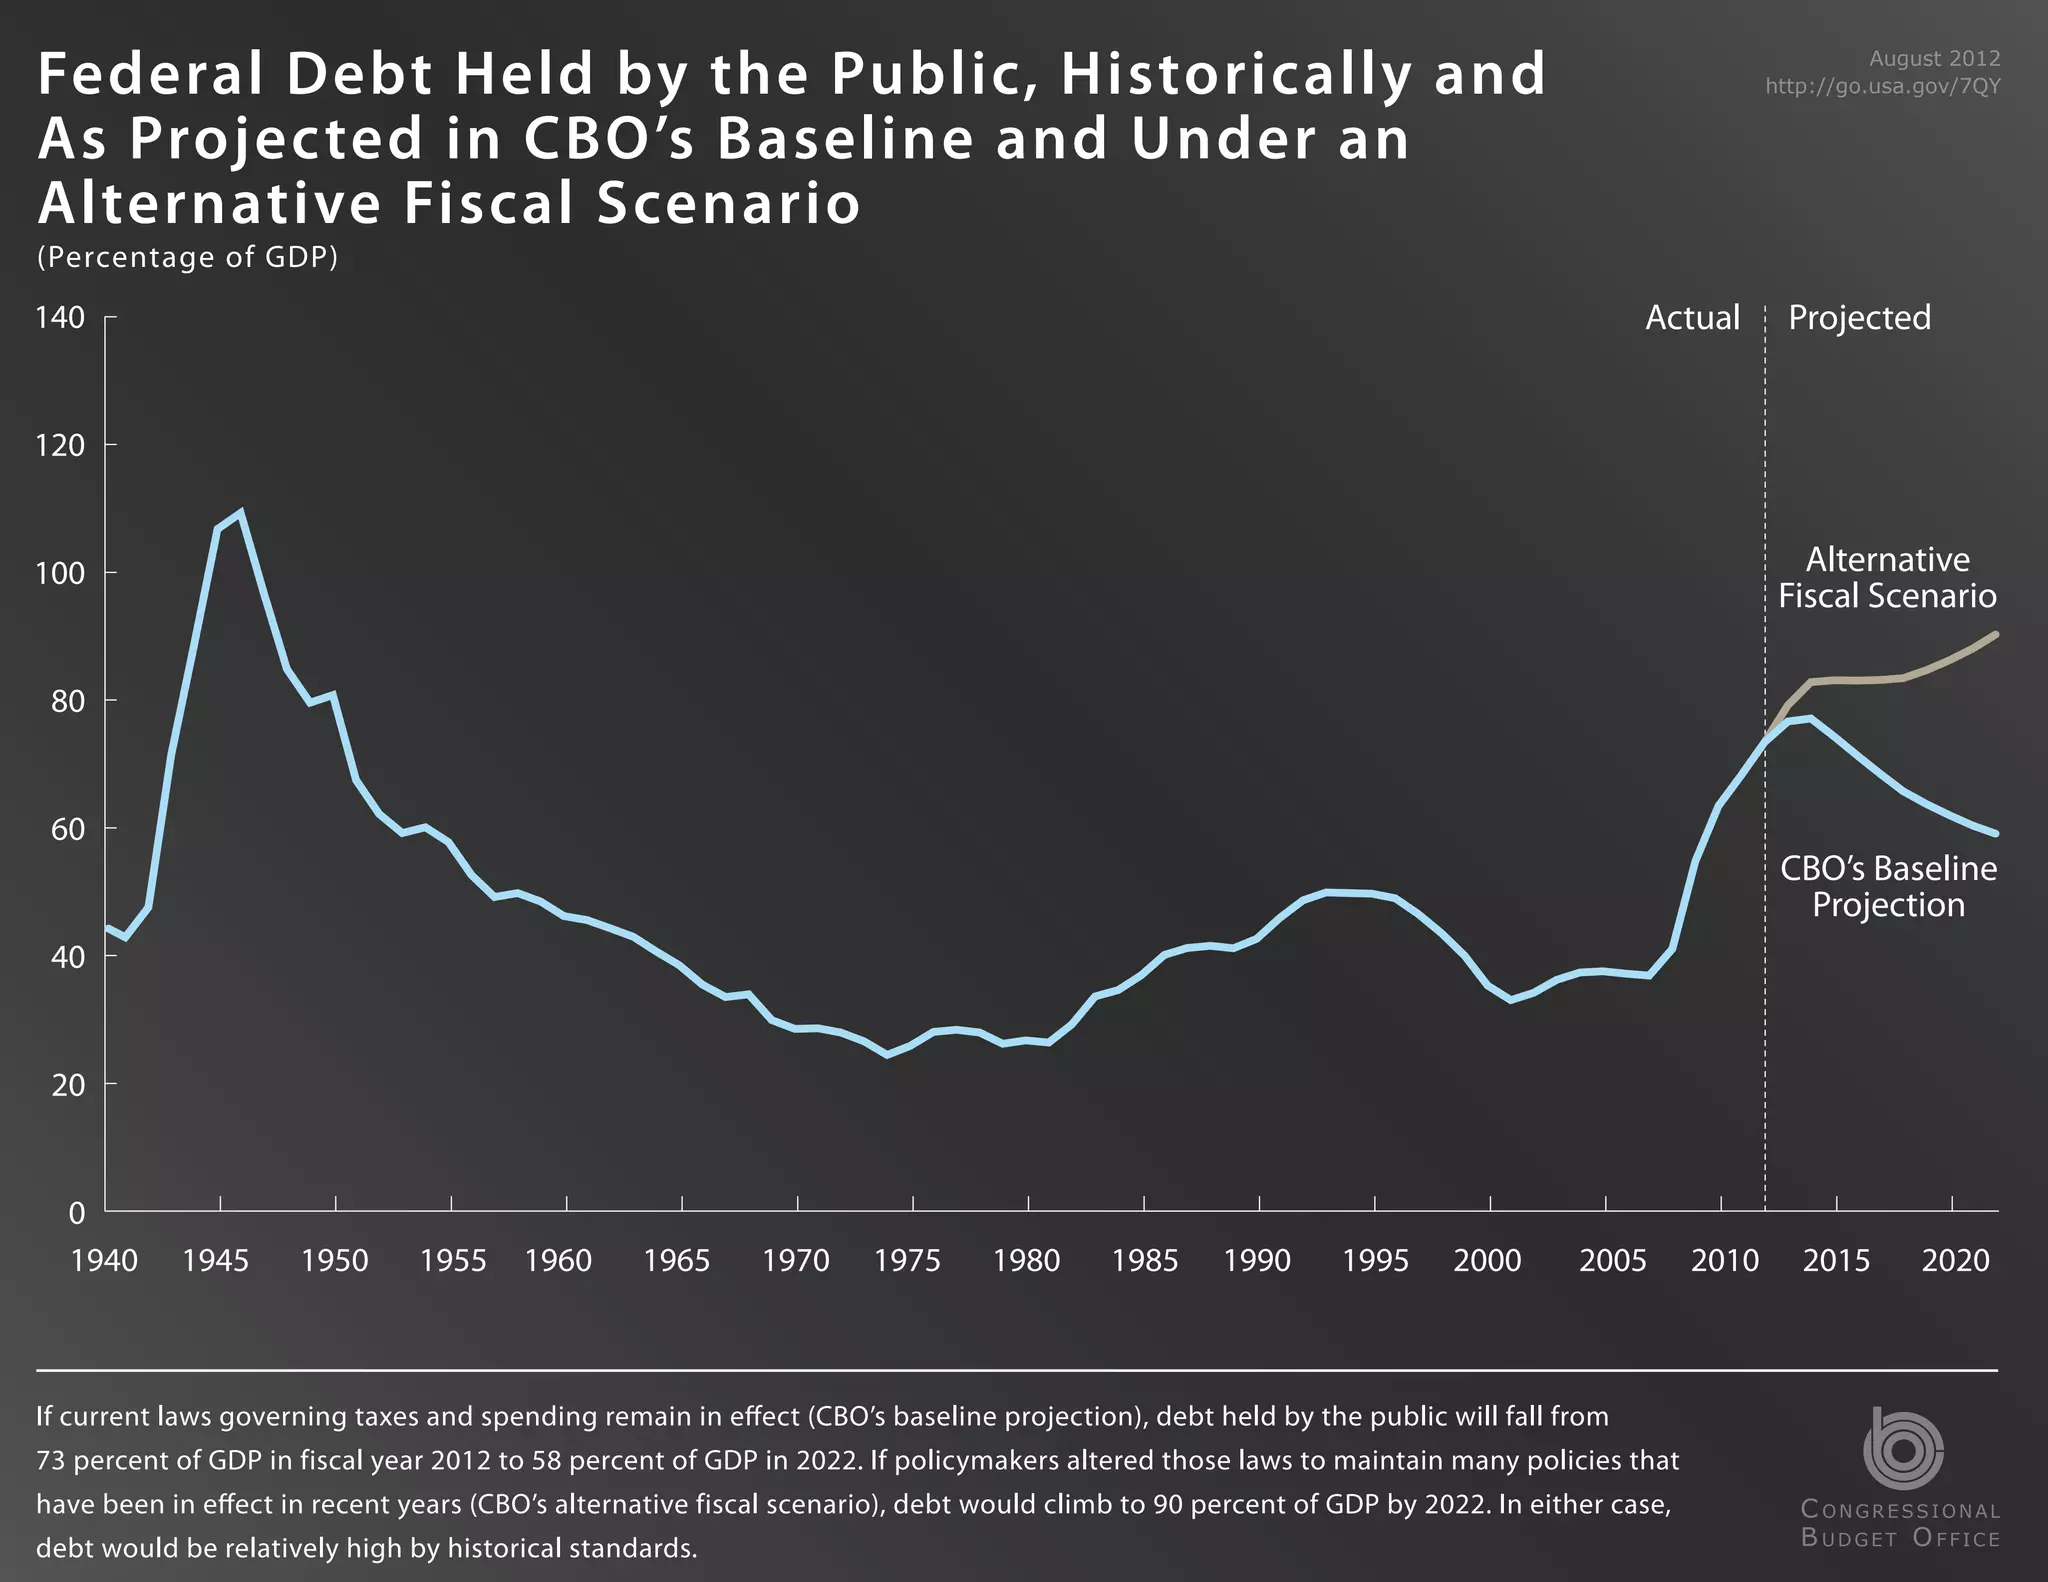
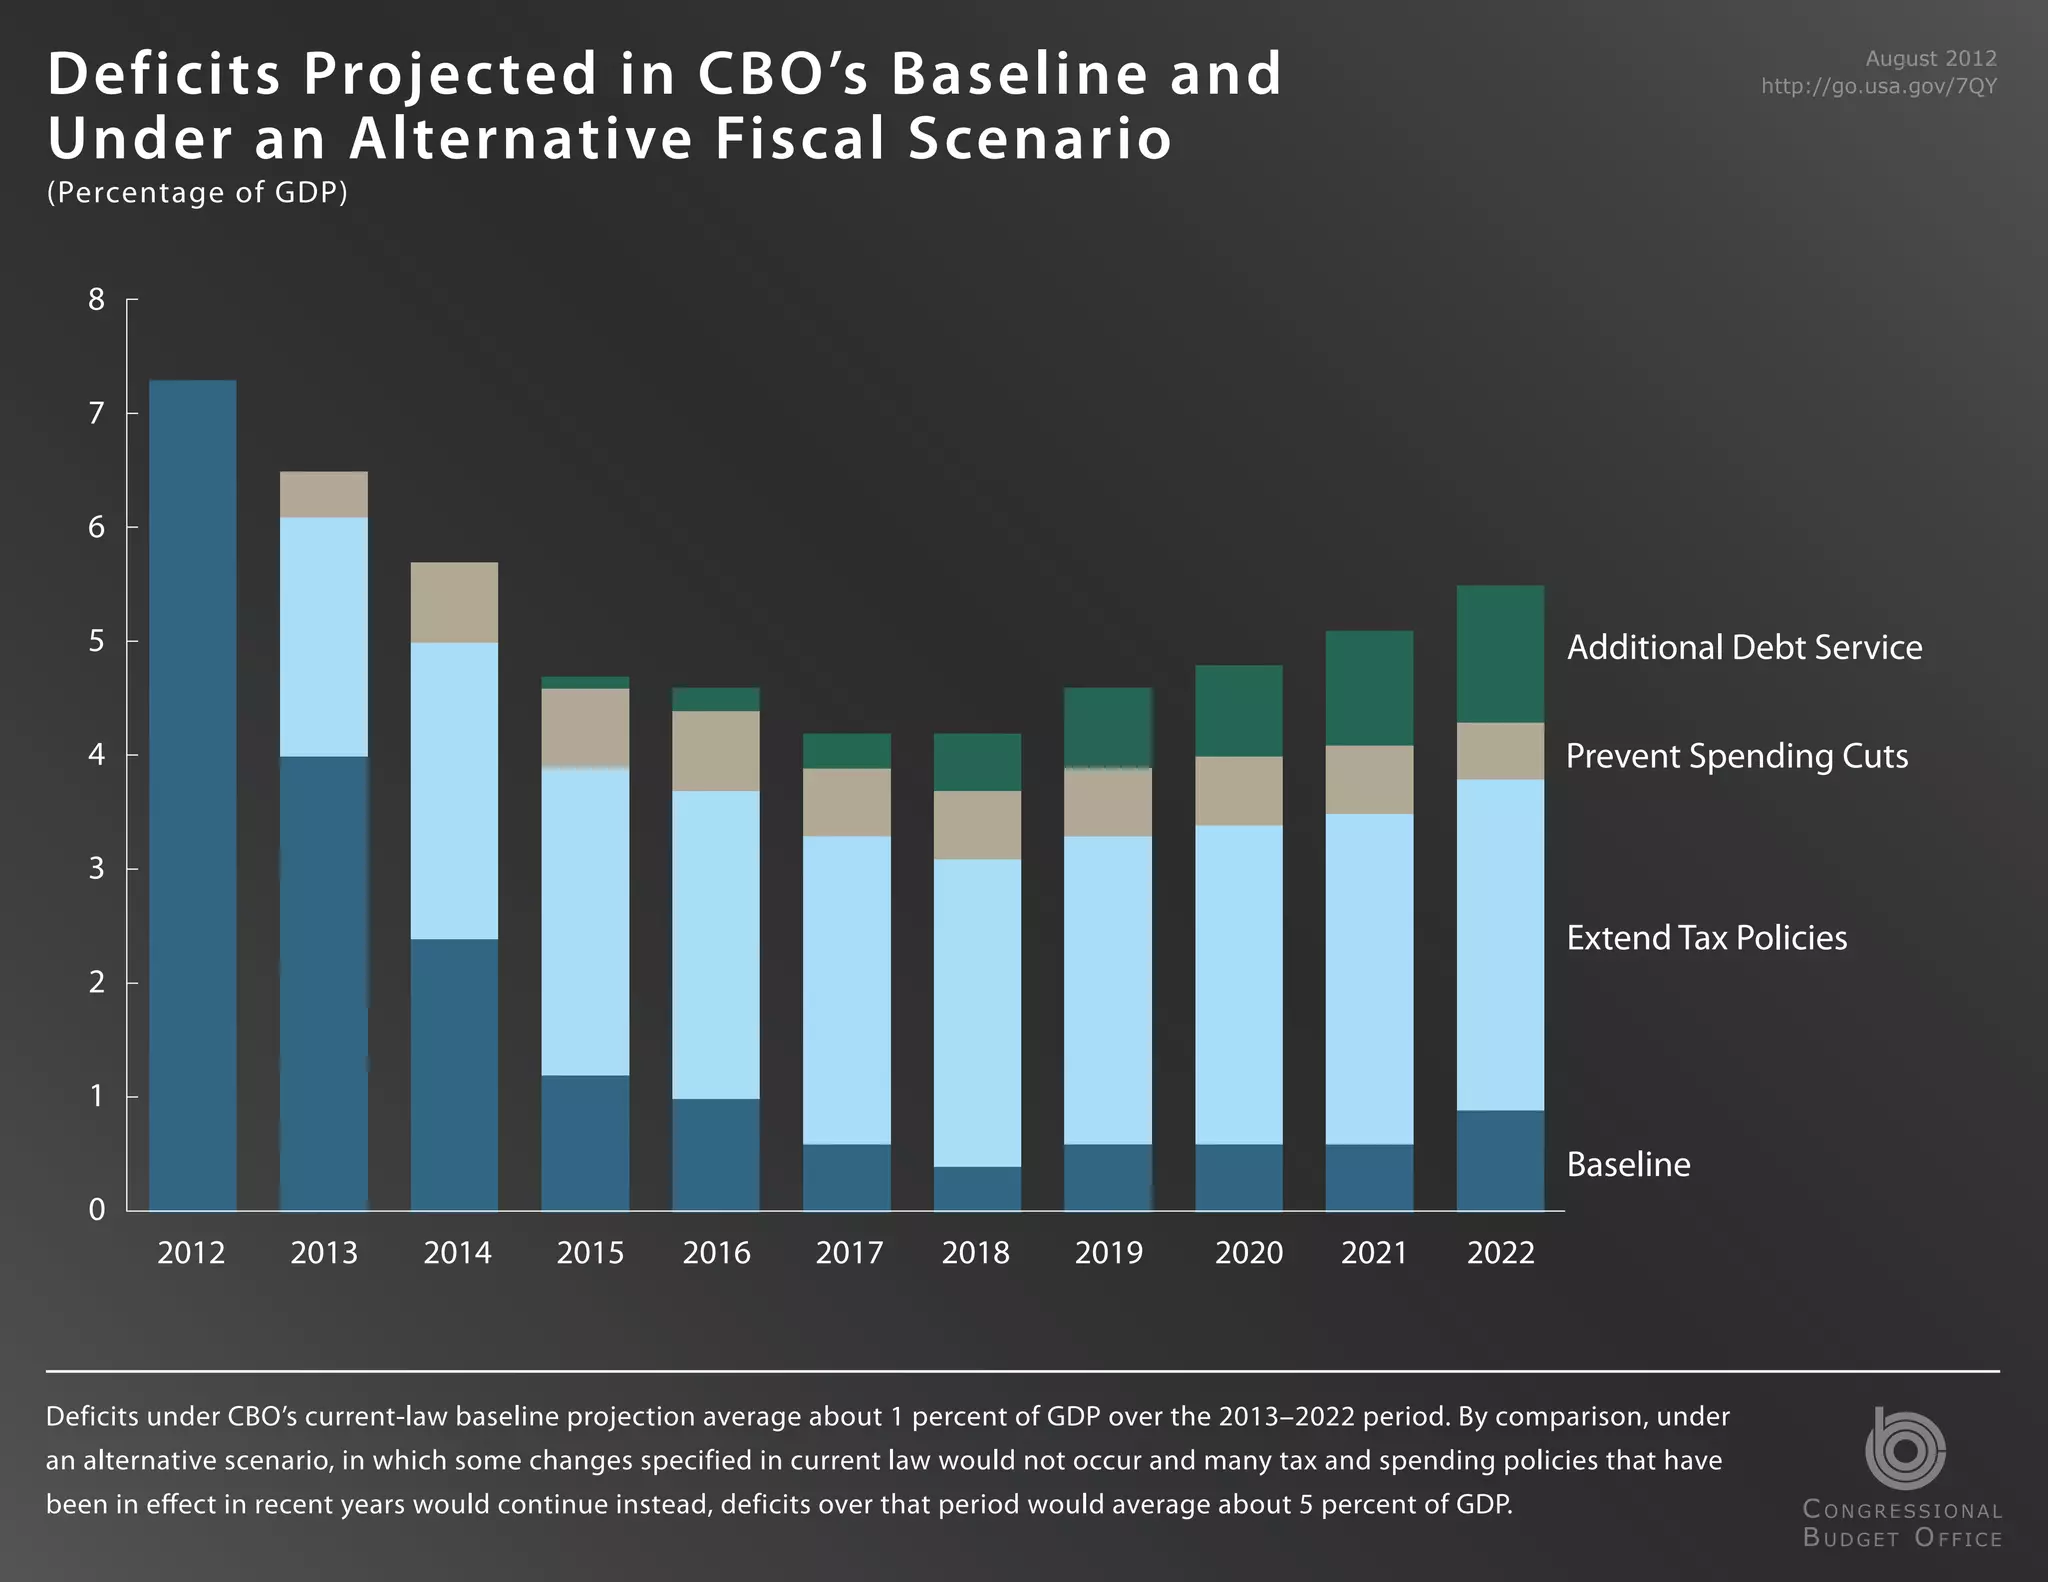
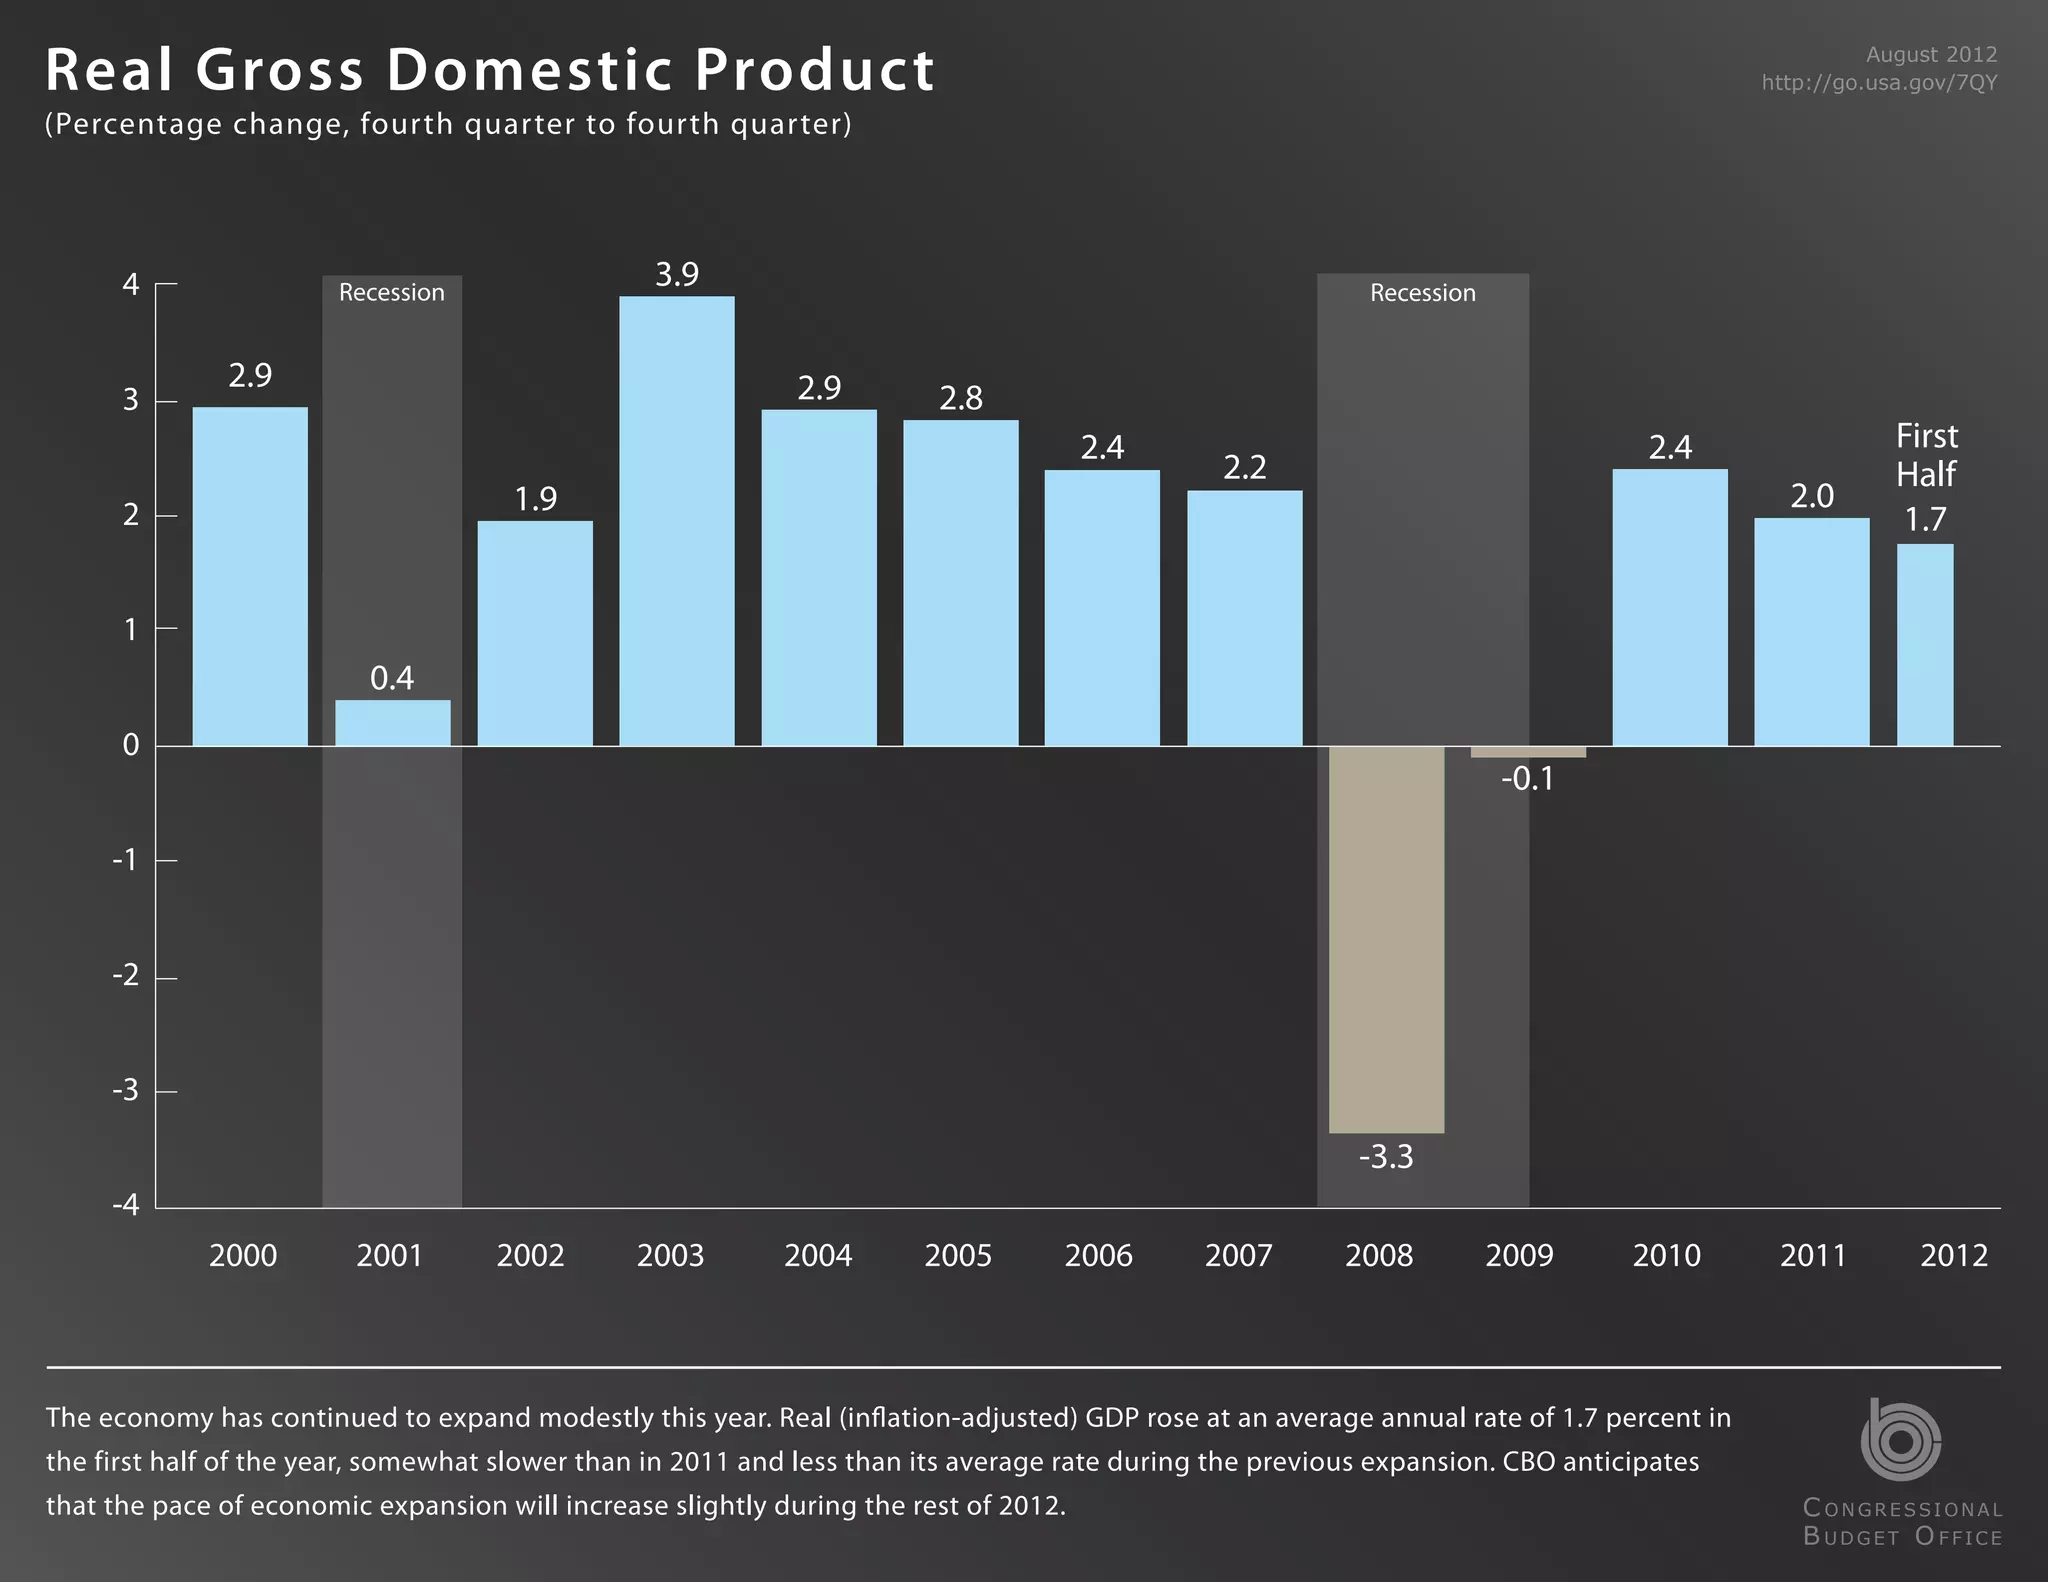
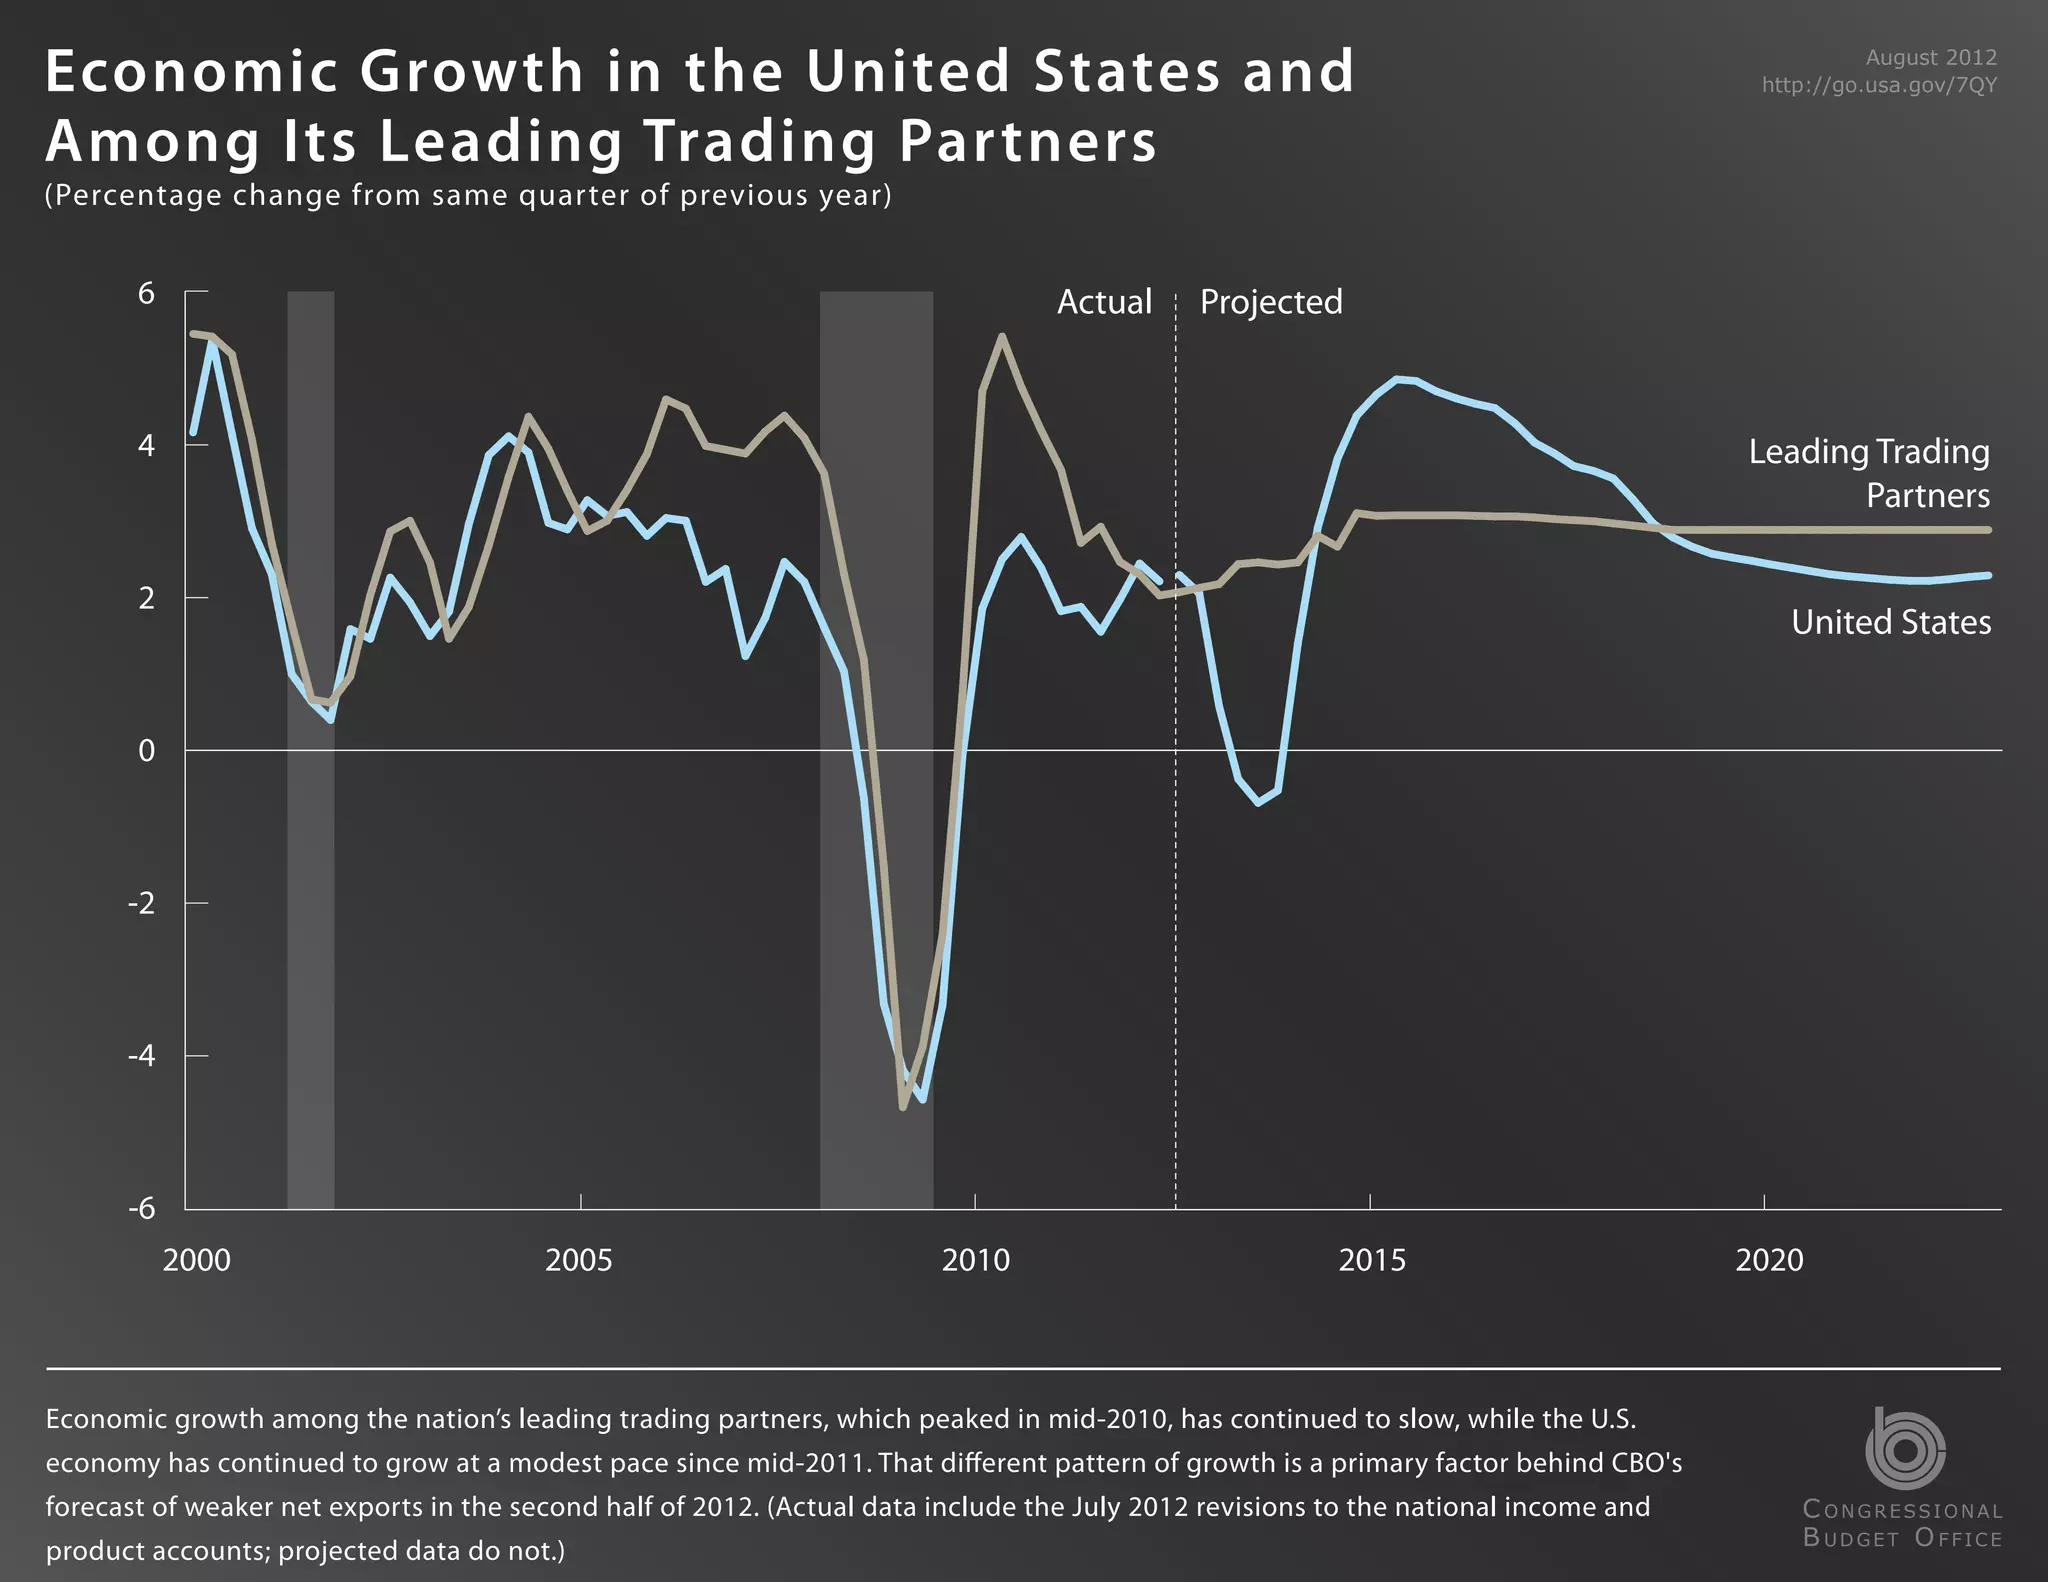
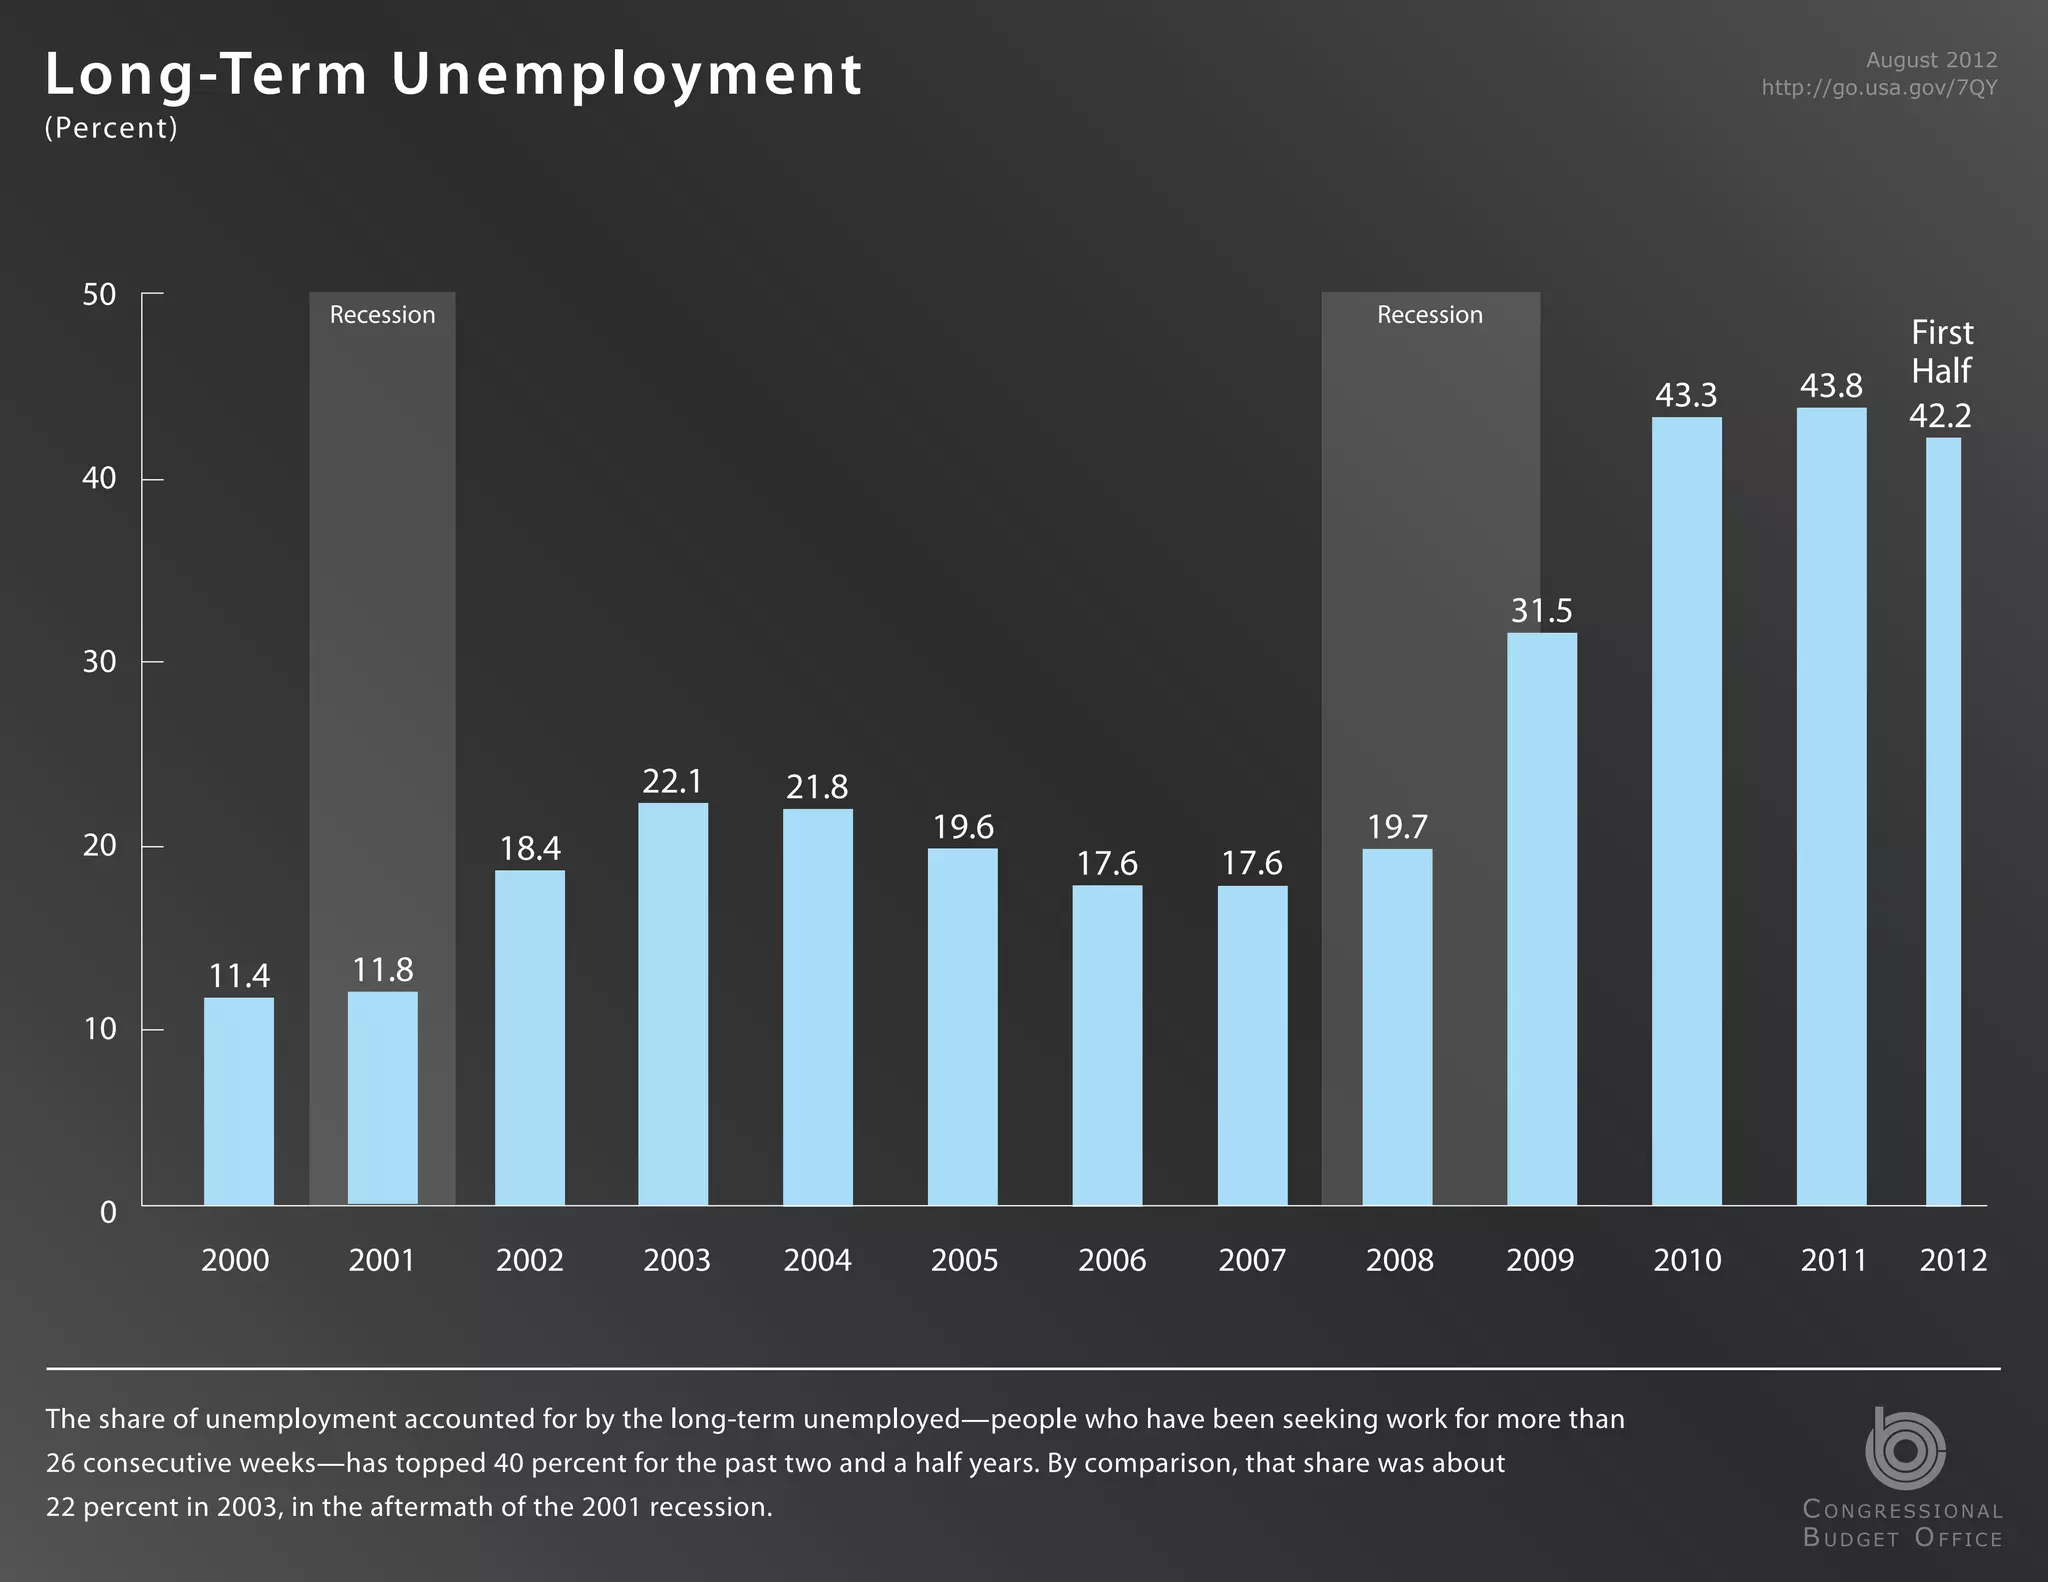
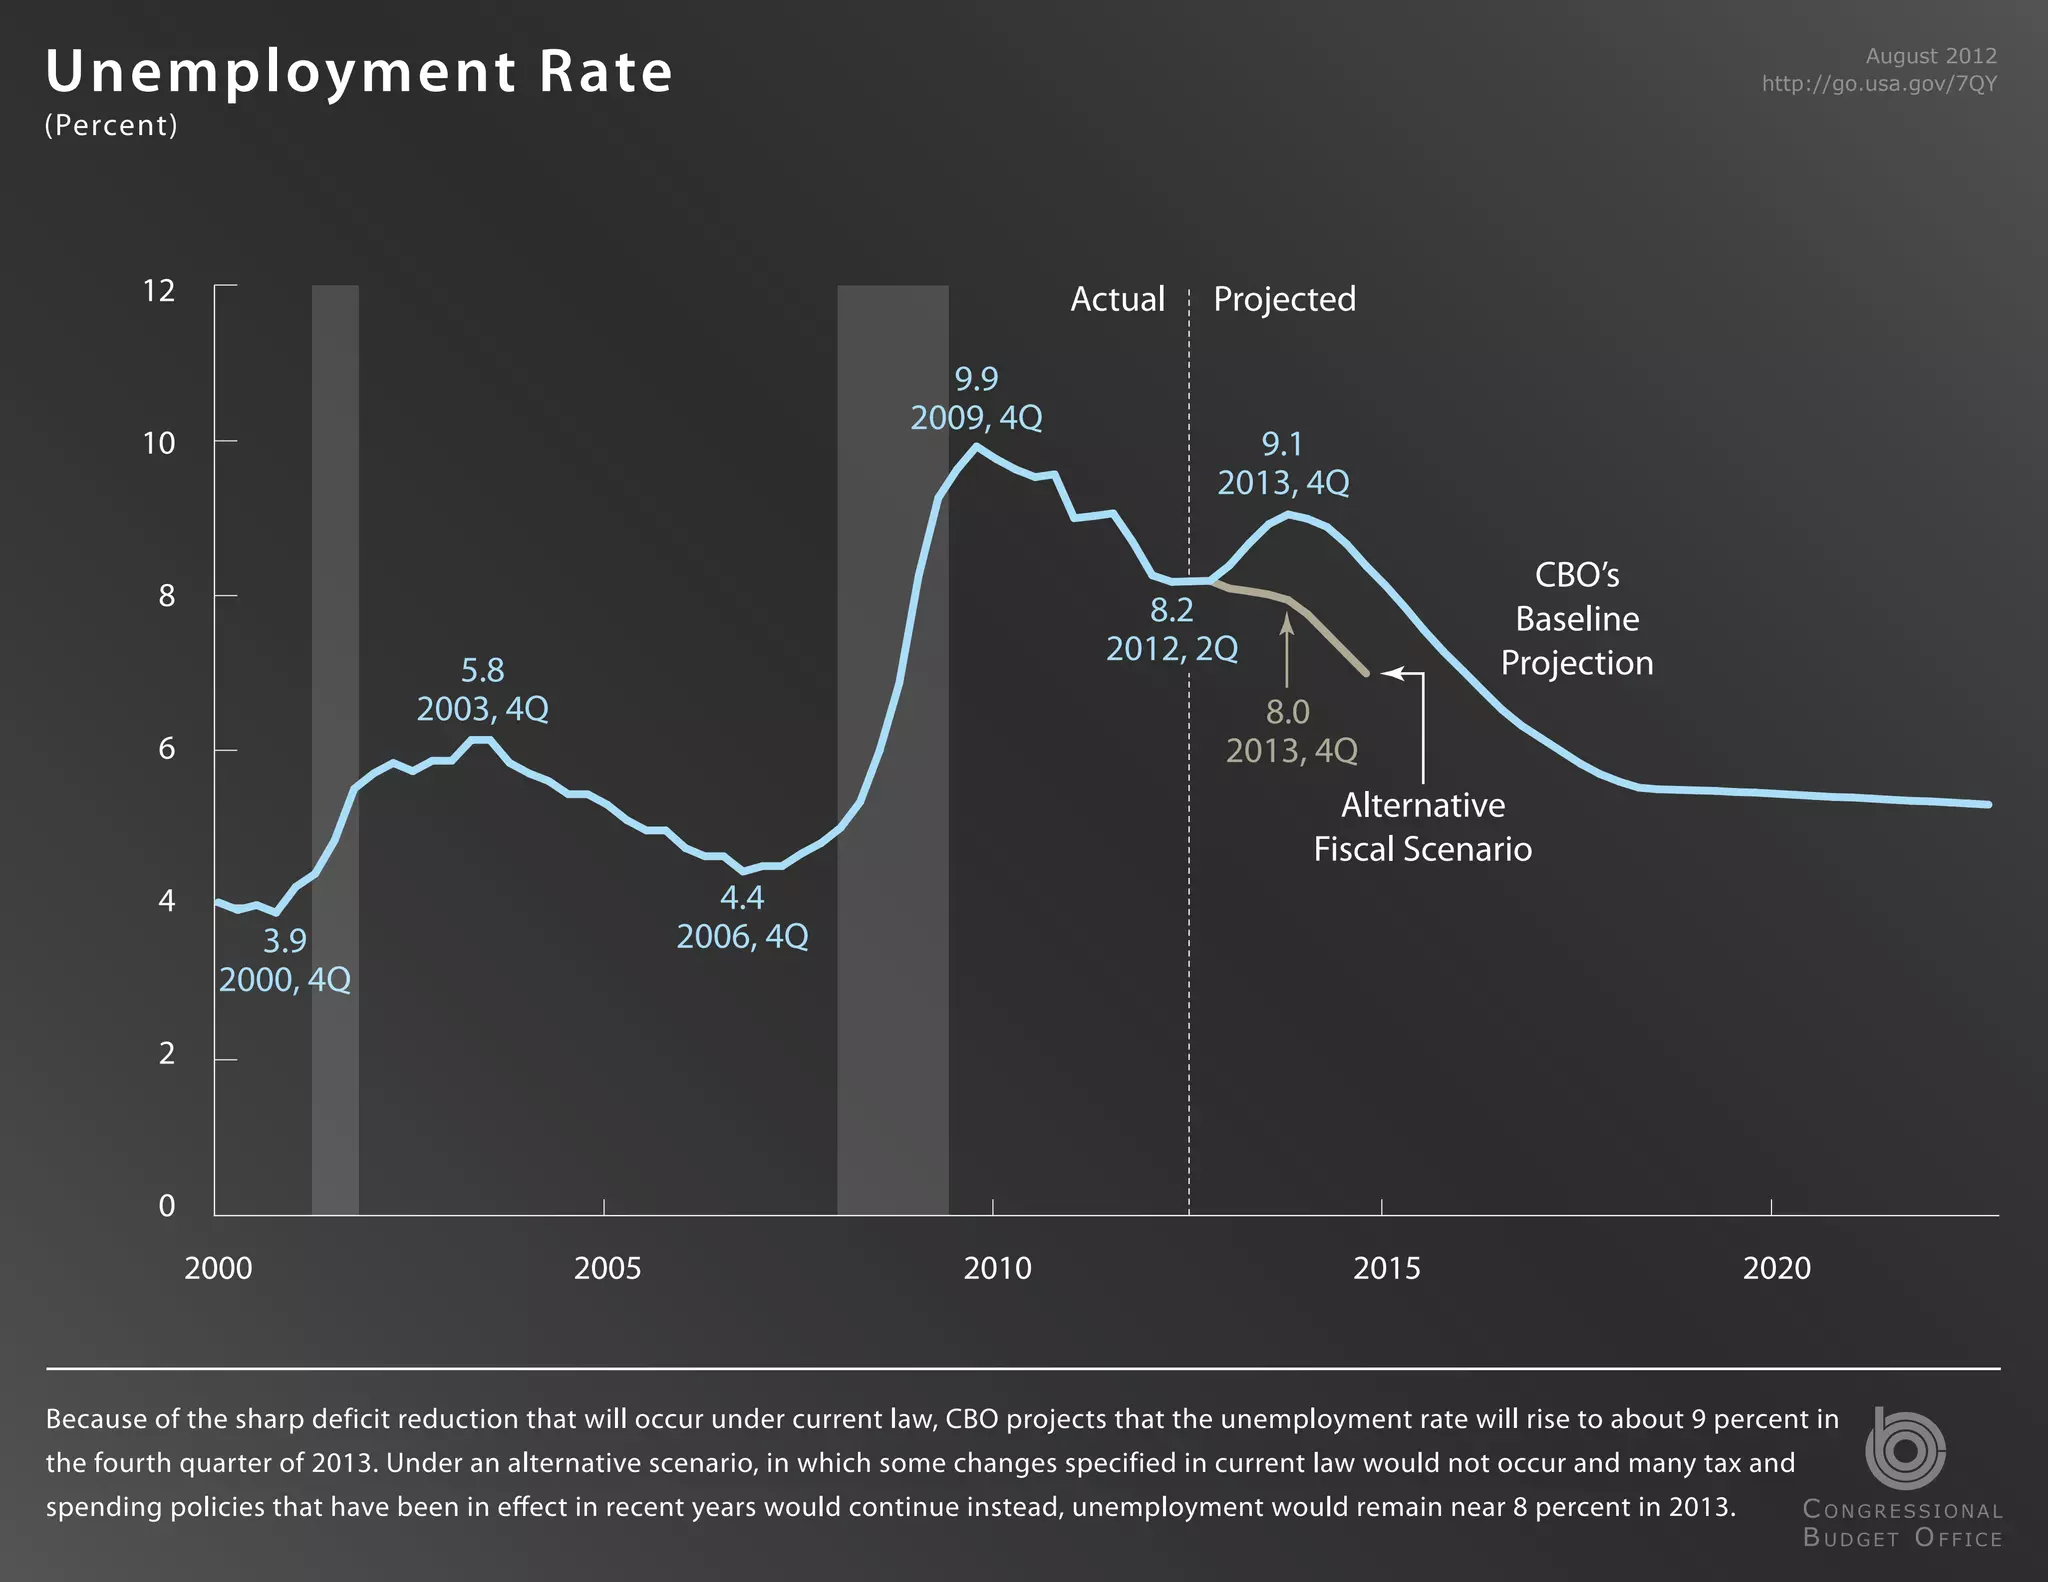
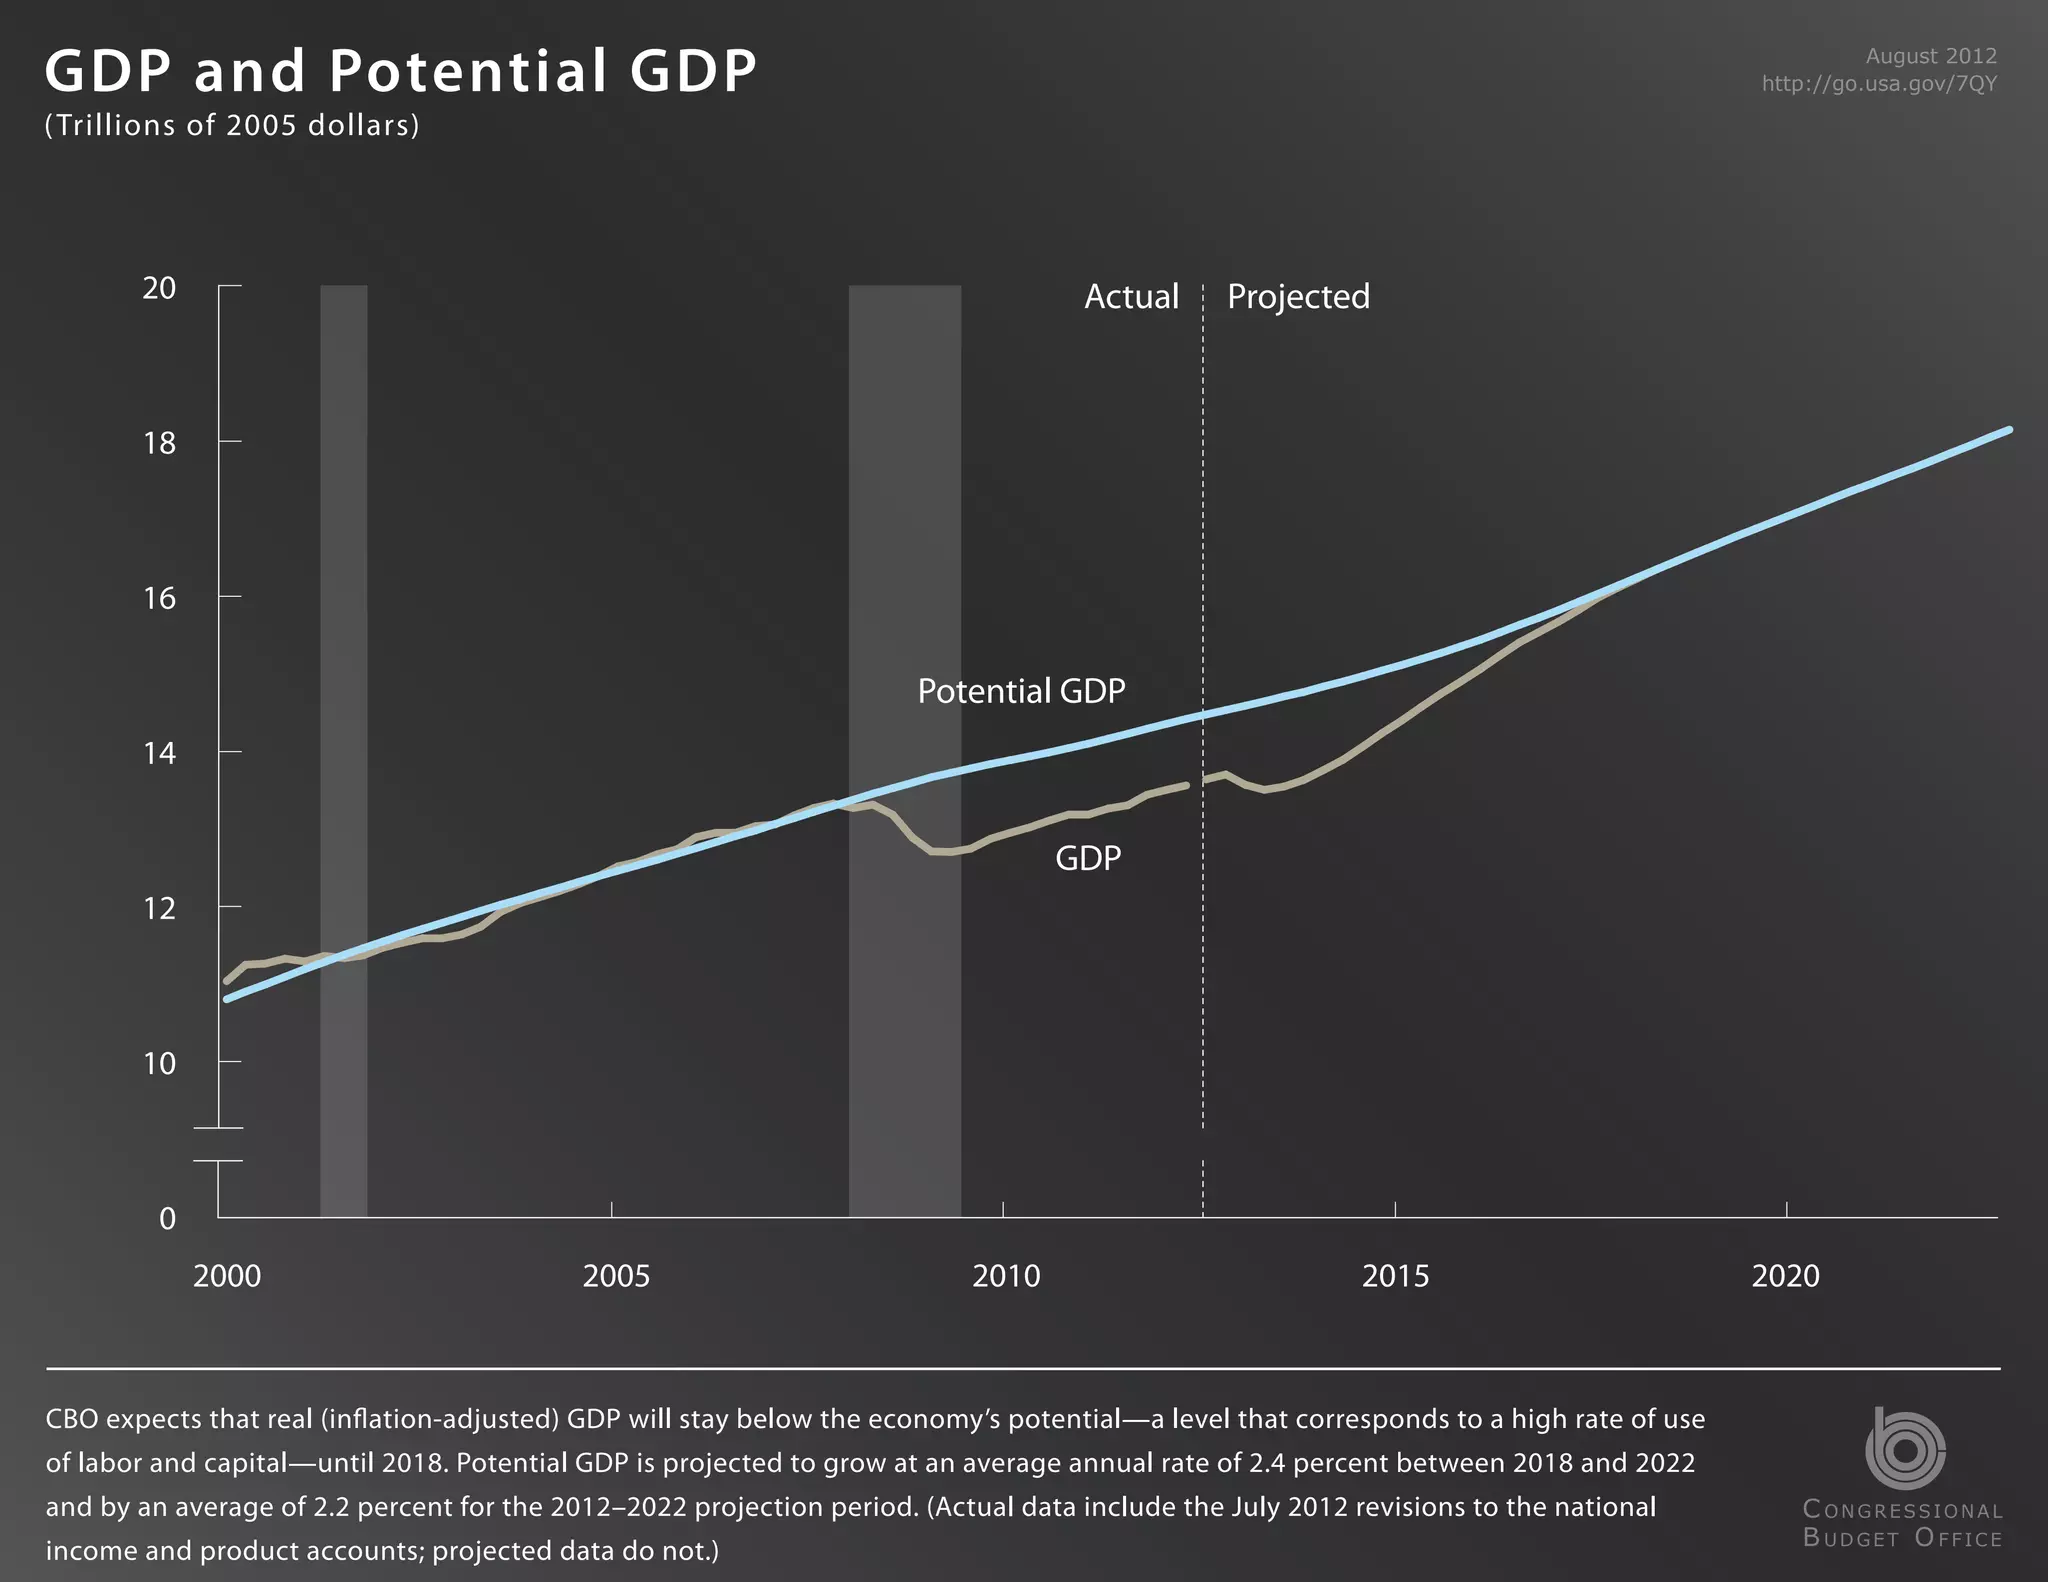

Federal debt held by the public is projected to decline to 58% of GDP by 2022 under current law but rise to 90% of GDP if certain policies are continued. Long-term unemployment over 40% for past 2.5 years indicates a still-weak labor market. Real GDP growth is projected to remain below potential through 2018 as deficit reduction under current law may cause unemployment to rise to around 9% in late 2013.


